




Written by: Aaron Rovner, Founder, Saas Hero | Last updated: July 7, 2026
Key Takeaways
- A B2B SaaS competitor analysis template turns scattered pricing, feature, and review data into a repeatable system that supports faster messaging, roadmap, and pricing decisions.
- Weekly 15-minute updates prevent the multi-week lag that occurs when battlecards go stale, so reps work from current competitive knowledge.
- The five-step framework of identifying competitors, populating core fields, building matrices, running SWOT, and translating insights stays lightweight and connects directly to Net New ARR and CAC.
- Structured SWOT and pricing analysis reveal positioning gaps and objection-handling opportunities that lift win rates on competitive deals.
- To turn competitive intelligence into pipeline growth, book a discovery call with SaaSHero and implement a conquesting program that converts template insights into ARR.
Why Founders Need a Weekly B2B SaaS Competitor Analysis Template
The core problem is not a lack of competitor data. The real gap is a repeatable system to collect, organize, and act on that data. Crayon’s 2025 State of Competitive Intelligence report finds that 68% of sales deals now involve at least one direct competitor, yet many sales teams still rate their competitive selling ability as needing improvement. Without a structured template, founders make pricing calls from stale screenshots, lose deals to unanticipated objections, and ship roadmap features that mirror what competitors already offer.
A weekly update cadence keeps that system current. Battlecards typically become outdated within 30 days due to weekly feature releases, quarterly pricing changes, and positioning shifts. Manual processes create a 6–9 week lag from competitor action to rep knowledge. For a capital-efficient team at $500K–$10M ARR, that lag erodes pipeline and inflates CAC.
Prerequisites That Remove the Competitive Lag
To eliminate that lag and maintain current intelligence, you need a few foundational inputs in place before you populate the template.
- Free G2 or Capterra account for review mining and competitor ratings
- Access to each competitor’s live pricing page and Wayback Machine history
- CRM visibility into lost-deal reasons by competitor name
- Google Alerts configured for each competitor name plus modifiers like “pricing” and “launch”
- LinkedIn company follows for hiring signal monitoring
Three B2B SaaS concepts anchor every field in the template to revenue outcomes. The first concept, Net New ARR impact, asks whether a competitor’s pricing move or feature launch is pulling deals away from your pipeline. When that happens, you face CAC implications, because a rival’s self-serve motion can lower their acquisition cost below yours and force you to compress margin on competitive deals just to stay in contention. This dynamic compounds across multi-stakeholder buying cycles, where B2B buying committees typically include 6–10 stakeholders, so your battlecard must arm every stakeholder touchpoint, not just the AE.
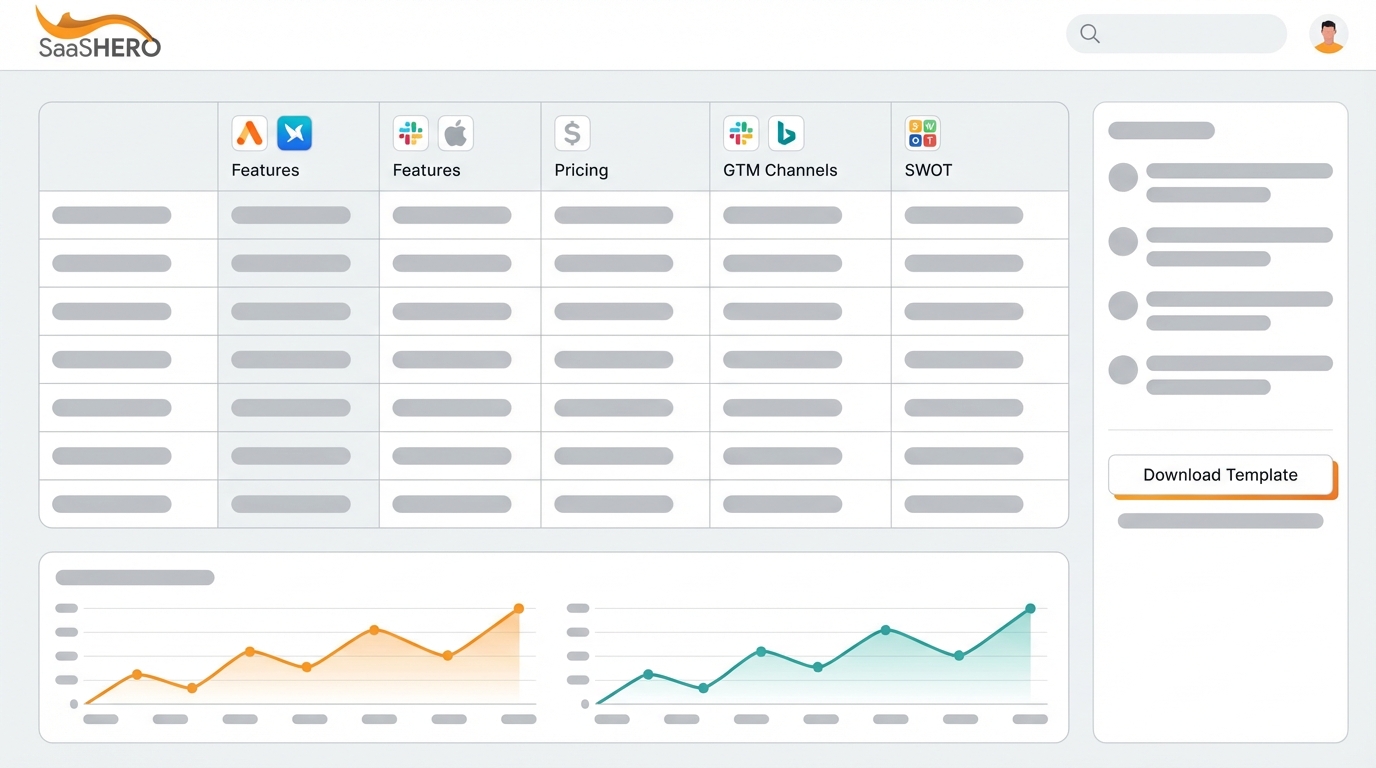
The template itself is a lightweight 10–15-field living asset maintained across two tabs in Google Sheets or mirrored in Notion. One tab holds an MVP tracking grid, and the other holds a head-to-head comparison matrix. Limiting the number of active competitors keeps the document maintainable at a 15-minute weekly update cadence.
The 5-Step Weekly Competitor Intelligence Framework
| Step | Action | Initial Setup Time | Weekly Maintenance Time | Primary Output |
|---|---|---|---|---|
| 1 | Identify 5–10 key competitors | 60 min one-time | Ad hoc updates | Tiered competitor list |
| 2 | Populate core data fields (Company Overview) | ~90 min first competitor; ~20 min each additional | Quarterly spot-check | Completed profile rows |
| 3 | Build feature and pricing matrices | 30 min per competitor | Monthly spot-check | Comparison matrix tab |
| 4 | Run sentiment and SWOT analysis | 20 min per competitor | Monthly refresh | SWOT quadrant + review themes |
| 5 | Translate insights into positioning and pricing actions | 15 min first run | 15 min weekly | Battlecard updates + action items |
Steps 1–4 represent one-time setup costs with periodic refreshes. Step 5 represents the ongoing weekly maintenance cadence that keeps pricing and positioning aligned with current competitor moves.
Step 1: Build a Tiered List of 5–10 Key Competitors
Purpose: Build a tiered list that separates direct rivals with the same ICP and price band from indirect alternatives with overlapping use cases. This focus keeps your weekly 15-minute update aimed at the competitors that create the highest deal risk.
Actions in Sheets/Notion: Create a “Competitor Roster” tab with three tiers. Tier 1 includes competitors mentioned in three or more lost deals per quarter. Tier 2 includes tools that appear in prospect research. Tier 3 includes vendors you simply watch. Pull lost-deal data from your CRM filtered by competitor field. Cross-reference with G2 category pages and Capterra “Compare” listings for your product category.
Inputs: CRM lost-deal reports, G2 category grid, Capterra alternatives pages, and sales team input on objection frequency.
Outputs: A named, tiered list of 5–10 competitors with URLs, funding stage, and estimated headcount sourced from LinkedIn and Crunchbase.
Validation criteria: Every Tier 1 competitor appears in at least one lost-deal CRM record from the past 90 days. A low win rate where most losses trace to one specific competitor signals a positioning problem that targeted intelligence and battlecards can address.
Common mistake: Tracking more than 15 competitors from day one. Start with 2–3. Unkover advises B2B SaaS teams to start with 2–3 competitors on the track list and a weekly cadence while implementing a 15-minute weekly workflow to keep profiles current.
Step 2: Fill the Core Company Overview Fields
Purpose: Establish the static profile layer for each competitor. These fields change slowly and inform quarterly positioning decisions rather than weekly deal tactics.
Actions in Sheets/Notion: For each competitor row, complete these 10 core fields drawn from a competitor analysis template excel free format that maps directly to revenue decisions:
- Competitor name and URL
- One-sentence product or offer summary
- ICP and target segment by company size, industry, and persona
- Pricing model type such as free tier, per-seat, usage-based, or enterprise quote
- Verbatim positioning or core promise copied from the homepage H1 and LinkedIn tagline
- Two to three key differentiating features from the homepage and product tour
- Primary marketing channels and messaging themes
- Two to three main strengths verified from G2 and case studies
- Two to three main weaknesses from recurring G2 “cons”
- Dominant customer sentiment or review theme
Pricing information directly affects revenue and deserves a more frequent refresh than other static fields. Review competitor pricing pages regularly and update the template when you see changes. Verbatim positioning benefits from a quarterly refresh, because messaging shifts often precede formal announcements. Transparent pricing on a competitor’s page signals a self-serve or inside sales motion, while hidden pricing signals an enterprise sales motion, which directly informs how you structure your own pricing page and sales CTA.
Tip: Use the Wayback Machine at web.archive.org to compare a competitor’s current homepage headline against their version from six months ago. A headline pivot often signals an ICP shift or a response to market pressure before any press release appears.
Troubleshooting: If revenue or market share data is unavailable, especially for private companies, leave those fields blank. Data on revenue, company size, and market share can be difficult to obtain and may not always add decision-useful value.
Step 3: Build Feature and Pricing Comparison Matrices
Purpose: Create a scannable comparison layer that sales reps can reference during live demos and that product teams can use to spot roadmap white space.
Actions in Sheets/Notion: Add a second tab titled “Feature + Pricing Matrix.” Use columns for competitors and rows for the five to eight core capabilities your ICP cares most about. Use a simple three-value scale with checkmarks for available, tildes for partial or limited, and crosses for absent. For pricing, capture entry tier price, mid-tier price, and an enterprise pricing signal such as public versus quote-only.
Pricing analysis highlights tier structures, models, and price points that reveal specific openings. A 2.7x price jump between Starter and Professional tiers creates an opening for a mid-market alternative with more gradual scaling.
Decision point: When two or more competitors make the same feature claim on their homepage, that claim has become table stakes. In that case, the feature no longer differentiates, and your positioning should move to a different axis.
Mid-article CTA: The template structure described in this article is available as a plug-and-play Google Sheets and Notion file. If you want expert help building and activating your competitive intelligence program, including mapping it to paid search conquesting campaigns, book a discovery call with SaaSHero.
Step 4: Turn Reviews into a Structured SWOT
Purpose: Convert raw review data and public signals into a structured SWOT quadrant that informs both sales battlecards and product prioritization.
Actions in Sheets/Notion: For each Tier 1 competitor, read the 10 most recent G2 or Capterra reviews, with five 5-star and five 3-star. Extract the single most repeated praise as a Strength and the single most repeated complaint as a Weakness. Map these into a SWOT quadrant with Strengths and Weaknesses from the competitor’s perspective and Opportunities and Threats from your perspective. Limit each quadrant to three to five bullets drawn from public reviews, and cite sources where appropriate.
Inputs: G2 review exports, Capterra “cons” sections, Reddit threads, and support community posts.
Decay threshold: Refresh customer feedback on weaknesses by reviewing recent reviews and objection patterns on a regular schedule.
Revenue connection: The SWOT step acts as a lightweight proxy for a formal win-loss program at sub-$5M ARR, where dedicated interview programs are not yet feasible.
Mistake to avoid: CRM-recorded loss reasons align with direct buyer interviews only 15% of the time, so rep self-reporting alone cannot substitute for review mining in this step.
Step 5: Turn Insights into Positioning and Pricing Actions
Purpose: Convert the populated template into three concrete outputs. These outputs include an updated positioning statement, a pricing page adjustment recommendation, and one roadmap input, all tied to measurable pipeline metrics.
Actions in Sheets/Notion: After each weekly 15-minute update, use the observation-analysis-opportunity framework to move from data to action. First, state what the data shows in one sentence. Next, explain why this matters for pipeline in another sentence. Finally, define one action to take this week that responds to the pattern you see. Assign an owner and a deadline directly in the Notion page or Sheets comment so the action connects back to the three outputs.
Measurement guidance: Track two metrics quarterly to validate that the template influences revenue. First, measure competitive win rate by Tier 1 competitor using CRM data. Second, measure pricing page conversion rate before and after any pricing adjustment informed by the matrix. McKinsey research found that B2B companies with systematic win/loss analysis programs improve win rates by 15–25% over two years compared to teams relying solely on rep self-reporting, which is the outcome this template helps approximate at earlier stages.

Attribution challenge: Isolating the template’s contribution to win-rate improvement is difficult because positioning changes, product releases, and sales coaching all occur at the same time. A quarterly refresh cadence that aligns template updates with quarterly business reviews provides the cleanest before and after comparison window. The differentiator field versus each competitor should be re-validated via win/loss interviews and closed-won deal notes after every major product release or on a quarterly basis.
SaaS product positioning directly influences CAC, LTV, conversion rates, and sales cycle length, which makes the translation step from raw competitor data to a revised value proposition the highest-leverage activity in the entire framework.
Advanced Extensions for Teams Tracking 15+ Competitors
Once the core 5-step workflow is stable, three extensions increase signal quality without a proportional increase in time investment.
Looker Studio integration: Connect your Google Sheets template to a Looker Studio dashboard that auto-refreshes pricing and review data. Overlay CRM win/loss data by competitor to visualize which rivals appear most often in lost deals by deal size and segment.
Paid media conquesting links: Map each competitor’s SWOT weakness field directly to a conquesting landing page theme. A competitor with recurring complaints about poor onboarding becomes the basis for a “[Competitor] alternative” page that leads with “Onboard in 48 hours.” A company lost $240K in ARR annually due to dead battlecards, with a $60K contribution margin impact, which represents a direct cost that conquesting pages with current messaging can prevent.

AI discoverability monitoring: AI agents increasingly influence purchase decisions, with ChatGPT traffic converting 9x higher than Google organic. Add a monthly check where you query “best [your category] tool” in ChatGPT, Perplexity, and Claude, and record which competitors appear. Store this emerging signal in a dedicated “AI Visibility” row in your competitor roster.
To turn your competitive intelligence into paid search campaigns that target buyers actively evaluating your rivals, book a discovery call with SaaSHero and see how the competitor conquesting framework works in practice.
Quick-Start Checklist and Next Actions by Team Size
Use this checklist to confirm the template is operational before the first weekly review.
- ☐ Google Sheets template created with MVP tracking grid and comparison matrix tabs
- ☐ Notion page, optional, mirroring the Sheets structure for inline notes and battlecard links
- ☐ Five to seven Tier 1 competitors identified from CRM lost-deal data
- ☐ Google Alerts configured for each competitor name plus “pricing” and “launch”
- ☐ G2 or Capterra bookmarked for each competitor’s review page
- ☐ Pricing page URLs saved with Wayback Machine baseline snapshot
- ☐ Weekly 15-minute calendar block scheduled, with Friday recommended before Monday pipeline reviews
- ☐ SWOT quadrant completed for the top three Tier 1 competitors
- ☐ One positioning action item assigned with owner and deadline
Solo founders ($500K–$2M ARR): The free template above covers everything you need. Maintain it yourself using the 15-minute weekly cadence. For lightweight early-stage teams, maintaining the competitive analysis template in Notion or Confluence paired with Google Alerts and manual G2 review monitoring requires no enterprise tools.
Funded teams ($2M–$10M ARR): The template provides the foundation, and translating competitive insights into paid search conquesting campaigns, TCO comparison landing pages, and CRM-integrated battlecards requires dedicated execution. SaaSHero’s month-to-month retainer, starting at $1,250 per month with no lock-in contract, provides a senior-led team that converts your competitor intelligence directly into Net New ARR. Book a discovery call to see how SaaSHero maps your competitor data to pipeline growth.
Frequently Asked Questions
How long does it take to set up the template for the first time?
The initial setup covers creating the Google Sheets tabs, configuring Google Alerts, and completing the first competitor profile. This work takes approximately 90 minutes for the first competitor and 20 minutes for each additional one. A five-competitor template becomes fully operational in roughly three hours. After setup, the ongoing maintenance cadence drops to 15 minutes per week for pricing and positioning updates, with a deeper two to three hour refresh recommended monthly to incorporate win/loss data and new G2 reviews.
Can a sub-$1M ARR team use this template effectively without a dedicated analyst?
A sub-$1M ARR team can use this template effectively without a dedicated analyst. The template is designed for founder-led teams where time is the main constraint. Limiting the active competitor list to five, using Google Alerts as a passive monitoring layer, and anchoring the weekly update to a single 15-minute calendar block keeps the process sustainable. The most useful discipline is starting with a specific business question such as “Why are we losing sign-ups to this tool?” rather than trying to fill every field comprehensively from day one. A partial template updated consistently outperforms a comprehensive template that goes stale.
What are the most common data gaps in a B2B SaaS competitor template, and how do founders handle them?
The three most common gaps are private company revenue figures, enterprise pricing details, and internal roadmap signals. For revenue and headcount, use LinkedIn employee count trends and funding stage as proxies. A Series B company with 150 employees in a $50 per seat category implies a rough ARR range without exact figures. For hidden enterprise pricing, monitor G2 reviews where customers occasionally mention contract values, and use sales call intelligence from your own lost deals. For roadmap signals, track competitor job postings weekly, because a sudden cluster of ML engineer postings signals an AI feature investment six to twelve months out. Fields that cannot be sourced reliably should stay blank rather than filled with estimates that degrade trust in the entire document.
How often should the full template be refreshed, and what triggers an out-of-cycle update?
The standard cadence includes a 15-minute weekly update for pricing and recent product moves, a monthly two to three hour refresh for the full competitive matrix and battlecards, and a quarterly half-day deep dive to update all profiles and present a positioning brief to leadership. Four events trigger an out-of-cycle update. These events include a competitor announcing a major feature launch or rebrand, a competitor changing pricing detected via Google Alert or Visualping, a competitor appearing in three or more lost deals within a single month, or a competitor raising a significant funding round. Any of these events warrants updating the affected competitor’s profile within 48 hours and distributing a brief Slack summary to the sales team.
How This Template Connects to ARR Growth and CAC Reduction
The template creates revenue impact through three direct mechanisms. First, the pricing matrix identifies gaps such as a competitor’s steep price jump between tiers that your pricing page can exploit with a more gradual scaling structure, which improves conversion rates for mid-market prospects. Second, the SWOT weakness field feeds objection-handling scripts that sales reps use in competitive deals, which improves win rates on deals where a specific rival is mentioned. Third, the positioning field highlights messaging white space, meaning claims no competitor is making that your ICP values, which informs homepage copy, paid ad headlines, and outbound sequences. Companies with formal competitive intelligence programs often report higher win rates in competitive deals, and the template acts as the minimum viable version of that program for early-stage teams. The connection to CAC reduction is indirect, because higher win rates on existing pipeline lower the cost per closed deal without requiring additional top-of-funnel spend.