




Written by: Aaron Rovner, Founder, Saas Hero | Last updated: August 20, 2026
Key Takeaways
- B2B SaaS sales cycles for deals over $100K ACV now average 90–180 days, with buying groups of 5–16 stakeholders who each need tailored proof at different stages.
- Four unit-economic metrics—CAC, LTV, payback period, and pipeline velocity—improve when stage-specific collateral shortens cycle length and raises win rates.
- Seven high-impact assets (ROI/TCO calculators, quantified case studies, battlecards, mutual action plans, security packs, champion kits, and interactive demos) map directly to deal stages and buyer personas and replace stale, unused PDFs.
- Success hinges on rep-friendly formats, regular 30- to 90-day refresh cycles, and CRM-embedded distribution so reps can locate the right asset in under ten seconds.
- Schedule a collateral audit with SaaS Hero to map your current assets against these seven types and identify the gaps stalling your pipeline.
Introduction: Turning Proof into a Deal-Winning System
Complex B2B SaaS deals rarely fail because the product is weak. They stall because each stakeholder receives the wrong proof at the wrong time. A buying committee of 5–16 people moves through a 90–180 day cycle, and every person needs different evidence at each stage.
This article maps seven high-impact collateral assets to specific deal stages and buyer personas. Together they form a system that compresses cycles, raises win rates, and improves CAC, LTV, and payback period. You will see how each asset hands off to the next, how to measure impact, and which pitfalls quietly kill performance.
1. ROI/TCO Calculators: Building the Financial Case Early
ROI and TCO calculators are the highest-leverage early-to-mid-funnel asset for complex B2B SaaS deals. B2B SaaS companies using interactive ROI calculators often see higher lead-to-demo conversion rates and shorter sales cycles compared with baseline. Many B2B buyers run a self-directed ROI analysis before engaging a vendor’s sales team, so the calculator doubles as a pre-sales qualification tool and a closing asset.
The calculator serves three cross-functional roles at once. For the economic buyer (CFO or VP Finance), it translates product capabilities into payback period and NPV. For the champion (VP Sales, VP Operations, or IT Director), it provides a pre-built internal business case. For procurement, it anchors the TCO conversation before a competing vendor does. Because the calculator serves all three roles, it should appear early in the Business Case stage and stay active through Procurement, which Forrester research on B2B procurement cycles identifies as the longest single phase of any enterprise deal.
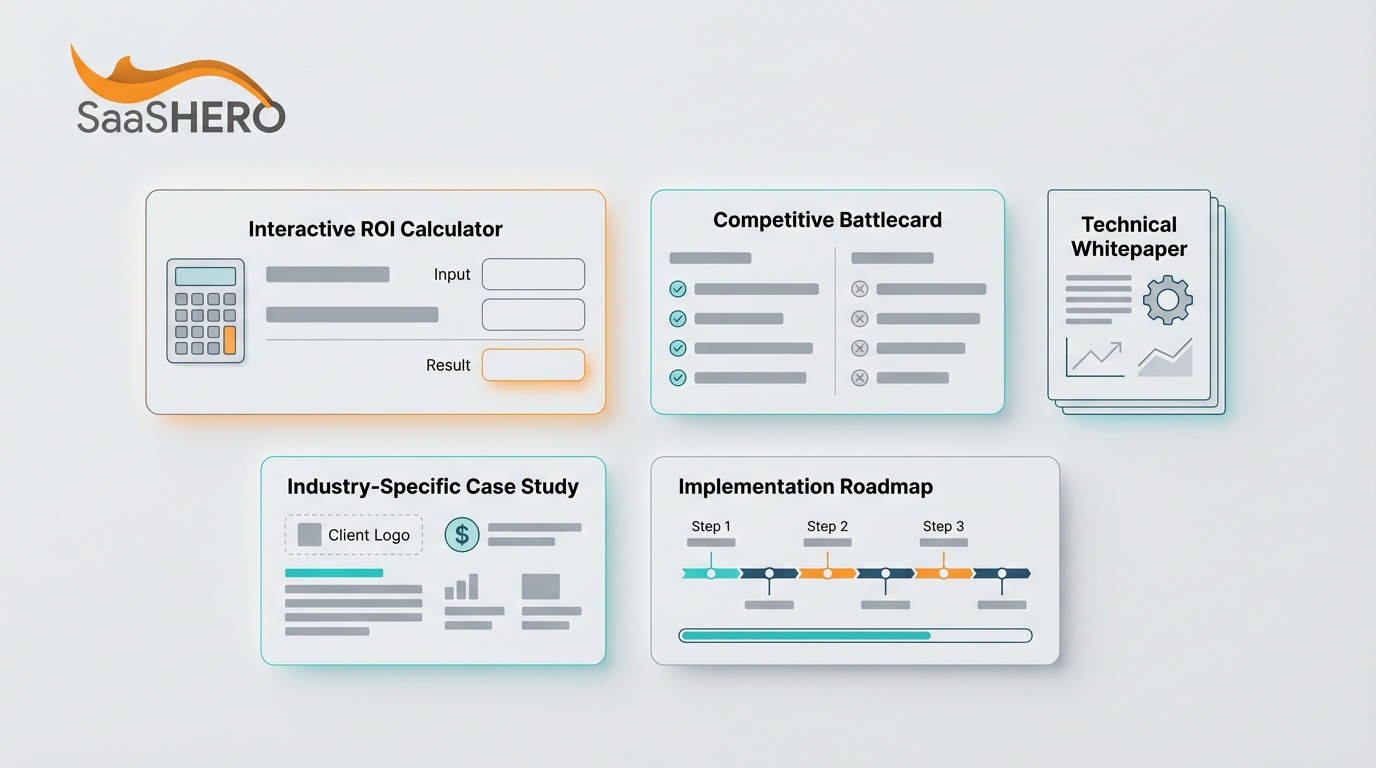
Practical components of an effective ROI/TCO calculator include:
- Customer-specific input fields for headcount, current tool spend, and process hours lost
- Industry benchmark ranges pre-populated from anonymized customer data
- A three-year NPV output alongside a payback period in months
- A one-page PDF export formatted for CFO or board presentation
- A sensitivity toggle showing best-case, base-case, and conservative scenarios
A mid-market HR Tech vendor deploying an interactive calculator saw average time on page increase from 52 seconds to 3.5–4.5 minutes, consistent with Outgrow’s ROI Calculator Performance Benchmarks. Buyers who build their own business case using a vendor’s calculator are 2.1x more likely to complete a purchase than those handed a pre-made case study.
The primary pitfall is over-engineering inputs. Calculators with more than eight input fields see completion rates drop sharply. A secondary pitfall is using industry averages that do not reflect the prospect’s vertical, which erodes credibility with financially sophisticated buyers.
Monitor two metrics. Track lead-to-demo conversion rate on pages where the calculator is embedded. Track time-in-stage reduction between Business Case and Procurement for deals where the calculator PDF reached the economic buyer.
Once prospects see a credible financial upside in the calculator, they look for proof that similar companies achieved those results. Quantified case studies provide that social proof.
2. Quantified Case Studies: Proving the Numbers with Peers
Quantified case studies are the primary proof asset for the Consideration and Evaluation stages. B2B companies that use case studies effectively are 67% more likely to close deals, a reflection of the fact that nearly four in five B2B buyers rely on case studies during vendor evaluation. The asset works because it transfers risk. A prospect evaluating a $150K ACV platform wants to see that a similar company in a similar vertical achieved a concrete outcome.
The strongest case studies follow a challenge → solution → measurable result structure and lead with the quantified outcome rather than the customer narrative, per the April 2026 SyncGTM guide on branded sales collateral. Cross-functional deployment maps the asset to three personas. The champion receives the full two-page version with implementation detail. The economic buyer receives a one-paragraph executive summary with the financial metric front and center. The end-user persona receives a workflow-focused excerpt.
Practical components of a high-converting case study include:
- A headline that leads with the quantified result (for example, “40% reduction in onboarding time in 90 days”)
- A named customer with logo, industry, company size, and ACV range
- A before-and-after comparison using the same metric
- A direct quote from the economic buyer, not just the end user
- A one-sentence “why they chose us over [competitor category]” statement
A neutral benchmark from rep usage data shows case studies are used by 40–55% of reps at the evaluation stage, making them the third most-used asset type behind one-pagers and battlecards. Usage climbs when case studies are organized by ICP segment, company size, and use case rather than by content type alone.
The most common pitfall is building case studies around product features rather than customer outcomes. A secondary pitfall is using churned customers as subjects, which creates legal and credibility risk. Assign a single owner to each case study with a 90-day review cycle.
Monitor send-to-close rate for deals where the case study was shared versus baseline. Track buyer engagement rate using tools like Highspot or Showpad to measure opens, time spent, and internal forwarding behavior.
Once the business case and social proof feel solid, your champion still needs to defend you against specific competitors. Competitive battlecards equip them and your reps for that moment.
3. Competitive Battlecards: Winning the Head-to-Head Moments
Competitive battlecards are internal, rep-facing assets that enable confident competitive positioning the moment a prospect names a rival. Sellers frequently encounter a competitor in deals, yet competitive intelligence teams report that rep usage of battlecards often lags. The gap usually comes from distribution and format, not content quality.
Battlecards support the Evaluation and Proposal stages, where shortlist comparisons are active. The primary persona is the AE running the deal. Secondary personas are the SE handling technical objections and the AM managing renewal threats. Companies with regularly updated battlecards often win competitive deals at higher rates than companies with outdated or missing cards.
Practical components of an effective battlecard include:
- A one-line “why we win / why we lose” statement at the top
- Three landmine questions to plant during discovery that expose competitor weaknesses
- Objection responses written in the rep’s voice, not marketing language
- One concrete proof point, such as a named customer who switched from that competitor
- A pricing comparison anchored to TCO, not list price
Teams that refresh cards monthly often report a lift in win rate on competitive deals. The pattern is consistent across segments, even when exact percentages differ by company.
The primary pitfall is the eleven-page battlecard that fails the ten-second test. A rep must locate the right line in under ten seconds during a live call. A secondary pitfall is storing battlecards in a generic folder rather than embedding them in the CRM deal record, where they surface automatically when a competitor is tagged.
Monitor win rate on competitive deals where the battlecard was accessed versus deals where it was not. Track card freshness against a mandatory 30-day review cycle.
Once your team can defend against competitors, the next challenge is keeping complex deals on track across many stakeholders. Mutual action plans handle that coordination.
4. Mutual Action Plans: Keeping Enterprise Deals on Track
Mutual action plans (MAPs) convert vague next steps into milestone-level accountability documents co-owned by the vendor and the buying committee. They are the primary tool for preventing stage slippage in the multi-stakeholder enterprise deals described earlier, where buying groups of 5–16 people create coordination complexity across a 90–180 day cycle. MAPs reduce slippage between stages in these enterprise deals by making every milestone, owner, and deadline visible to both sides.
MAPs appear at the end of Discovery and stay active through Close. The champion is the primary persona, and the MAP gives them a structured document to share internally with procurement, legal, and the economic buyer. Secondary personas are the AE, who owns vendor-side milestones, and the procurement lead, who owns buyer-side milestones.
Practical components of an effective MAP include:
- A shared go-live date anchored to a business event such as fiscal year-end, a product launch, or a board review
- Milestone rows with named owner, due date, and status for both vendor and buyer
- A success criteria section that defines a successful implementation in the buyer’s language
- A risk log for procurement, legal, and security blockers identified early
- A weekly check-in cadence built into the document itself
Multi-threaded deals that engage at least three active stakeholders by week four close at materially higher rates than single-threaded deals, per LinkedIn’s State of Sales report. MAPs operationalize multi-threading by requiring named owners from the buyer side for each milestone.
The primary pitfall is building the MAP unilaterally and presenting it as a vendor document. A MAP that the buyer did not co-author carries little accountability. A secondary pitfall is using a static PDF. MAPs work best in a live, editable format such as a shared Google Doc or a digital sales room.
Monitor time-in-stage reduction for deals using a MAP versus baseline. Track the percentage of MAP milestones completed on schedule as a leading indicator of deal health.
As MAPs move deals toward procurement and legal review, security and compliance packs remove friction from that late stage.
5. Security and Compliance Packs: Clearing Procurement Faster
Security and compliance packs are pre-built document bundles that allow procurement and security teams to begin their review on day one of evaluation rather than waiting weeks for custom responses. Pre-completed security and legal packets can compress the Procurement and Legal stage, which Forrester identifies as the longest single phase of any enterprise deal, spanning 4–12 weeks. This asset becomes a high-leverage late-stage cycle compression tool for mid-market and enterprise deals.
Primary personas are the CISO, IT security lead, and procurement manager. The champion uses the pack to pre-empt security objections before they become blockers and to keep momentum while the MAP tracks milestones.
Practical components of a complete security and compliance pack include:
- SOC 2 Type II report with a plain-language executive summary
- Pre-filled SIG Lite and CAIQ questionnaire responses
- ISO 27001 certificate or roadmap documentation
- GDPR and CCPA data processing addendum (DPA)
- A one-page data flow diagram showing where customer data is stored and processed
Providing pre-completed security documentation allows a vendor to address procurement teams’ fixed checklist and move to the front of the queue. A vendor that arrives with answers already completed often receives faster review than vendors who respond piecemeal.
The primary pitfall is maintaining a single version of the security pack without a review cycle. Compliance certifications expire, and sharing an outdated SOC 2 report with a security-conscious enterprise buyer creates immediate credibility damage. Assign a compliance owner with a 90-day review cycle aligned to certification renewal dates.
Monitor time-in-stage reduction in the Procurement and Legal phase for deals where the pack was shared on day one versus deals where it was provided reactively.
Once security and legal teams move forward, your champion still needs to sell the deal internally. Champion kits give them a complete internal selling toolkit.
6. Champion Kits: Equipping Your Internal Advocate
Champion kits are bundled asset packages that equip the internal advocate with everything needed to build consensus, handle objections, and secure budget approval without the vendor present. Sales enablement content shortens B2B sales cycles by 40% according to Peppereffect, and champion enablement assets extend that principle to internal selling.
The kit appears at the Business Case stage and stays relevant through Negotiation. The champion persona is typically a VP or Director who can recommend but not unilaterally approve. The kit gives them language, data, and proof points to present to the economic buyer and procurement without requiring a vendor rep in the room.
Practical components of a champion kit include:
- A pre-built business case template with editable inputs and pre-populated industry benchmarks
- A one-page executive brief formatted for C-suite consumption
- An objection-handling FAQ covering the five most common internal objections: budget, timing, security, integration, and incumbent vendor
- Three ICP-matched case studies organized by the champion’s industry and company size
- A competitive positioning summary written for a non-technical audience
Buyers who receive personalized sales collateral are more likely to purchase, and the champion kit is the most personalized asset in the stack because it centers the champion’s internal audience, not the vendor’s generic ICP. Organizations that prioritize upskilling sellers on AI are 2.4x more likely to achieve strong revenue growth, per Gartner’s 2026 CSO survey, and AI-assisted personalization can further increase kit relevance.
The primary pitfall is building a champion kit that is too long for the champion to use under internal time pressure. Every component must be independently deployable. The champion should be able to share the executive brief without sharing the full kit. A secondary pitfall is building one universal kit rather than variants by vertical and deal size.
Monitor the percentage of deals in the Business Case stage where the kit was shared. Track win rate correlation for deals where the champion confirmed they used the business case template internally.
As champions share internal materials, technical stakeholders still need hands-on product experience. Interactive demo environments satisfy that need without slowing the deal.
7. Interactive Demo Environments: Scaling Technical Evaluation
Interactive demo environments are self-guided, asynchronous product walkthroughs that allow buying committee members to explore the product on their own schedule without a live sales engineer. These demos can compress the Technical Evaluation stage by removing calendar coordination friction across multi-stakeholder buying groups.
The asset supports the Technical Evaluation stage, which spans 4–8 weeks in a standard enterprise cycle. Primary personas are the technical evaluator (IT Director, Solutions Architect, or Engineering Lead) and the end-user champion. Secondary personas are procurement and the economic buyer, who use abbreviated executive-track demos to confirm fit without attending a full technical session.
Practical components of an effective interactive demo environment include:
- Persona-specific entry points such as “Start the CFO track” and “Start the IT Admin track”
- Guided tooltips that surface the three most relevant use cases for each persona
- A sandbox environment with pre-populated data that mirrors the prospect’s industry
- Engagement analytics showing which features each stakeholder explored and for how long
- A shareable link that the champion can forward internally without vendor involvement
Sales teams using digital sales rooms for collateral distribution often achieve faster deal velocity and higher prospect engagement. The interactive demo is the highest-fidelity version of this principle. It replaces a passive PDF with an active product experience that generates engagement data the AE can use to prioritize follow-up.
The primary pitfall is building a single linear demo that does not branch by persona. A technical evaluator and a CFO have incompatible information needs, so a one-size-fits-all demo serves neither. A secondary pitfall is deploying the demo too early at the Awareness stage before the prospect has enough context to evaluate what they see.
Monitor time-in-stage reduction in Technical Evaluation for deals where the interactive demo was shared. Track per-persona engagement depth, including features explored, time spent, and return visits, as a leading indicator of buying committee breadth.
Comparison Table: How the Seven Assets Work Across the Deal
| Asset | Primary Deal Stage | Rep Usage Rate | Revenue Impact Benchmark |
|---|---|---|---|
| ROI/TCO Calculator | Business Case → Procurement | 35–50% at proposal stage | Higher lead-to-demo conversion rates and shorter sales cycles |
| Quantified Case Study | Consideration → Evaluation | 40–55% at eval stage | 67% more likely to close deals when used effectively |
| Competitive Battlecard | Evaluation → Proposal | 55–70% per competitive deal | Higher win rates on competitive deals with regular updates |
| Mutual Action Plan | Discovery → Close | Varies by team; highest in enterprise motions | Reduces stage slippage in multi-stakeholder deals |
| Security & Compliance Pack | Procurement → Legal | Triggered by procurement entry | Compresses late-stage cycles |
| Champion Kit | Business Case → Negotiation | Tied to champion identification rate | Sales enablement content can shorten B2B sales cycles |
| Interactive Demo Environment | Technical Evaluation | Higher prospect engagement in digital rooms | Can compress the Technical Evaluation stage |
Frequently Asked Questions
How champion kits differ from standard sales decks
A sales deck is a vendor-facing presentation tool used by the AE to communicate value to the prospect. A champion kit is a buyer-facing enablement package designed for the internal advocate to use without the vendor present. The sales deck centers the vendor’s narrative. The champion kit centers the champion’s internal audience, including their CFO, procurement team, and peer stakeholders.
Champion kits include a business case template, an executive brief, an objection-handling FAQ, and matched case studies. A sales deck includes none of these because it assumes the vendor is in the room to answer questions. In complex B2B SaaS deals with buying groups ranging from five to 16 people, the champion kit becomes the more strategically important asset because most internal selling happens in meetings the vendor never attends.
Who owns creation and maintenance of sales collateral
Ownership should be split by function and stage. Sales enablement or product marketing owns the brief, deadline, and final approval for each asset. Frontline AEs and SEs contribute the objections, competitive intelligence, and buyer language that make assets usable. Legal and compliance own the security and compliance pack review cycle.
A single named owner per asset, not a committee, keeps collateral projects moving. Maintenance cadences differ by asset type. Battlecards require a 30-day review cycle, pricing one-pagers every 60 days, case studies and ROI calculators every 90 days, and pitch decks quarterly. Any asset not reviewed within six months should be unpublished by default to prevent reps from sharing outdated pricing or claims.
How to measure whether stage-specific collateral works
Three metrics determine effectiveness. Send-to-close rate compares win rates on deals where a specific asset was shared versus the baseline win rate for deals at the same stage. Deal velocity impact measures time-in-stage reduction when the asset is present versus absent. Buyer engagement rate tracks opens, time spent, and internal forwarding behavior using tools like Highspot or Showpad.
A fourth metric, usage rate, shows whether reps deploy the asset at all. Assets falling below 20% usage should be reworked or retired rather than archived. The most common measurement pitfall is tracking download counts or send volume without connecting asset usage to downstream win rate and cycle length data in the CRM.
How small sales teams should prioritize the seven assets
Small teams should build in order of deal-stage frequency and revenue impact. Start with the ROI/TCO calculator and two to three quantified case studies matched to your top ICP segments, because these four assets cover most deal scenarios. Add competitive battlecards for your top two or three competitors once you know which rivals appear most often.
Mutual action plans can start immediately as a process change with a shared Google Doc template at zero production cost. Security and compliance packs become critical as soon as you sell into mid-market or enterprise accounts, so build the SOC 2 summary and pre-filled SIG Lite first. Champion kits and interactive demo environments require more production investment and become highest priority once average deal size exceeds $50K ACV and cycle length exceeds 90 days.
Why sales collateral programs most often fail
The most common failure mode is a distribution problem, not a content problem. High-quality assets that live in a standalone portal or a nested Google Drive folder are functionally invisible to a rep with 90 seconds between calls. Collateral programs succeed when assets appear inside the CRM at deal-stage transitions. Teams that surface collateral inside the CRM at stage transition show two to three times higher usage than teams relying on reps to pull from a standalone portal.
Secondary failure modes include building assets for marketing review cycles rather than rep workflows, over-producing awareness-stage content while leaving decision-stage assets such as ROI calculators, security packs, and proposal templates unbuilt, and failing to retire stale assets, which causes reps to lose trust in the library entirely.
Conclusion: Choosing Where to Start and What to Build Next
Now that you have the seven core assets, the common pitfalls, and a measurement framework, the next step is prioritization. Prioritization depends on company stage and average deal size. Seed and Series A companies running SMB deals under $12K ACV should build the ROI calculator, two case studies, and one battlecard per primary competitor before investing in champion kits or interactive demos.
Series B and Series C companies running mid-market deals in the $12K–$75K ACV range should have all seven assets in production, with security and compliance packs and mutual action plans treated as non-negotiable given the procurement complexity at that deal size. Enterprise-focused teams above $75K ACV should treat the champion kit and interactive demo environment as the highest-leverage investments because most deal risk lives in the Business Case and Technical Evaluation stages, where the vendor is rarely present.
The common thread across all seven assets is specificity. As the data from multiple 2026 sources confirms, the most effective collateral is not the most polished. It is the most specific, built for one role, one stage, one objection, with one call to action. A generic PDF sent to a six-person buying committee at the wrong stage does not move deals. A champion kit that gives your internal advocate the exact language to use in a CFO meeting does.
The revenue impact of getting this right is measurable: shorter cycles, higher win rates, lower CAC, and a payback period that satisfies both the CFO and the board. Ready to identify which of these seven assets your team is missing? Map your current collateral stack with SaaS Hero and pinpoint the gaps stalling your pipeline.