




Written by: Aaron Rovner, Founder, Saas Hero | Last updated: July 26, 2026
2026 Demand-Gen Collateral: What Actually Drives Pipeline
- 2026 demand-gen performance is measured by Net New ARR, payback period, and SQL-to-Close rate, not MQL volume or downloads.
- Interactive ROI calculators and competitor comparison pages deliver the highest conversion rates because they target buyers at peak purchase intent.
- Ungated benchmark reports and case studies outperform gated assets by improving AI discoverability and organic backlink velocity.
- Clean CRM data, multi-touch attribution, and a shared SQL definition must exist before any collateral format can prove pipeline impact.
- Book a pipeline-impact audit with SaaSHero to map your collateral strategy to funnel stage, CAC, and payback targets.
Why Demand-Gen Collateral Must Prove Pipeline Impact
Ebooks that produced leads in earlier years now face higher CPLs and lower volumes as buyers shift to ungated alternatives. Only a small share of leads from gated content convert into sales opportunities. Meanwhile, 51% of B2B software buyers now begin their research in an AI chatbot rather than Google, and AI tools can only surface ungated, indexable content.
Forrester’s 2026 B2B Buying Study placed the non-buyer share of gated leads above 40%, and ungated assets often generate more organic backlinks than gated equivalents. Collateral that AI tools cannot find, share, or cite cannot generate reliable pipeline.
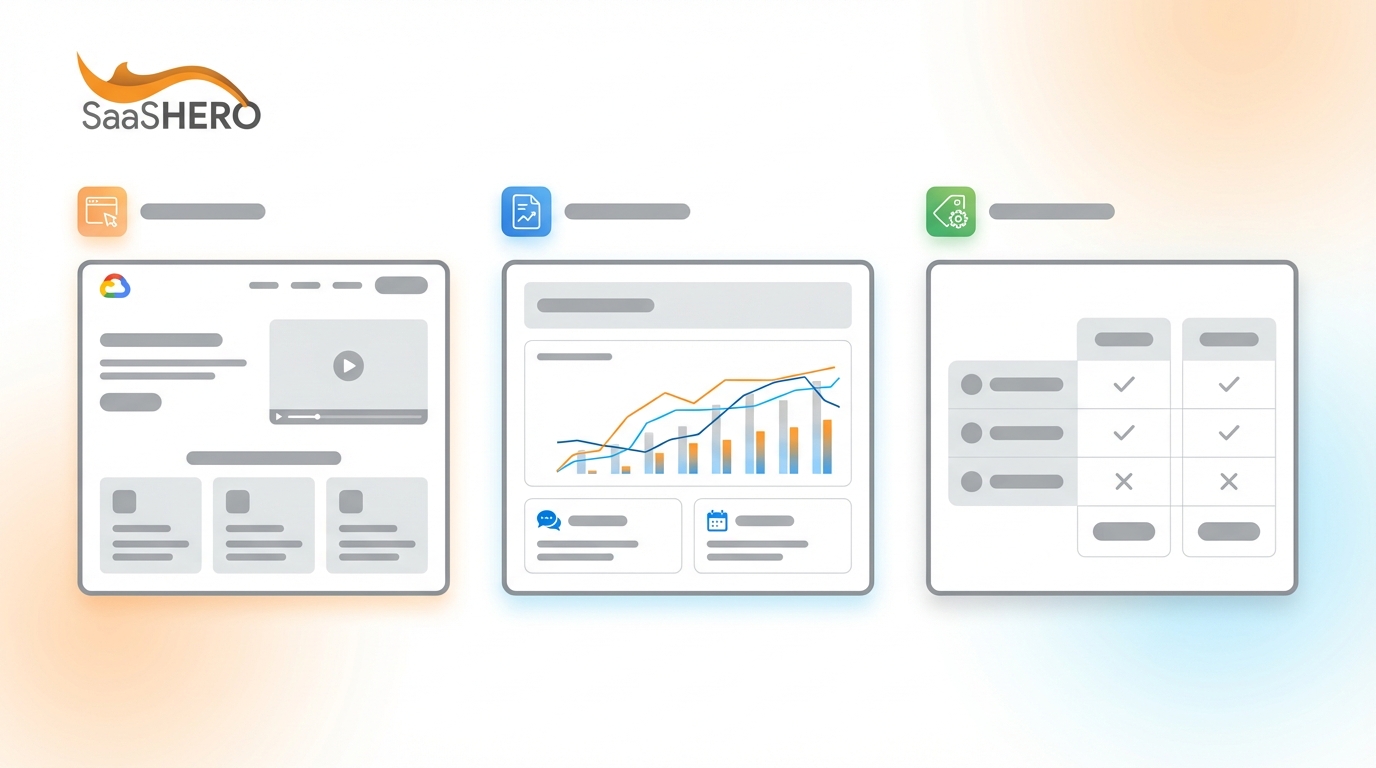
Comparison Table: 8 Collateral Formats Ranked by 2026 Performance
| Asset Type | Buyer Stage | Typical Conversion Metric | Real SaaS Example with Pipeline Impact |
|---|---|---|---|
| Interactive ROI Calculator | Evaluation → Decision | Higher landing page CVR and lead-to-demo CVR than static alternatives | Buyers who self-build a business case via a vendor calculator can be more likely to complete a purchase than those given a pre-made case study |
| Competitor Comparison Page | Evaluation → Decision | Organic CVR often 5–10% (“vs” pages), paid CVR: 7.5%+ average for competitor comparison pages | Comparison pages can produce a large share of pipeline-attributable organic revenue despite low traffic share for some B2B SaaS companies |
| Ungated Benchmark Report | Awareness → Consideration | Often generate more organic backlinks vs. gated equivalents | Comparison and buying guides can influence significant pipeline when tracked via multi-touch attribution in Salesforce |
| Quantified Case Study (ungated) | Consideration → Evaluation | Can increase likelihood to engage sales team vs. non-case-study readers | SaaSHero’s TripMaster case study documents $504,758 in Net New ARR and 650% ROI from paid search and CRO in 12 months |
| CFO Business-Case One-Pager | Decision | Targets finance and executive sponsors at justification stage, shortens multi-stakeholder approval cycles | SaaSHero’s flat-fee model enables one-pagers that show fixed TCO vs. percentage-of-spend agency alternatives, directly addressing CFO risk objections |
| Programmatic “Best Alternatives” Page | Evaluation | Strong organic CVR for programmatic comparison pages | SpotDraft achieved a 20x increase in traffic and signups through programmatic SEO and lifecycle emails |
| Webinar (on-demand, ungated replay) | Consideration | Cost per lead ~$72 vs. $800+ for trade-show leads | Recurring webinar cadence educates and qualifies simultaneously, and replay ungating extends reach without incremental cost |
| SEO Blog Post (problem-framing, ungated) | Awareness | Average SEO/organic-search conversion rates are typically 2.1–2.8% across industries | Problem-led assets can generate demo requests for B2B teams |
Interactive ROI Calculators That Turn Interest into Revenue
Interactive ROI calculators often achieve stronger landing page conversion rates than the 2.35% industry average for static pages. This performance advantage comes from higher engagement, because calculators create more time-on-page and more form completions than static case studies. Companies using revenue intelligence platforms see sales cycles shortened by 10–25% and win rates increased by 28%, and calculators support similar behavior by helping prospects build their own business case.
The core mechanism is self-qualification. When a prospect inputs team size, current costs, and manual-task hours, they reveal budget range and urgency. That data routes them into sales workflows with enough context to measure pipeline and close-rate impact downstream.
CRM tagging must capture lead source, campaign context, calculator inputs, and score at entry, or teams cannot see whether a calculator generates pipeline or only leads. SaaSHero pairs calculator traffic with negative-keyword hygiene on paid campaigns, excluding navigational queries to isolate evaluative intent. The team then applies heuristic CRO to the calculator landing page before scaling spend and uses multi-touch attribution to connect calculator engagement to improvements in marketing ROI, lead quality, sales cycle, and CAC.
Ungated Benchmark Reports That Build Authority and Demand
While calculators excel at converting high-intent prospects, benchmark reports establish authority and discoverability earlier in the buyer journey. 69% of B2B software buyers chose a different vendor than originally planned based on AI chatbot guidance, with 1 in 3 purchasing from a company they had never previously encountered. AI tools cite ungated, quotable content with specific numbers, which a well-structured benchmark report provides.
A benchmark report earns pipeline attribution through influenced-pipeline reporting. Every closed-won deal where a prospect visited the report before converting carries fractional credit. B2B SaaS teams attribute revenue to benchmark reports by tagging every visit before conversion and calculating total pipeline value of deals where that content appeared in the journey, not by counting downloads.
Effective ungated benchmark reports share three structural traits that work together as an AI-ready and sales-ready package:
- Original first-party or aggregated anonymized customer data that has no ungated equivalent
- Specific numeric findings formatted for AI citation, such as “median CAC payback for Series A SaaS is 14 months”
- A high-intent CTA embedded in the body, directing readers to a demo or pipeline-impact audit instead of a gate
Quantified Case Studies and Competitor Comparison Pages
Comparison pages and quantified case studies help buyers finalize their shortlist and move faster toward a preferred vendor. Leads sourced from comparison pages can have shorter sales cycles than leads from informational pages and higher win rates, because buyers arrive pre-qualified after reading honest comparisons. 94% of B2B buying groups rank their shortlist vendors by preference before contacting any of them, and the pre-contact favorite wins approximately 80% of the time, per 6sense’s 2025 Buyer Experience Report.

SaaSHero’s competitor-conquest landing page architecture maps directly to three psychological intent states:

- Pricing intent (“[Competitor] pricing”): a TCO comparison table that leads with fixed costs versus percentage-of-spend models
- Problem or complaint intent (“[Competitor] alternatives”): a problem-solution page citing switched customers by name
- Review or validation intent (“[Competitor] vs [Client]”): a feature matrix with G2 badges and SQL-to-Close benchmarks
Quantified case studies amplify comparison pages when placed in the same domain cluster and provide proof for each claim. This efficiency advantage, the ratio of output to traffic investment, is the core argument for prioritizing BOFU comparison content over awareness blogging.
CFO Business-Case One-Pagers and Buying Guides
Comparison pages help buyers build their shortlist, and CFO one-pagers help the preferred vendor clear the approval hurdle. Forrester reported in 2025 that 92% of buyers have a shortlist before they engage a vendor, and justification-stage materials that move a shortlisted vendor to closed-won include ROI calculators, business case templates, and reference stories targeted at finance teams and executive sponsors.
A CFO one-pager must contain:
- Total Cost of Ownership comparison, such as fixed retainer vs. percentage-of-spend agency model
- Payback period calculation using the prospect’s own CAC and gross margin inputs
- Risk-mitigation language tied to month-to-month contract flexibility
- A single quantified outcome from a comparable customer, such as ARR added, CPL reduced, or payback achieved
These elements work together to answer the CFO’s core question about predictability and control. SaaSHero’s flat-fee, month-to-month retainer structure is itself a CFO-ready proof point. When a one-pager shows that the agency fee does not increase as ad spend scales within a band, the CFO can model a fixed marketing cost line, which removes the incentive-misalignment risk that inflates CAC under percentage-of-spend models.
Key Strategic Decisions on Gating, Interactivity, and Resourcing
Original research, proprietary benchmark surveys, working tools, calculators, and webinars featuring recognized experts are the strongest candidates for gating because they offer unique value with no ungated equivalent. Blog posts, standard case studies, webinar replays, and product overviews should remain ungated in 2026 to maximize AI discoverability and organic backlink velocity.
The interactive versus static decision maps directly to funnel stage and CAC tolerance:
- Interactive assets such as ROI calculators and self-assessments justify higher production cost at Evaluation and Decision stages because they shorten sales cycles and raise win rates.
- Static assets such as blog posts and one-pagers fit Awareness and Consideration stages where volume and discoverability matter more than conversion depth.
The in-house versus agency decision hinges on payback period. SaaSHero achieved an 80-day payback period for TestGorilla, which justifies external spend when an internal hire would require 90 or more days to onboard before producing a single optimized campaign. SaaSHero’s month-to-month model removes the 12-month lock-in risk that forces companies to absorb a full year of underperformance before switching.
Maturity Model for Data Readiness and Alignment
No collateral format produces attributable pipeline without the data infrastructure to measure it. Before scaling any asset type, revenue operations leaders should self-assess against four readiness criteria:
- Lead source completeness: lead source captured on 95% or more of CRM records, because missing data makes calculator or comparison-page attribution impossible.
- Campaign association rate: at least 80% of closed-won opportunities linked to at least one campaign touchpoint.
- Multi-touch model in place: at least two attribution models, such as linear and W-shaped, used side by side before making budget decisions.
- Sales-marketing alignment on SQL definition: 65% of B2B content goes completely unused, most often due to mismatch between created assets and buyer needs at decision time, and a shared SQL definition prevents this at the handoff stage.
Teams that cannot answer “yes” to all four criteria should fix instrumentation before investing in new collateral formats. Producing comparison pages without closed-loop attribution recreates the same vanity-metric problem as the gated ebook model it replaces.
Common Pitfalls That Break Pipeline Attribution
Four execution failures consistently break the link between collateral investment and pipeline reporting:
- Last-click attribution: benchmark reports and comparison pages rarely create the first touch but often drive mid-funnel influence. In a linear attribution model applied to a five-touchpoint B2B journey producing $10,000 ARR, each touchpoint receives exactly $2,000 credit, which shows how last-click reporting zeros out mid-funnel content that actually drove the decision.
- Poor message match: sending competitor-intent traffic to a generic homepage destroys the 7.5%+ conversion rate that comparison pages achieve, so every ad group requires a dedicated landing page with matching copy.
- Incentive misalignment: agencies on percentage-of-spend models are financially rewarded for volume, not efficiency, which produces inflated MQL counts and suppresses SQL-to-Close reporting, repeating the incentive misalignment discussed earlier.
- Ungated content without high-intent CTAs: removing gates without adding demo or audit CTAs inside the asset body turns ungating into a traffic exercise instead of a pipeline exercise.
Conclusion and Next Steps for 2026 Demand Gen
The 2026 demand-gen collateral hierarchy is determined by one variable: direct, attributable contribution to Net New ARR. Interactive ROI calculators and competitor comparison pages lead the ranking because they target buyers at the moment of highest purchase intent and produce conversion rates several times higher than informational content. Ungated benchmark reports earn pipeline credit through AI discoverability and multi-touch attribution, and CFO one-pagers close the justification gap for multi-stakeholder deals.
All of these formats fail without clean CRM instrumentation, a shared SQL definition, and an agency model that reports on closed-won revenue rather than impressions. SaaSHero operates on flat-fee, month-to-month retainers because pipeline accountability requires that the agency’s incentives align with the client’s ARR outcomes, not with ad spend volume or contract length.
Frequently Asked Questions
What makes a B2B SaaS marketing collateral asset high-performing in 2026?
A high-performing collateral asset in 2026 can be directly connected to pipeline and closed-won ARR through multi-touch attribution. The asset must be discoverable through ungated or AI-indexable access, targeted at a specific buyer stage with matching intent, and tracked in a CRM with lead source, campaign context, and conversion event captured. Assets that generate form fills without CRM tagging, or that report on impressions and clicks instead of SQL volume and deal value, do not meet the 2026 standard. Interactive ROI calculators, competitor comparison pages, quantified case studies, and CFO business-case one-pagers consistently clear this bar when tied to a defined stage in the Awareness → Consideration → Evaluation → Decision funnel.
Should B2B SaaS companies gate or ungate their marketing collateral in 2026?
The decision depends on whether the asset delivers unique value that a decision-maker would pay for. Original research with proprietary benchmarks, interactive ROI calculators, and diagnostic tools with no free equivalent are appropriate to gate because they deliver immediate, measurable value that justifies the form barrier. Standard ebooks, webinar replays, product overview decks, and introductory blog posts should remain ungated in 2026. Gated versions of these assets produce bounce rates of 60–80% among senior buyers, inflate form-fill counts with bots and competitors, and remain invisible to AI chatbots that now initiate more than half of B2B software research journeys. A practical rule applies: if a competitor offers an ungated equivalent, your gated version is losing pipeline to them.
How does SaaSHero’s flat-fee model affect the quality of demand-gen collateral strategy?
Traditional agencies on percentage-of-spend billing models are financially incentivized to recommend higher ad spend regardless of efficiency, which inflates budgets and suppresses honest reporting on SQL-to-Close rate and payback period. SaaSHero’s flat monthly retainer, fixed within spend bands regardless of how much the client scales within that band, removes this conflict. When SaaSHero recommends building a competitor comparison page or an interactive ROI calculator instead of increasing ad spend, that recommendation is driven by pipeline data, not fee structure. The month-to-month contract reinforces this structure because SaaSHero must re-earn the engagement every 30 days, which creates a forcing function for performance accountability that long-term lock-in contracts remove.
How do B2B SaaS teams attribute pipeline to content assets like benchmark reports and comparison pages?
Pipeline attribution for content assets requires identity resolution, multi-touch modeling, and closed-won anchoring. Identity resolution links anonymous visits to known CRM records. Multi-touch modeling assigns fractional credit to each touchpoint in the buyer journey instead of crediting only the last click. Closed-won anchoring measures credit against ARR, not MQL volume. For benchmark reports and comparison pages, the correct metric is influenced pipeline, the total value of closed-won deals where a prospect engaged with the asset before converting. Teams should run at least two attribution models side by side, such as linear and W-shaped, before making budget decisions because different models materially change how much credit mid-funnel content receives in long B2B sales cycles. Lead source completion of 95% or more and campaign association rates of 80% or more on closed-won opportunities are the data hygiene prerequisites before any attribution model produces reliable results.
What collateral formats work best for B2B SaaS companies at different ARR stages?
At the $1M–$5M ARR stage, the highest-leverage collateral investments include three to five competitor comparison pages targeting high-intent “vs” and “alternatives” queries, one quantified case study per target vertical, and a single interactive ROI calculator on the pricing or demo page. These assets require minimal ongoing maintenance and can produce measurable pipeline within 60–90 days. At the $5M–$20M ARR stage, teams should add an ungated benchmark report to build AI discoverability and backlink authority, expand the comparison page library programmatically, and develop CFO one-pagers for multi-stakeholder deals. Above $20M ARR, the priority shifts to attribution infrastructure, ensuring that every asset in the library is tracked through multi-touch CRM reporting, and to ABM-specific collateral such as personalized business cases and account-level ROI models for named accounts in the pipeline.