




Written by: Aaron Rovner, Founder, Saas Hero | Last updated: July 19, 2026
Key Takeaways
- Connect pre-login UTM data to closed-won ARR with a five-step Mixpanel workflow that preserves identity across the full buyer journey.
- Design a governed event taxonomy with 10–25 core events, server-side tracking for P0 milestones, and consistent properties like
account_idandutm_source. - Enable Group Analytics with
company_idas the group key so analysis shifts from users to accounts that map directly to ARR. - Merge anonymous UTM profiles with authenticated users through Mixpanel ID Merge, then ingest CRM and ad spend data to calculate CAC, payback period, and channel-level ARR.
- Build revenue attribution dashboards in Mixpanel and schedule a discovery call with SaaSHero to scope a revenue-focused implementation.
Prerequisites for a Revenue-Focused Mixpanel Setup
Confirm these pieces are in place before you start implementation.
- Mixpanel plan that includes Group Analytics (Growth or Enterprise tier)
- Admin access to your CRM (HubSpot or Salesforce) with closed-won opportunity data and deal values
- Read access to Google Ads, LinkedIn Ads, and any other active ad platforms
- Engineering resources for server-side event instrumentation
- A data warehouse or ETL tool (Fivetran, Stitch, or Airbyte) for CRM and ad spend ingestion
- Stakeholder alignment between marketing, product, and revenue operations on event definitions and ownership
- Baseline understanding of UTM parameter governance and campaign naming conventions
High-Level Workflow Checklist
- Define account-level events and properties.
- Implement Group Analytics with a
company_idgroup key. - Merge pre-login UTM data with post-login identities using Mixpanel ID Merge.
- Ingest ad spend and CRM revenue data into a unified schema.
- Build revenue attribution dashboards in Mixpanel.
Step 1: Define Account-Level Events and Properties
Purpose: Create a governed event taxonomy that maps user behavior to account lifecycle milestones for Activation, Retention, and Expansion. This foundation keeps every downstream analysis stable and unambiguous.
Actions:
- Identify 10–25 core events using a Verb + Object naming convention (for example, Workspace Created, Integration Connected, Invite Sent).
- Assign one designated owner per event who approves all future changes.
- Classify each event by priority: P0 (activation-critical), P1 (feature adoption), P2 (secondary features).
- Define 3–8 standard properties per event. Required properties across most events include
account_id,user_id,plan_tier,billing_status,role, andutm_source. - Instrument P0 and P1 events server-side to prevent ad-blocker interference on conversion-critical paths.
Event Taxonomy Table (Core Marketing-to-Revenue Events):
| Event Name | Priority | Key Properties | Lifecycle Stage |
|---|---|---|---|
| Landing Page Viewed | P0 | utm_source, utm_campaign, utm_medium, anonymous_id | Acquisition |
| Demo Requested | P0 | utm_source, utm_campaign, form_id, account_id | Acquisition |
| Signup Completed | P0 | method, referrer, plan, user_id, account_id | Acquisition |
| Workspace Created | P0 | account_id, plan_tier, company_size | Activation |
| Core Action Completed | P0 | account_id, user_id, action_type, time_to_complete | Activation |
| Invite Sent | P1 | account_id, inviter_role, invitee_count | Expansion signal |
| Subscription Started | P0 | plan_name, mrr_usd, billing_interval, account_id | Conversion |
| Closed Won | P0 | account_id, arr_value, channel_source, sales_cycle_days | Revenue |
The table above shows the minimum viable event set for revenue attribution and forms your starting point. Decision point: Teams with fewer than 15 events risk missing the activation signals that correlate with retention. A complete B2B SaaS analytics implementation typically requires 80–150 events, but a revenue-focused attribution stack can start with the P0 set above and expand over time.
Validation criteria: Every P0 event fires server-side, carries account_id, and reconciles within 2% of source-of-truth counts in your CRM or billing system within 48 hours of deployment.
Common mistake: Generating event names dynamically, such as interpolating user IDs into the event name string. Event names and property names must be fixed strings in code so the taxonomy remains queryable.
Step 2: Implement Group Analytics for Account-Level Views
Purpose: Shift analysis from individual users to accounts so funnels, activation rates, and churn signals align with ARR.
Actions:
- Enable Group Analytics in your Mixpanel project settings and set
company_idas the group key. - On user initialization, call
mixpanel.set_group('company_id', user.companyId). - Set account-level properties with
mixpanel.get_group('company_id', user.companyId).set({company_name, plan, mrr, employee_count, industry}). - Tag every P0 and P1 event with the
company_idgroup key so events roll up to the account level automatically. - Use Mixpanel’s Group Analytics to track activation progress, product adoption, and churn risk at the account level instead of averaging across individual users.
Decision point: Products that support multiple workspaces per company should use workspace_id as a secondary group key alongside company_id to keep account-level and workspace-level metrics distinct.
Validation criteria: In Mixpanel’s Insights report, switching the analysis unit from “Users” to “company_id” returns account counts that match your CRM’s active account count within 5%.
Tip: Subscription events such as Subscription Started and Plan Upgraded should include
mrr_usdandbilling_intervalas properties. This structure lets Group Analytics surface revenue-weighted account segments without a separate data join.
Step 3: Merge Pre-Login UTM Data with Post-Login Identities
Purpose: Capture the marketing source that brought a visitor to your site and attach it permanently to the account that closes, which enables accurate first-touch and multi-touch attribution.
Actions:
- On first page load, capture the anonymous ID from Mixpanel’s SDK and store all UTM parameters (
utm_source,utm_medium,utm_campaign,utm_content,utm_term) as anonymous user properties using$set_onceso the original acquisition context persists. - Store GCLID and FBCLID values in the same anonymous profile and pass them to your CRM through hidden form fields.
- After signup or login, call
mixpanel.identify(userId)to trigger Mixpanel’s ID Merge, which stitches the anonymous event history to the authenticated user profile. Mixpanel automatically stitches pre-authentication events to post-authentication behavior by maintaining events and user attributes in separate tables. - After workspace creation, associate the authenticated user with their
company_idgroup to complete the identity chain: Anonymous ID → User ID → Account ID. - Use
$set_oncefor all acquisition properties so a returning user’s original UTM source never gets overwritten by a later visit. As noted earlier, this operator preserves the first-write value across the user’s lifetime.
Decision point: Ad blockers affect an estimated 25–40% of client-side traffic, so the Landing Page Viewed and Demo Requested events should fire server-side or through a proxy. This approach keeps UTM capture reliable before the identify call.
Validation criteria: Run a Mixpanel Funnel from Landing Page Viewed (anonymous) through Subscription Started (authenticated). The funnel should show a continuous user journey without a gap at the signup step, which confirms that ID Merge works correctly.
Troubleshooting: If pre-login events do not appear in post-login user profiles, verify that
mixpanel.identify()runs immediately after authentication, not after a page redirect, and that the same Mixpanel project token is used across all subdomains.
Teams that want help implementing this attribution stack can book a discovery call with SaaSHero to scope a revenue-focused Mixpanel rollout.
Step 4: Ingest Ad Spend and CRM Revenue Data
Purpose: Bring ad spend and closed-won revenue into the same layer as Mixpanel behavioral data so you can calculate CAC, payback period, and channel-level ARR without spreadsheets.
Actions:
- Connect your CRM to a data warehouse using Fivetran, Stitch, or Airbyte to replicate contacts, companies, opportunities, deal stages, and closed-won revenue automatically.
- Replicate ad spend, impressions, and click data from Google Ads, LinkedIn Ads, and Meta into the same warehouse, normalized to a unified schema:
date,platform,campaign_name,campaign_id,clicks,impressions,spend. - Join ad platform data with CRM records using GCLID and FBCLID as primary keys so closed-won revenue ties back to specific ad clicks. Reliable match rates depend on clean data preparation for most B2B teams.
- Standardize CRM lead source fields and add custom fields for UTM parameters to ensure consistent join keys across platforms. This standardization creates the clean
account_idand UTM values needed for the next step. - Once your join keys are consistent, push the joined dataset into Mixpanel via the Ingestion API as a
Closed Wonevent carryingarr_value,channel_source,campaign_id,sales_cycle_days, andaccount_id. - Implement Google Enhanced Conversions and Meta CAPI to send CRM events directly from the server to ad platforms, bypassing browser limitations from ad blockers and iOS privacy changes. This server-side setup also supports Mixpanel as your independent source of truth.
Decision point: B2B companies often require 30-, 60-, or 90-day attribution windows when joining ad clicks to closed-won CRM deals because sales cycles run longer. Set your window based on your median sales cycle length, not a platform default.
Validation criteria: Total closed-won ARR in Mixpanel reconciles within 3% of CRM-reported closed-won ARR for the same period. Channel-level spend totals match ad platform exports within 1%.
Common mistake: 76% of organizations say less than half of their CRM data is accurate and complete, which limits attribution accuracy. Before ingestion, audit CRM records for missing UTM fields, blank lead source values, and duplicate company records that would cause
account_idmismatches.
Step 5: Build Revenue Attribution Dashboards in Mixpanel
Purpose: Give revenue leaders a single Mixpanel dashboard with CAC, payback period, and channel-level ARR so they can reallocate budget without exporting data.
Actions:
- Use Mixpanel’s dedicated B2B SaaS revenue analytics templates as a starting point, then customize with your CRM and ad spend data.
- Build a Funnel report from Landing Page Viewed → Demo Requested → Signup Completed → Subscription Started → Closed Won, segmented by
utm_sourceto show channel-level conversion rates at each stage. - Create an Insights report that calculates channel-level CAC:
Total Ad Spend (by utm_source) / Count of Closed Won Accounts (by utm_source)for a rolling 90-day window. - Add a payback period metric:
CAC / (Average MRR per Account × Gross Margin %), surfaced as a number card per channel. - Build a channel-level ARR bar chart using the
arr_valueproperty on the Closed Won event, segmented bychannel_source. - Apply Mixpanel’s attribution models: First Touch, Last Touch, Linear, U-shaped, or Time-decay to the same funnel and compare outputs. For B2B SaaS with cycles longer than 30 days, linear or time-decay models usually surface more accurate channel contribution than last-click.
- Restrict dashboard access by team using Mixpanel Data Views so revenue figures stay visible only to authorized stakeholders.
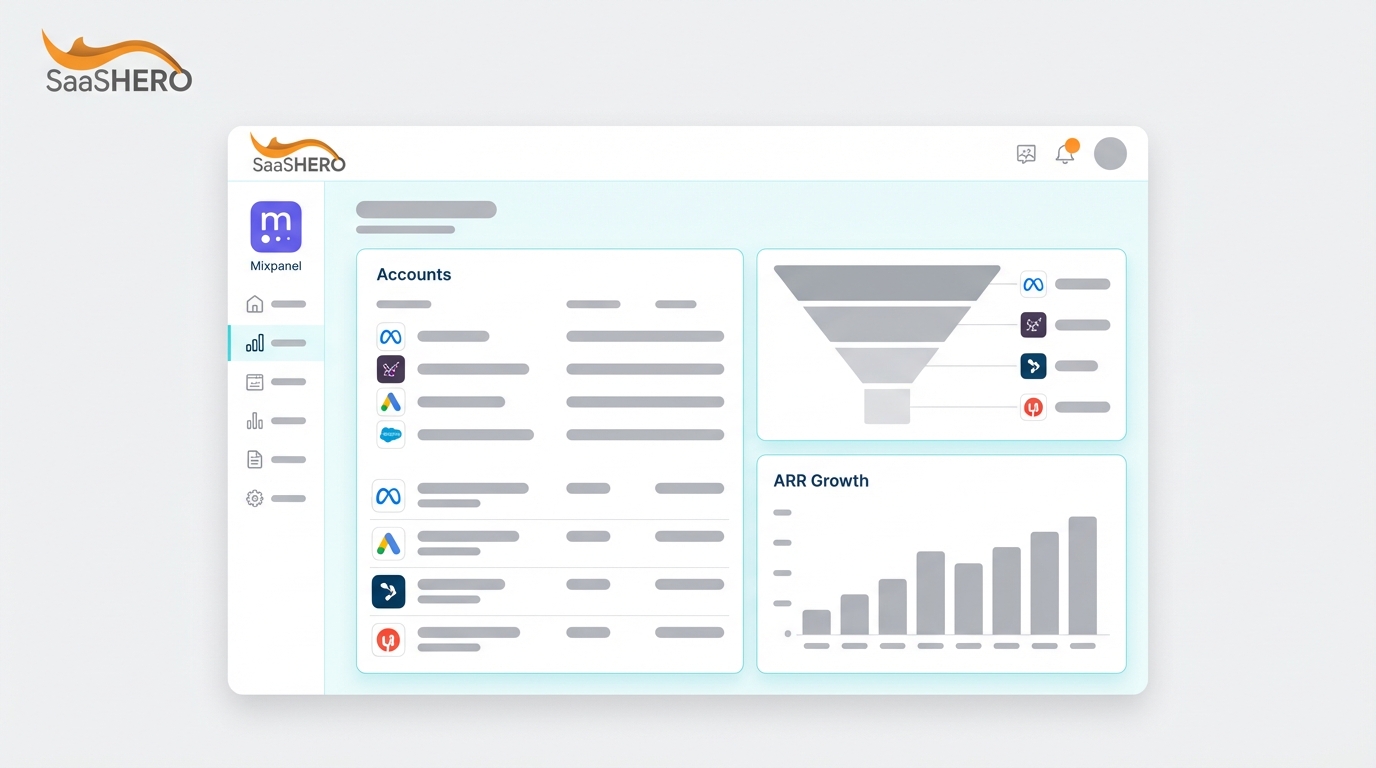
Dashboard mockup: How the key panels work together
Combine these panels in a single dashboard so leaders can move from spend to revenue in one view.
- Channel CAC (90-day rolling): Bar chart with one bar per
utm_source, Y-axis equals CAC in USD. - Payback Period by Channel: Number cards per channel, value in days.
- Channel-Level ARR Contribution: Stacked bar chart segmented by
utm_sourceand quarter. - Full-Funnel Conversion by Channel: Funnel visualization from Landing Page Viewed to Closed Won.
- Account Activation Rate by Acquisition Source: Group Analytics table with rows as
utm_sourceand columns as percent of accounts reaching Core Action Completed within 7 days.
Validation criteria: CAC figures in Mixpanel match manual calculations from the data warehouse within 5%. The payback period for your highest-spend channel is visible and actionable within one business day of a campaign change.
Teams that reach this milestone and want help interpreting the data for budget decisions can book a discovery call with SaaSHero, which has helped B2B SaaS companies reach an 80-day CAC payback period.
Measurement and Validation of Your Attribution Stack
Measure implementation success against three primary metrics.
- CAC by channel: Teams using joined CRM and ad data can lower CAC by 30% or more by identifying and improving underperforming spend.
- Payback period: Series A B2B SaaS benchmarks target CAC payback of 10–12 months; Series B targets 14–18 months and Series C+ targets 18–24 months.
- Channel-level ARR: Channel-level conversion varies far more than stage-level conversion in B2B SaaS, so blended averages become unreliable without channel segmentation.
Common issues and remediation:
- Attribution gaps in long sales cycles: Sales cycles in B2B SaaS have lengthened 22% since 2022, with a median of 84 days. Extend attribution windows to at least 90 days and use a time-decay model so early-funnel channels receive appropriate credit, building on the window choice described in Step 4.
- Inflated touchpoint counts: A fragmentation index above 1.5, calculated as COUNT(DISTINCT utm_campaign) / COUNT(DISTINCT campaign_id), means the same campaign appears under multiple UTM names. This pattern inflates multi-touch attribution counts. Enforce UTM governance with underscore delimiters and lowercase
utm_sourcevalues. - Platform over-reporting: Ad platform conversions often overcount due to overlapping attribution windows and self-reporting bias. Use Mixpanel’s independent attribution layer, powered by the server-side and warehouse joins from Step 4, as your source of truth instead of platform dashboards.
Advanced Variations for Mature Teams
Multi-channel execution: Up to 60% of marketing spend is misallocated under last-touch attribution in B2B environments. Teams running three or more channels simultaneously should implement a three-layer attribution stack: multi-touch attribution in Mixpanel for digital channel optimization, marketing mix modeling for strategic budget allocation, and incrementality testing for causal validation.
Experimentation integration: Connect Mixpanel to your A/B testing tool by passing experiment variant IDs as event properties on Landing Page Viewed and Demo Requested events. This setup enables funnel analysis segmented by variant so you can measure conversion lift at the ARR level rather than the click level.
Governance for larger teams: Teams with inconsistent UTM and campaign naming spend 40–60% of analyst time on manual data cleanup. Establish a governed campaign taxonomy, such as paidsocial_newbiz_abm1_us_productA_2026q2_pipeline_video30s_enterprise, and enforce it through a pre-launch checklist that blocks campaign activation without compliant UTM strings. This governance also reduces the need to expand beyond the 80–150 event range mentioned earlier.
Implementation Checklist Recap and Next Actions
- Define 10–25 core events with Verb + Object naming, server-side instrumentation for P0 events, and one owner per event.
- Configure Group Analytics with
company_idas the group key and set account-level properties includingmrr,plan, andindustry. - Implement ID Merge by capturing UTM parameters with
$set_onceon anonymous load, callingidentify()at login, and associating users withcompany_idafter workspace creation. - Ingest CRM closed-won data and ad spend into a data warehouse, join on GCLID and UTM keys, and push a
Closed Wonevent to Mixpanel witharr_valueandchannel_source. - Build Mixpanel dashboards showing CAC, payback period, and channel-level ARR using a time-decay or linear attribution model.
By team maturity:
- Early-stage (pre-Series A): Start with P0 events only, a single attribution model (linear), and a 90-day attribution window. Focus on ID Merge correctness before expanding dashboards.
- Growth-stage (Series A–B): Add Group Analytics, CRM ingestion, and a channel-level ARR dashboard. Introduce U-shaped or W-shaped attribution to credit awareness channels.
- Scale-stage (Series B+): Layer in marketing mix modeling, incrementality testing, and governed campaign taxonomy enforcement across all channels and regions.
SaaSHero implements and improves this entire stack for B2B SaaS teams. Book a discovery call to review gaps in your current attribution setup and explore what a revenue-focused Mixpanel implementation would look like for your team.
Frequently Asked Questions
How long does it take to implement this Mixpanel attribution stack end to end?
A focused implementation covering event taxonomy design, Group Analytics configuration, ID Merge, and a basic revenue dashboard typically takes four to eight weeks for a team with dedicated engineering support. The taxonomy design phase, which includes mapping events, defining properties, and writing tracking contracts, usually takes 12 to 17 hours before any code is written. Post-implementation QA, including verification that events fire correctly, properties are captured, and counts reconcile with CRM data, requires another four to six hours. CRM and ad spend ingestion through a data warehouse adds one to two weeks depending on CRM complexity and data quality. Teams with incomplete CRM data or inconsistent UTM naming should budget extra time for data cleanup before the first attribution report becomes reliable.
What roles need to be involved in this implementation?
A successful implementation requires four roles working in coordination. A growth marketer or marketing operations lead owns the event taxonomy, UTM governance, and dashboard requirements. A product engineer or data engineer instruments server-side events, configures the Mixpanel SDK, and builds the data warehouse pipelines for CRM and ad spend ingestion. A revenue operations or CRM administrator ensures that lead source fields, GCLID custom fields, and closed-won opportunity data stay clean and consistently formatted in HubSpot or Salesforce. A data analyst or BI lead validates reconciliation between Mixpanel, the data warehouse, and CRM source-of-truth figures. At smaller companies, one or two people may cover multiple roles, but the responsibilities remain the same regardless of headcount.
Can a small team with limited engineering resources implement this?
A small team can implement this stack with careful scoping. Small teams should start with the P0 event set only, which includes Landing Page Viewed, Demo Requested, Signup Completed, Subscription Started, and Closed Won, and then defer P1 and P2 events until the core attribution chain is validated. Mixpanel’s JavaScript SDK handles client-side anonymous tracking and ID Merge with minimal engineering effort, while the server-side requirement applies specifically to conversion-critical events where ad-blocker interference would distort attribution. For CRM ingestion, native Mixpanel integrations with HubSpot reduce the need for a full data warehouse setup in early stages. The main constraint for small teams is UTM governance because inconsistent campaign naming quickly degrades attribution data and forces manual cleanup that consumes limited analyst time.
What are the biggest risks of getting this implementation wrong?
The three highest-impact failure modes are identity fragmentation, UTM inconsistency, and CRM data incompleteness. Identity fragmentation occurs when the identify() call fires after a page redirect instead of immediately at login, which breaks the anonymous-to-authenticated stitching that ID Merge requires. The symptom is a funnel gap at the signup step where pre-login events do not appear in post-login profiles. UTM inconsistency, such as using “LinkedIn” in one campaign and “linkedin” in another, causes the same channel to appear as two separate sources in attribution reports, splitting credit and understating channel performance. CRM data incompleteness, including missing lead source fields or blank UTM custom fields on closed-won opportunities, reduces the match rate between ad clicks and revenue records below the 70% threshold needed for reliable CAC calculations. All three risks are preventable through governance that includes a written tracking plan, a pre-launch UTM checklist, and a CRM audit before ingestion begins.
How long before this implementation produces actionable attribution data?
The first actionable signal, channel-level conversion rates from Landing Page Viewed to Demo Requested, appears within days of deploying P0 events. Full-funnel attribution that connects ad spend to closed-won ARR requires data accumulation equal to at least one median sales cycle, which for most B2B SaaS teams means 60 to 90 days of clean data collection before CAC and payback period figures become statistically meaningful. Teams with sales cycles longer than 90 days should use leading indicators, such as account activation rate by acquisition source and pipeline value by channel, as proxies for revenue attribution during the accumulation period. Attribution model comparisons, including first-touch versus time-decay versus linear, require at least 30 to 50 closed-won accounts per channel to produce stable credit distributions; below that threshold, model outputs remain directional rather than definitive.