




Written by: Aaron Rovner, Founder, Saas Hero | Last updated: September 1, 2026
Key Takeaways
- Heuristic analysis evaluates pricing page design, layout, and psychology to uncover friction points that suppress conversion and increase customer acquisition cost.
- Hybrid and usage-based pricing models now dominate B2B SaaS, which raises cognitive load for buyers and makes clear value metric communication essential.
- Top-quartile pricing pages convert at 12.8% versus the 6.9% median. Three to four structural changes usually close much of that gap.
- Seven proven heuristics – value metric clarity, tier hierarchy, trust signals, risk reversal, anchoring, self-serve vs custom split, and visual hierarchy – drive measurable conversion lifts.
Ready to turn these insights into pipeline growth? Schedule a free pricing page audit with SaaSHero to diagnose and fix the structural issues on your pricing page.
Why Pricing Page Optimization Is Strategically Critical in 2026
The pricing page is typically the second or third most visited page on any B2B SaaS website, yet it receives a fraction of the optimization attention directed at homepages or product pages. For a VP of Marketing carrying a pipeline number, that asymmetry represents the highest-leverage conversion opportunity in the funnel.
The current market context makes heuristic analysis of pricing models for B2B SaaS websites more urgent than ever. Kyle Poyar’s 2026 State of B2B Monetization survey of 230 companies found that hybrid pricing is now the dominant model at 37% adoption, up from 25% a year earlier. At the same time, usage-based pricing grew from 27% to 34% of SaaS companies between 2023 and 2025. As pricing structures grow more complex, the cognitive burden on the buyer increases, and an unoptimized page absorbs that burden as lost conversion.
The gap between median and top-quartile performance is structural rather than a traffic problem. According to Benchmarketing’s 2026 asset benchmarks, the median pricing page conversion rate is 6.9% and the top-quartile rate is 12.8%. Three to four structural changes typically close that gap without changing the underlying price. If you want to identify which changes apply to your page, a structured audit is the first step.
Ready to close that gap on your own pricing page? Talk to our growth team at SaaSHero to see how an outsourced inbound growth team diagnoses and fixes the structural issues suppressing your conversion.
Core B2B SaaS Pricing Models and Their Page Impact
Four primary models dominate the B2B SaaS landscape. Each carries distinct conversion implications for the pricing page.
| Model | Example | Pros | Cons |
|---|---|---|---|
| Per-User (Seat-Based) | Slack | Predictable revenue, scales with team size | When a single AI agent can do the work of 10 to 50 human users, per-seat pricing collapses and creates a commercial absurdity |
| Usage-Based (Consumption) | Stripe | Aligns cost with value delivered, captures expansion revenue | Revenue volatility, requires transparent metering to maintain buyer trust |
| Hybrid (Base + Usage) | HubSpot | Hybrid models posted a 21% median growth rate, ahead of pure subscription (19%) and pure usage-based (18%) | Complex billing, requires clear page communication to avoid confusion |
| Flat-Rate | Basecamp | Maximum simplicity, eliminates decision paralysis at the tier level | Flat-fee pricing fell from 18% to 14% of SaaS companies between 2023 and 2025, indicating declining market fit |
IDC projects that 70% of vendors will move away from pure per-seat pricing by 2028 because the unit economics do not survive AI-native workflows. For pricing page design, this shift means value metric clarity, which explains precisely what the buyer pays for, is now the most consequential element on the page. That clarity is one of several heuristics that shape how buyers process a pricing page.
Key Heuristics for Pricing Page Evaluation
Heuristics are decision shortcuts that shape how buyers process a pricing page. The following seven have the strongest empirical support for B2B SaaS conversion. For a deeper look at the tools used to surface these patterns, see SaaSHero’s guide to heuristic analysis software for SaaS marketing.
- Value Metric Clarity. The page must explain what the buyer pays for in plain language, such as per user, per API call, or per contact. Stripe’s transparent per-transaction pricing (2.9% + 30¢) is the benchmark. The failure mode is “Contact us for custom pricing” with no starting point.
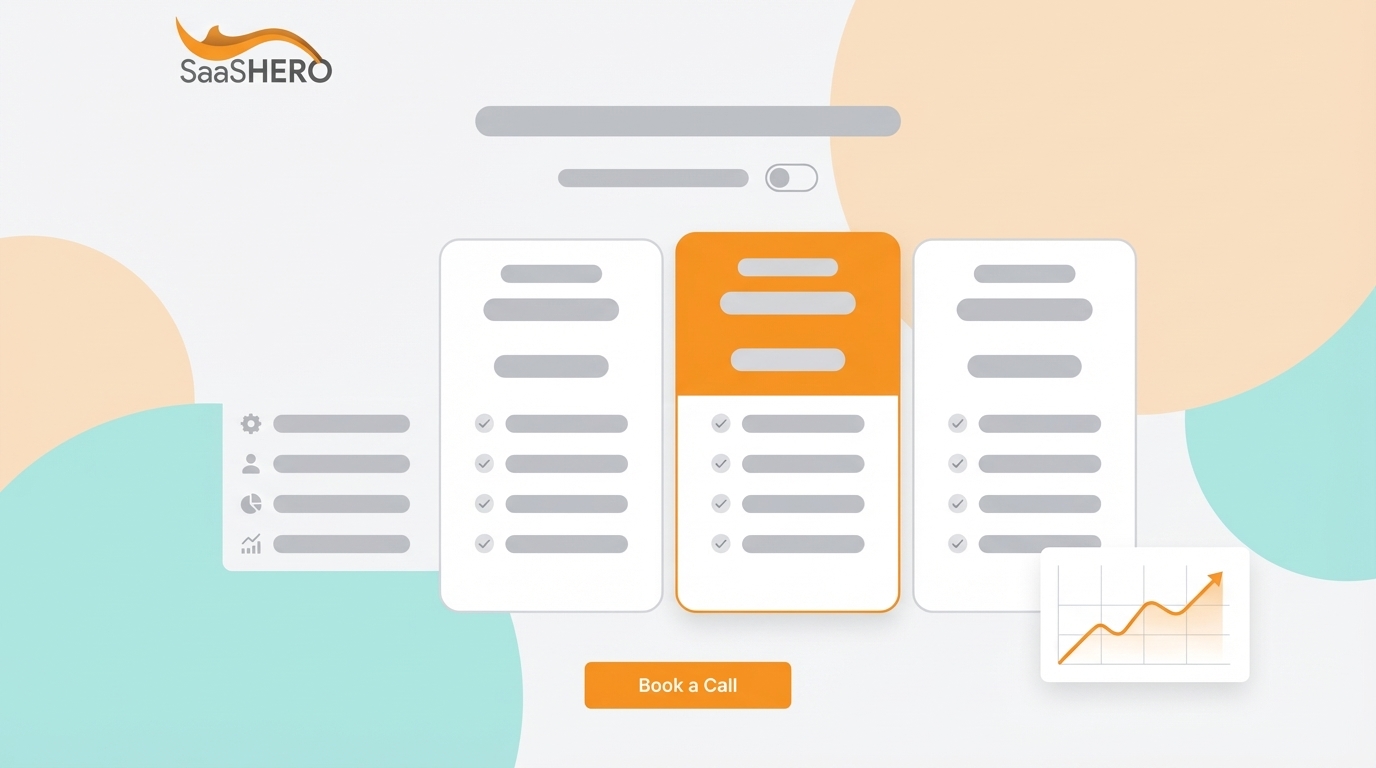
- Frictionless Tier Hierarchy. Three-tier pricing structures convert 14% better than four or more tiers, based on an analysis of 200 B2B SaaS pricing pages. Four or more tiers trigger the paradox of choice.
- Trust Signals. Testimonials, security badges, and money-back guarantees placed near the decision point reduce perceived risk. Adding “No credit card required” (along with other risk-reduction elements) near CTAs can lift conversions, with a documented 7% increase in sign-ups in a Conversion Rate Experts A/B test on Mobbin’s sign-up page.
- Risk Reversal. Free trials, no-credit-card options, and cancel-anytime language lower the cost of being wrong. Time-limited free trials (opt-in, no credit card) convert at a median rate of about 18.2%, while free-forever (freemium) tiers convert at a median rate of roughly 2–5%.
- Anchoring. Marking a tier as “Most Popular” can increase selection of that tier by roughly 25–40% in some CRO studies, though the specific figures of a 17% conversion increase and a 42% decision time reduction are not supported by the evidence. The 42% figure in the research refers to the reduction in add-to-cart advantage when the badge is removed, not decision time. Placing the highest tier first anchors the price range so the middle tier reads as reasonable.
- Self-Serve vs. Custom Split. Hiding pricing behind “Contact Sales” for products under $25K ACV can significantly reduce demo conversion. Buyers at that ACV have often already decided they do not want a sales conversation.
- Visual Hierarchy. According to Unbounce’s analysis of 18,639 landing pages, single-CTA pages convert at 13.5%, while pages with three or more CTAs convert at 10.5%. This is why each tier should have exactly one CTA, matched to the buying motion.
Step-by-Step Heuristic Audit Checklist
Apply this 15-point checklist to your pricing page today. For a methodology on estimating the cost of running this audit, see SaaSHero’s heuristic analysis cost comparison for SaaS UX audits.
- Is the value metric prominently displayed and defined in plain language, rather than buried in a tooltip?
- Are tiers ordered logically from lowest to highest price, with the recommended tier visually emphasized?
- Is there exactly one clear CTA per tier, matched to the buying motion (trial vs. demo)?
- Are trust signals such as testimonials, security badges, and guarantee language visible near the pricing table, rather than only at the bottom of the page?
- Does one tier carry a “Most Popular” or “Recommended” badge to reduce decision paralysis?
- Does the page load in under three seconds and render correctly on mobile? 58% of SaaS pricing page traffic in 2026 is mobile, yet most pages are still designed for a 1440px monitor.
- Is the pricing page linked from the main navigation so high-intent visitors can reach it without friction?
- Are usage limits such as seats, API calls, storage, and history stated explicitly rather than hidden behind “unlimited” language?
- Is there a clear path to contact sales for custom pricing, separate from the self-serve tiers?
- Does the page include social proof such as customer logos or testimonials placed adjacent to the recommended tier’s CTA rather than in a generic section far from the decision point?
- Is the highest-priced tier displayed first to anchor the price range and make the middle tier feel accessible?
- Is there a free trial or demo option with the commitment level stated explicitly (no credit card, 14 days, and similar details)?
- Are tier names descriptive and buyer-oriented, such as “For growing teams” rather than “Pro,” so visitors can self-select without reading every feature row?
- Is the page free of internal jargon that a non-technical economic buyer would not immediately understand?
- Is there a clear next step after selecting a tier, including an FAQ that addresses the top objections such as cancellation, usage limits, refunds, and plan changes?
Real-World Pricing Page Examples That Apply the Heuristics
These three pricing pages show how the heuristics play out in practice. Slack highlights tier hierarchy and framing, HubSpot shows risk reversal for large price steps, and Stripe demonstrates value metric clarity.
Slack. Slack’s four-tier per-seat page (Free, Pro, Business+, Enterprise Grid) demonstrates several heuristics well. Annual pricing is framed as “2 months free” rather than “20% off,” a framing that improves conversions by 16%. The “pay per active user” language removes the objection about paying for inactive accounts. Weaknesses appear in pricing psychology. A 2026 analysis scored Slack 5/10 for pricing psychology, citing the absence of charm pricing and omission of a “Most Popular” label. Slack’s Pro-to-Business+ price jump of 118% (from $7.25 to $15 per user per month) is steep, yet it is justified by the inclusion of advanced AI features and premium Salesforce integrations in the Business+ plan.
HubSpot. HubSpot’s hybrid model organizes pricing by hub with a bundling discount. HubSpot’s Marketing Hub Professional-to-Enterprise price jump from $890/month to $3,600/month (annual billing) is addressed in a dedicated “Professional vs Enterprise” comparison section. This layout applies the risk-reversal heuristic for large price steps. HubSpot’s free tools tier is presented as a standalone section separate from paid tiers, which avoids cheapening the paid plans while still attracting freemium users. The main weakness is complexity, which can overwhelm buyers evaluating multiple hubs simultaneously, and onboarding fees are not always surfaced clearly.
Stripe. Stripe’s usage-based page leads with a single transparent number (2.9% + 30¢ per transaction) and positions custom pricing below for high-volume accounts. Stripe builds trust through transparency rather than testimonials or social proof, and the value metric is so clear that the page requires no anchoring or tier hierarchy to convert. This approach works because the value metric maps directly to cost-to-serve and to customer value, which makes it the clearest application of heuristic one in the market.
Common Pricing Page Mistakes and How to Fix Them
Here are seven common mistakes and how to fix them.
- Hiding pricing behind “Contact Us.” Fix: Show starting prices for any product under $50K ACV. Reserve full gating for enterprise tiers where deal terms genuinely vary. A large majority of B2B buyers want to see pricing before talking to sales.
- Vague value metrics. Fix: Define what counts as usage in plain language on the page itself, rather than in a tooltip or only in the FAQ. A founder burned by a surprise bill will not sign up without understanding the edges.
- Too many tiers. Fix: Consolidate to three tiers and remove plans that account for fewer than 5% of conversions. Moving from four to five pricing tiers reduces paid conversion by a median of 4.6% (6.8% at the 75th percentile), according to ProfitWell’s 2023–2024 pricing-page A/B aggregates, consistent with the paradox of choice.
- Missing trust signals. Fix: Add role-specific testimonials adjacent to the plan they are most likely to convert. Generic logo bars tend to underperform role-specific testimonials placed near the recommended tier.
- No testing cadence. Fix: Run 2–4 tests per month for self-serve products, sequencing them by impact: tier structure first, CTA copy second, social proof third. This prioritization ensures you address the highest-leverage changes before lower-impact tweaks.
- Ignoring mobile. Fix: Stack tiers vertically and use sticky CTAs. As mentioned in the checklist, mobile traffic dominates, and horizontal comparison tables break on small screens.
- Feature dumping. Fix: Highlight 6–9 key differentiators in the visible comparison. Listing 41 or more features drops conversion rates from 18.2% to 3.4%. Move the full comparison table below the fold.
How to Test and Iterate Your Pricing Page
Once you have fixed the structural mistakes above, the next step is to test and iterate. Pricing page optimization is a sequenced practice rather than a one-time redesign. According to Pepper Effect’s 2026 B2B CRO playbook, disciplined CRO programmes typically deliver a 25–50% revenue-per-visitor lift in 12–18 months, while PageDuel reports a 40–60% aggregate conversion improvement over 6 months from consistent pricing page testing.
CXL recommends a minimum of 250–400 conversions per variation (not visitors) before declaring statistical significance. Run tests sequentially with a seven-day pause between experiments to prevent interaction effects. Prioritize by structural impact: number of tiers, annual versus monthly default toggle, and recommended tier position come before CTA copy, which comes before social proof placement. For the traffic volumes most B2B SaaS pricing pages generate, tools like VWO and Unbounce support this kind of A/B testing.
Headline copy changes also carry outsized impact. The headline is the single highest-leverage element on the page. If it could appear on a competitor’s pricing page unchanged, it is not doing its job.
FAQ
What is a value metric on a SaaS pricing page?
A value metric is the unit that determines what a customer pays, such as seats, API calls, contacts, monthly tracked users, or transactions. It must reflect what customers say they bought the product for rather than what is easiest to meter internally. When the value metric is misaligned with perceived value, the pricing page presents a feature list rather than a value statement, and buyers cannot self-select into the right tier. The clearest value metrics, such as Stripe’s per-transaction rate or Mailchimp’s contact count, require no explanation because they map directly to the outcome the buyer is purchasing.
How many pricing tiers should a B2B SaaS pricing page have?
Three is the optimal number for most B2B SaaS products. Three tiers enable anchoring, where the highest tier makes the middle feel reasonable, and decoy positioning, where a tier priced close to a higher tier with fewer features makes the higher tier look like exceptional value. This structure also supports self-selection without decision paralysis. As noted earlier, adding a fifth tier typically reduces paid conversion by a median of 4.6%. Two tiers remove the anchoring effect and push buyers toward the cheaper option by default. The exception is a product with a genuinely distinct enterprise motion, where a fourth “Contact Sales” tier can be added without appearing as a full pricing column.
Should a B2B SaaS company offer a free trial?
For most B2B SaaS products where value is experienced within the first session or week, a free trial makes sense. Time-limited free trials (opt-in, no credit card) convert at a median rate of about 18.2%, while free-forever (freemium) tiers convert at a median rate of roughly 2–5%. According to ChartMogul’s SaaS Conversion Report, a “GOOD” conversion rate for no-credit-card free trials is 8–12%, while a “GOOD” conversion rate for card-required trials is 25–35%, with the card requirement filtering for higher-intent buyers (though it also reduces signup volume). The pricing page should state the trial terms explicitly, including duration, what is included, and what happens at the end, because ambiguity at this point is a primary reason buyers abandon without converting.
How do I choose between per-user and usage-based pricing for my B2B SaaS product?
The decision turns on what your customers say they bought the product for. If value scales with the number of people using the product and AI agents or automation do not reduce the seats needed, per-seat pricing is defensible. If AI or automation means a single agent can do the work of multiple licensed users, per-seat pricing creates a commercial misalignment. The more efficient your product becomes, the less revenue it generates. Usage-based pricing aligns cost with value delivered and captures expansion revenue naturally, but requires transparent metering and real-time usage visibility to maintain buyer trust. Hybrid pricing, which combines a base subscription with a usage overlay, delivers the highest median growth rate at 21% and is now the dominant structure among companies above $20M ARR.
What is the decoy effect and how does it apply to SaaS pricing pages?
The decoy effect occurs when a third option, priced close to a higher tier but with meaningfully fewer features, makes the higher tier appear to be exceptional value by comparison. On a SaaS pricing page, a decoy tier is typically positioned at 70–85% of the premium tier’s price while delivering only 40–60% of its value. The result is that buyers who were considering the middle tier are drawn toward the premium tier because the incremental cost feels small relative to the incremental value. The decoy effect works best when the feature gap between the decoy and the target tier is concrete and immediately visible in the comparison table. Specific usage limits or named capabilities produce a stronger anchoring effect than abstract feature names.
Apply the Framework, Then Partner for Execution
As noted earlier, the gap between median and top-quartile pricing page conversion is structural rather than a traffic problem. Three to four structural changes, such as tier consolidation, value metric clarity, trust signal placement, and anchoring, typically close much of that gap without touching the underlying price.
Apply the 15-point checklist above to your own pricing page today. Score each item, identify the three lowest-scoring elements, and sequence your first tests by structural impact. The framework is designed to be actionable within 24 hours.
For teams that need the strategy executed rather than only diagnosed, SaaSHero owns the entire inbound acquisition engine: paid media, creative, landing pages, attribution, and the pricing page optimization that sits at the center of it. One team, one accountability line, optimized against CRM revenue rather than form-fill counts. Get a conversion diagnosis and see how an outsourced inbound growth team can own the strategy and execution end to end, so you stop managing the agency and start seeing the pipeline number move.