




Written by: Aaron Rovner, Founder, Saas Hero | Last updated: July 21, 2026
Key Takeaways for 2026 B2B SaaS Pricing
- Pricing and GTM misalignment suppress ACV, increase discounting, and damage unit economics in most Series A–C B2B SaaS companies.
- Clear ACV bands tied to the right GTM motion (PLG, hybrid, or SLG) and value-based metrics create a scalable pricing architecture.
- Three-tier structures with 50–100% price gaps, a “Most Popular” middle tier, and gated enterprise features usually outperform single-tier or many-tier models.
- Structural expansion packaging using usage limits, in-app prompts, and modular add-ons can drive 30–50% of new ARR without sales-heavy upsells.
- Teams that want a guided review of pricing-GTM alignment can book a discovery call with SaaSHero for a structured audit of tiers and NRR trajectory.
Step 1: Match Target ACV Bands to GTM Motion
Annual Contract Value (ACV) alignment means you select a GTM motion, pricing model, and success metrics that match your ICP’s revenue band. The motion must fit the economics of acquiring and retaining customers at that ACV, not a founder preference or a competitor pattern.
H1 2026 GTM benchmarks from KeyBanc and Sapphire and GTM motion selection criteria support the following alignment table.
| ACV Band | Recommended GTM | Pricing Model | Example Metrics |
|---|---|---|---|
| Under $10K | Product-Led Growth (PLG) | Freemium or free trial with usage-based upgrade | Activation rate >60%; free-to-paid conversion 2–5%; CAC payback <12 months |
| $10K–$50K | Hybrid (PLG + sales-assist) | Tiered flat-rate with usage overages | Win rate 18–25%; NRR >110%; sales cycle 30–90 days; CAC payback 12–18 months |
| $50K+ | Sales-Led Growth (SLG) | Custom packaging with negotiated multi-year terms | Win rate 12–18%; NRR >115%; sales cycle 6–12 months; CAC payback 18–24 months |
Pricing gaps hit hardest in the $5K–$25K ACV band, where conflicting price signals and GTM expectations kill deals when the motion cannot support the implied buyer journey.
Step 2: Select Value Metrics That Grow With Customers
A strong value metric in B2B SaaS scales with customer success, is clear in procurement, can be measured reliably, and does not punish healthy adoption. Common options include seats or users, usage volume such as events, API calls, or minutes, revenue-under-management for fintech platforms, and domains or workspaces.
Metric selection by team size and motion:
- Small teams under PLG (<$10K ACV): Use usage volume or seat count. Both are self-explanatory and let buyers start free and expand without sales involvement.
- Mid-market hybrid ($10K–$50K ACV): Use a hybrid metric that combines a per-seat base with usage overages, such as seats plus API calls. The dominant 2026 pricing pattern is a subscription floor paired with usage-metered features such as AI credits, API calls, storage, and agent runs, per Bessemer State of the Cloud 2026.
- Enterprise SLG (>$50K ACV): Use outcome or revenue-under-management metrics that tie price to measurable business results and support multi-year negotiation.
Per-seat pricing on collaborative products slows internal adoption and constrains expansion because it ignores usage intensity beyond hiring growth. Avoid this pattern for products where value scales with activity, not headcount.
Step 3: Build Three-Tier Pricing With a Strong Middle Plan
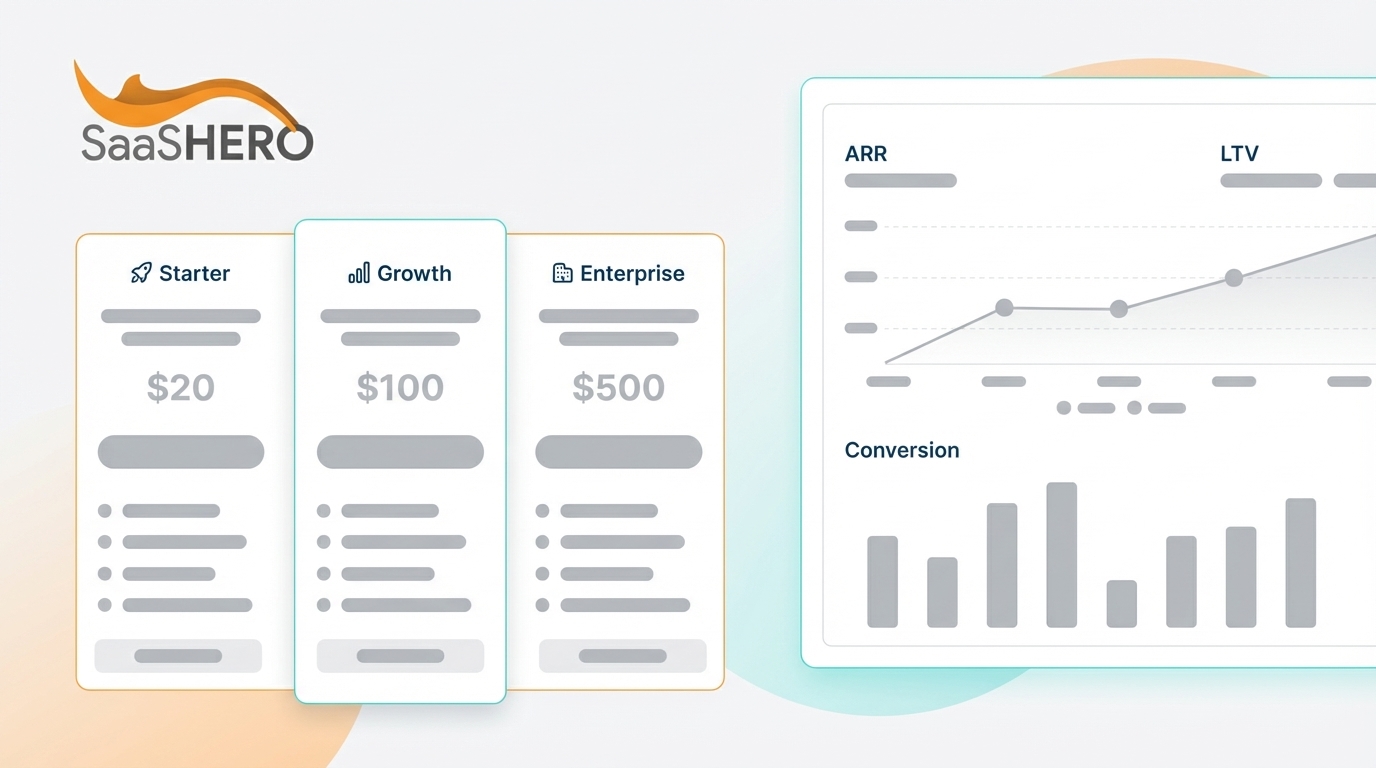
Three-tier structures usually convert better than single-tier offers and often deliver higher ARPU than four-or-more-tier setups. Many B2B SaaS teams treat three tiers as the practical sweet spot for pricing architecture.
Start with price gaps between tiers that span at least 50–100%. A 10–20% gap encourages downtrading, while a 150% or larger gap weakens the perceived value of the middle tier.
Once you have clear gaps, guide buyers toward the middle tier. Place the “Most Popular” badge on that plan and adjust visual weight. Highlighting the middle tier with a badge, larger card size, and contrasting background can increase conversion to that plan by reducing decision paralysis.
To justify higher tiers, gate enterprise-grade features such as SAML or SSO, role-based access controls, and audit logging in the top or Enterprise tier. These features can increase willingness to pay among larger organizations when gated behind paid tiers. Finally, add a fourth “Contact Sales” Enterprise tier above the three published tiers. Adding a fourth Enterprise tier above three existing plans can lift average revenue per visitor even when few visitors select the new top tier.
Common mistake: Teams often publish five or more tiers. Five or more pricing tiers create decision paralysis and reduce conversion. If the current layout has four or more published tiers, consolidate before testing anything else.
Step 4: Package Plans for Built-In Expansion and NRR
Expansion revenue should come from the product structure, not only from sales pushes. Expansion revenue accounts for 30–50% of new ARR at the best-performing SaaS companies, and expansion revenue drives 38% of new ARR for $25M+ ARR companies per KeyBanc Capital Markets SaaS Survey.
Use these expansion packaging tactics:
- Set usage limits at 70–80% of the next tier’s floor, not at a random ceiling. A data analytics SaaS that triggers automated workflows as customers approach plan limits can convert threshold alerts into expansion revenue more effectively than QBR-only expansion.
- Deploy contextual in-app prompts at the moment users hit limits. Many upgrade decisions happen right after a user reaches a usage cap or discovers a gated feature, and a prompt at that moment can materially improve conversion.
- Build add-on modules for features that serve a subset of accounts, such as advanced analytics, extra workspaces, or compliance exports, instead of stuffing everything into the top tier.
- Include annual price escalators in MSAs for enterprise accounts. B2B SaaS companies that add annual price increases to MSAs can generate extra NRR at zero incremental acquisition cost.
Teams that want a structured review of current pricing architecture can book a discovery call with SaaSHero to audit tiers, expansion mechanics, and NRR trajectory.
Step 5: Validate Pricing With a Three-Test Sequence
Run three tests in sequence before a full pricing rollout. Each test answers a different question and needs a specific sample size.
| Test | Method & Sample Size | Pass Criteria |
|---|---|---|
| Founder-led sales test | 5–10 structured sales conversations with ICP buyers who hold budget authority; present new pricing verbally and record objections | Fewer than 30% of prospects cite price as the primary objection; at least one paid pilot or serious procurement conversation starts |
| A/B landing-page test | 50/50 traffic split; minimum 100–200 conversions per variant; run for at least two full billing cycles, typically 28–45 days for monthly billing | Revenue per visitor lifts by 10% or more in the variant; 30-day refund rate and churn rate stay within 1 percentage point of control |
| Value-calculator test | Deploy an interactive ROI calculator on the pricing page; track calculator completion rate and downstream demo or trial conversion for 30 days | Calculator completers convert to demo or trial at twice the rate of non-completers; sales cycle shortens by at least 10% for calculator-assisted leads |
Low data volume troubleshooting: For SaaS products with fewer than 5,000 monthly visitors, qualitative methods such as sales calls, trial exit surveys, and five-second layout tests provide better signal than underpowered pricing experiments. Prioritize the founder-led sales test and value-calculator test before running a statistically powered A/B test. Teams need roughly 100 conversions per variant for meaningful pricing A/B test results. Below that threshold, rely on qualitative methods.
Use revenue per visitor as the primary metric for all quantitative tests, not conversion rate. Revenue per visitor captures the combined effects of conversion rate, ACV, and plan mix, while conversion rate alone can hide revenue declines from lower ACV.
Step 6: Set Up End-to-End Pricing and Revenue Tracking
Pricing changes stay invisible without instrumentation that connects ad click to closed revenue. The tracking stack must pass data from the ad click, such as GCLID or LinkedIn Insight Tag, through the landing page and into the CRM so campaigns can be tuned based on who bought, not who clicked.
Use these instrumentation steps:
- Pass click IDs such as GCLID and LinkedIn click ID as hidden fields on all forms and store them as CRM contact properties.
- Map CRM deal stages to revenue milestones, including SQL, opportunity created, closed-won, and first expansion event.
- Configure offline conversion imports that push closed-won revenue back to Google Ads and LinkedIn Ads for smart-bidding optimization.
- Build a Looker Studio or HubSpot dashboard that surfaces Net New ARR, CAC by channel, and payback period by cohort, not impressions or CTR.
Attribution gap handling: B2B buyers spend roughly 27% of their purchase time doing independent online research and only 17% meeting with potential suppliers. Last-click attribution systematically undercredits top-of-funnel channels. Use linear or time-decay attribution models in the CRM and supplement them with self-reported attribution through “How did you hear about us?” fields on demo request forms. Once this tracking infrastructure is in place, you need a regular cadence to review the data and act on what it reveals.
Step 7: Hold Quarterly Pricing Reviews With Clear Metrics
Companies that review pricing quarterly usually grow faster than those that review annually. The quarterly review functions as a structured check against four metrics, not a full redesign.
Metrics SaaSHero tracks in every quarterly pricing review:
- CAC payback period: Target bands by ACV are under 12 months for SMB, 12–18 months for mid-market, and 18–24 months for enterprise.
- NRR by cohort: Flag any cohort below the ACV-band target of 105% for SMB, 110% for mid-market, and 115% for enterprise for expansion packaging review.
- Expansion revenue as percentage of new ARR: Benchmark against the KeyBanc expansion benchmark cited earlier. Values below 20% at $25M+ ARR scale signal a broken expansion motion.
- Average discount rate: Discount rates above 20% on new logo deals usually indicate pricing misalignment, not sales execution problems.
Long sales-cycle troubleshooting: For enterprise deals with 6–12 month cycles, quarterly reviews will not yet show closed-won data from pricing changes made in the prior quarter. Use pipeline velocity, measured as days in each stage, and win-rate-by-stage as leading indicators, and set a 90-day proxy metric for annual contract pricing tests.
Advanced Variations: Hybrid Pricing With AI Credits and Usage Add-Ons
Usage-based pricing has become the majority pattern among public SaaS companies. Two specific variations are gaining traction in 2026.
AI-credit bundles: In April 2026, HubSpot announced outcome-based pricing for its Breeze AI agents, shifting Breeze Customer Agent to $0.50 per resolved conversation and Prospecting Agent to $1.00 per qualified lead. For most B2B SaaS products, a simpler approach works better. Include a fixed AI-credit allocation in each tier and sell credit top-ups as a usage add-on. This structure preserves subscription revenue predictability while capturing upside from heavy AI usage.
Usage-based add-ons: Instead of forcing tier upgrades for single-feature needs, offer modular add-ons such as additional API call blocks, extra storage, or extra workspaces priced at a per-unit rate. Expansion revenue for SaaS companies comes from seat expansion, tier upgrades, usage overages, and cross-sell. Usage add-ons act as a key expansion lever and usually require no procurement event to activate.
7-Step Pricing-GTM Checklist and Stage-Based Next Actions
Use this checklist to spot where the current pricing architecture breaks and then prioritize the step that addresses the highest-impact gap.
- Map target ACV to GTM motion using the 2026 benchmark table above.
- Select a value metric that scales with customer success and remains clear in procurement.
- Consolidate to three published tiers with a 50–100% price gap between each and a fourth “Contact Sales” Enterprise tier.
- Add usage limits, contextual in-app upgrade prompts, and at least one modular add-on for expansion.
- Run the three-test validation sequence of founder-led sales test, A/B landing-page test, and value-calculator test.
- Instrument click-to-closed-won tracking in the CRM and configure offline conversion imports.
- Schedule quarterly pricing reviews against CAC payback, NRR, expansion revenue percentage, and average discount rate.
Next actions by company stage:
- Pre-Series A / under $2M ARR: Focus on Steps 1–3. Validate the value metric and tier structure with founder-led sales tests before spending on paid acquisition.
- Series A / $2M–$10M ARR: Focus on Steps 4–5. Build expansion packaging and run the A/B landing-page test to generate empirical pricing data for investor diligence.
- Series B / $10M+ ARR: Focus on Steps 6–7. Full-funnel instrumentation and quarterly pricing reviews act as the primary levers for improving NRR and payback period at scale.
SaaSHero works with Series B RevOps leaders, founders, and pricing managers to execute this framework end-to-end, from ACV analysis through quarterly iteration. Book a discovery call to start your pricing-GTM audit.
Frequently Asked Questions
How long does a full pricing redesign take?
A complete pricing redesign, from ACV analysis through validated tier structure and instrumented tracking, typically takes 8 to 12 weeks for a Series B company with an established ICP and CRM. The first two weeks cover ACV mapping, value metric selection, and stakeholder alignment. Weeks three through six handle tier design, landing page build, and the founder-led sales test. Weeks seven through twelve run the A/B landing-page test and value-calculator test, then instrument end-to-end tracking. Companies with fewer than 5,000 monthly visitors or under 100 conversions per month should extend the validation phase and rely more heavily on qualitative methods, which adds two to four weeks. A pricing redesign that skips validation and goes straight to full rollout often produces a sharp one-time churn spike among existing customers when mid-cycle price changes hit, which remains the most common and most avoidable implementation mistake.
Which stakeholders must be involved in a pricing redesign?
A pricing redesign requires active participation from product, sales, finance, revenue operations, and customer success. Product owns the value metric definition and feature gating logic. Sales provides win and loss data, average discount rates, and objection patterns that reveal where current pricing fails in the field. Finance models CAC, LTV, and payback period under alternative pricing structures and sets guardrail metrics for the A/B test. Revenue operations instruments the click-to-closed-won tracking and builds the quarterly review dashboard. Customer success identifies expansion signals such as usage thresholds, feature adoption patterns, and account health scores that inform where usage limits and upgrade prompts should fire. Pricing redesigns led by a single function, usually finance or product, without sales and CS input often produce tiers that look correct on paper but fail in the field because they do not reflect how buyers evaluate and expand.
How does the framework adapt for pure PLG versus sales-led?
For pure PLG companies with ACV under $10K, Steps 1 and 2 compress because the GTM motion is fixed and the value metric must be self-explanatory to a buyer who never speaks to a salesperson. The validation sequence in Step 5 shifts weight toward the A/B landing-page test and value-calculator test, since founder-led sales conversations do not fit the motion. Feature gating in Step 3 must be calibrated carefully. Overly restrictive gating before users reach the activation moment can cause a large share of users to switch to competitors within one week. For pure sales-led companies with ACV above $50K, Steps 3 and 4 expand. Tier structure matters less than custom packaging flexibility, and expansion packaging in Step 4 relies on MSA price escalators and module attach plays rather than in-app usage prompts. The quarterly review in Step 7 uses pipeline velocity and win-rate-by-stage as leading indicators instead of self-serve conversion metrics.
How often should pricing be revisited after launch?
Early-stage companies before Series A should review pricing quarterly and stay open to structural changes every six to nine months as the ICP sharpens and the value metric is validated against real cohort data. Series A and Series B companies should maintain a quarterly review cadence for the four core metrics of CAC payback, NRR by cohort, expansion revenue as a percentage of new ARR, and average discount rate, then make incremental packaging or limit adjustments as those metrics signal drift. Major pricing model changes, such as shifting from per-seat to hybrid usage-based, should occur no more than once every 18 to 24 months to avoid customer trust erosion and CRM billing complexity. Annual list-price increases of 5–10% for new customers, baked into the standard review cadence, generate NRR uplift at zero incremental acquisition cost and represent a low-risk pricing action for a company with demonstrated pricing power.
Pricing-GTM alignment remains the highest-leverage revenue action available to a Series B SaaS company and also one of the most undermanaged. SaaSHero’s revenue team has managed over $30 million in B2B SaaS ad spend and helped clients add $504,758 in Net New ARR in a single year by connecting pricing architecture directly to paid acquisition and CRM instrumentation. Book a discovery call with SaaSHero to get a structured pricing-GTM audit and a clear path to improved conversion, NRR, and payback period.