




Written by: Aaron Rovner, Founder, Saas Hero
Key Takeaways
- Multi-month B2B SaaS sales cycles need a maintained field-level join from ad click (GCLID, li_fat_id) through CRM contact, account, and opportunity to closed-won ARR. No ad platform builds or maintains this join automatically.
- Default 30-day attribution windows miss 62% of B2B SaaS conversions. The correct window runs 1.5–2x the median sales cycle length by ACV tier.
- Position-based (U-shaped) attribution, combined with bidirectional CRM–ad platform data flow and account-level rollup, produces board-ready closed-won ARR reporting by channel.
- 2026 platform mechanics require Enhanced Conversions via Google Data Manager and LinkedIn Conversions API with stage-level conversion actions and 180-day windows to feed Smart Bidding accurately.
- SaaSHero operates as the outsourced inbound growth team that owns this measurement layer end to end, from impression to CRM record, and optimizes against closed-won ARR rather than form fills.
Talk With SaaSHero About Closed-Won ARR Attribution
Why 30-Day Attribution Windows Miss Most B2B SaaS Revenue
Google Ads defaults to a 30-day click-through conversion window. Meta Now Defaults To A 7-Day Click Attribution Window, down from 28 days following iOS 14 privacy changes. Both windows were calibrated for short-cycle paid-response advertising and do not match multi-week SaaS evaluations.
The mismatch is structural. For B2B SaaS Annual Contracts, Only 38% Of Conversions Occur Within 30 Days; 47% Occur Between Days 31 And 90, And 15% Occur After 90 Days, so a 30-day window misses 62% of conversions for annual-contract B2B SaaS. A 30-Day Attribution Window On A 120-Day Sales Cycle Means Any Marketing Touch In The First 90 Days Of The Journey Receives Zero Credit. Awareness campaigns, content, and LinkedIn prospecting all get structurally undercredited.
The correct window is sized to the sales cycle. Stackmatix’s 2026 B2B SaaS attribution guide recommends setting attribution windows to at least 1.5x the average sales cycle length. A 90-day cycle implies a 135-day window. A 180-day cycle implies a 270-day window. ACV-based benchmarks from A SaaS-Focused Benchmark Corpus provide the starting point for window sizing by deal tier:
- Under $10K ACV: 6-week median cycle → 9-week attribution window
- $10K–$50K ACV: 12-week median cycle → 18-week attribution window
- $50K–$100K ACV: 17-week median cycle → 25-week attribution window
- $100K+ ACV: 24-week median cycle → 36-week attribution window
Optifai’s 2026 Pipeline Study Of 939 B2B Companies Found B2B Sales Cycles Have Lengthened 22% Since 2022, driven by larger buying committees and increased security and compliance review even at the mid-market. Teams must recalibrate window sizing against current CRM data rather than rely on industry defaults from three years ago.
Tip: Use median rather than average days-to-conversion when sizing the window. Sales Cycles Are Right-Skewed. A handful of enterprise deals that took six months drag the mean far above where most conversions cluster. That inflation produces a window that contaminates reports with unrelated revenue.
The Data Model: Joining The Ad Click To Closed-Won ARR
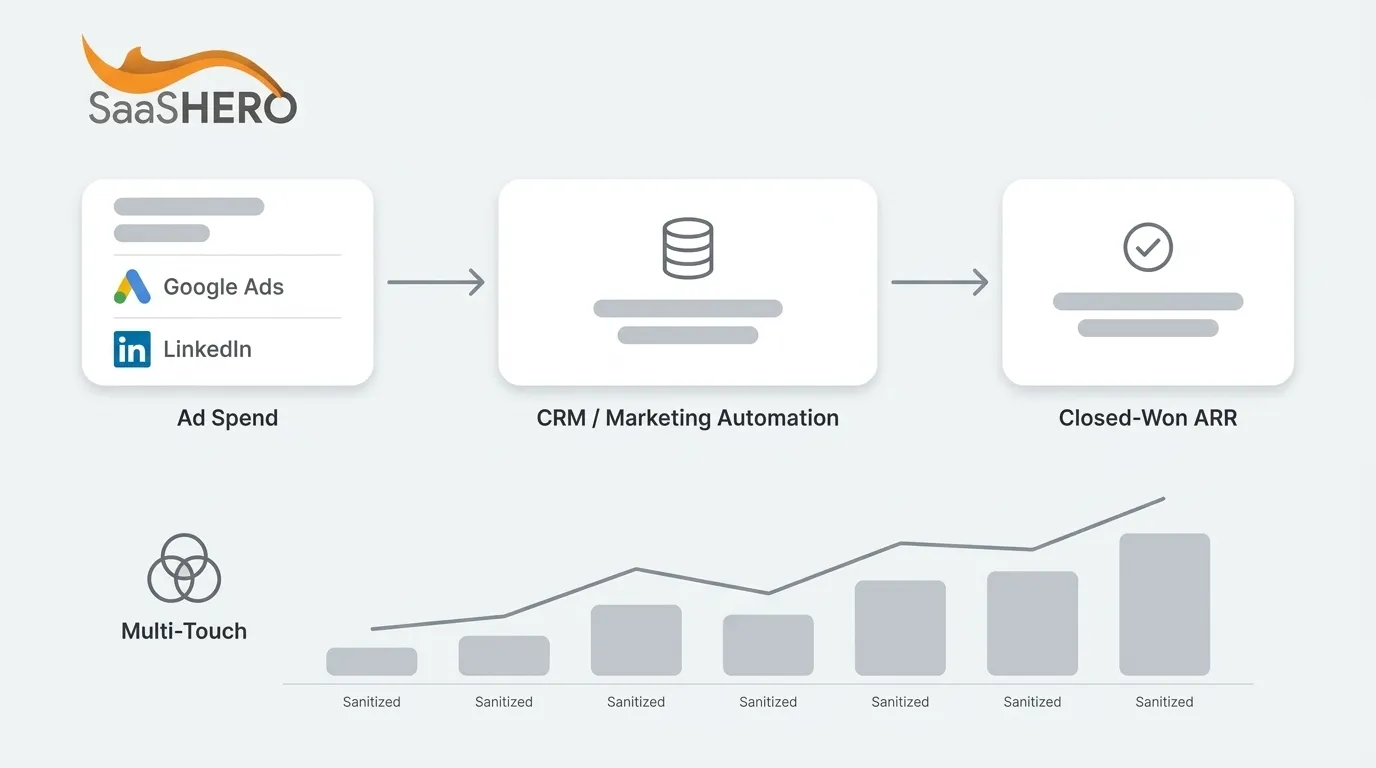
Sizing the window correctly only helps when the data inside it can be joined end to end. That join is the gap no competitor fills. The schema below connects the ad platform identifier to closed-won ARR through four layers.
Ad Platform Layer
- GCLID (Google), MSCLKID (Microsoft), li_fat_id (LinkedIn)
- Campaign ID, ad group ID, keyword, click timestamp
CRM Contact Layer
- Contact ID, email (hashed), first touch timestamp, lead source, lifecycle stage
CRM Account Layer
- Account ID, domain, company name
CRM Opportunity Layer
- Opportunity ID, account ID, amount, stage, created date, close date, closed-won ARR
The join logic runs in sequence. GCLID connects to contact via landing page form or enhanced conversions. Contact connects to account via domain match. Account connects to opportunity via standard CRM association. Opportunity connects to closed-won ARR via stage and amount fields.
Each tool plays a specific role in this architecture.
- HubSpot Revenue Attribution: The Deal Revenue Attribution Report filters by Deal close date and is available to Marketing Hub Enterprise accounts. It supports five models: First Touch, Last Touch, Linear, Time Decay, and Empirical. The Empirical model weights less-frequent interaction types such as form submissions more heavily than high-volume page views.
- Salesforce: The native data model runs Campaign → Campaign Member → Lead/Contact → Opportunity → Revenue. Customizable Campaign Influence uses the Campaign Influence junction object to associate multiple campaigns with a single opportunity and assign revenue share.
- HockeyStack, Dreamdata, Cometly: These third-party attribution platforms ingest CRM and ad platform data, apply configurable stage models (MQL, SQL, NewBiz), and expose attributed and influenced metrics separately. Dreamdata Distinguishes Attributed Metrics From Influenced Metrics, with influenced metrics calculated independently of the selected attribution model.
- Looker Studio: This reporting surface combines ad platform data and CRM outcomes into a single view for board-ready reporting.
Common Mistakes: Salesforce Attribution Accuracy Degrades From Missing Campaign Members, Inconsistent Campaign Names, And Incomplete Opportunity-Contact Relationships. These issues reflect data governance failures, not model failures. Teams must resolve them before debating which attribution model deserves more credit.
See How SaaSHero Builds The Field-Level Join
How To Do Multi-Touch Attribution For A 6-Month Sales Cycle
The steps below answer the “how to do multi-touch attribution” query and are designed to be implemented in sequence.
- Define The Stage Model. Map MQL → SQL → Opportunity → Closed Won to specific CRM fields with timestamps. Every stage transition must produce a datestamped record in the CRM. Without timestamps, the join logic has no sequence to follow.
- Size The Attribution Window. Apply the 1.5–2x rule to the median days-to-conversion computed from the last 90 days of closed deals, segmented by ACV tier. Revisit On Three Triggers: A Pricing Change, A Channel-Mix Shift, And A Quarterly Health Check That Recomputes Median Days-To-Conversion And Adjusts If It Has Drifted More Than 30%.
- Choose The Attribution Model. Position-Based (U-Shaped) Attribution Is The Strongest Starting Model For B2B SaaS. It credits 40% to the first marketing touch, 40% to the last marketing touch before sales handoff, and distributes 20% across middle touches. W-shaped and full-path models add a third credit point at the opportunity creation stage. These models suit teams with high deal volume and clean stage data but require more CRM hygiene to produce reliable output.
- Connect CRM And Marketing Data Bidirectionally. Attribution breaks when data flows in only one direction. Push marketing touchpoints into the CRM as campaign memberships or contact activities so the CRM knows which campaigns touched the deal. Then pull revenue data, including deal amounts, close dates, and pipeline stages, from Salesforce or HubSpot back into the attribution model so the model can score those touches against closed-won outcomes.
- Apply Account-Level Attribution. Group Touchpoints From Multiple Individuals At The Same Company Into A Single Account Journey Using Email Domain Matching, CRM Account Association, Or Reverse IP Lookup. A VP of Marketing and a Marketing Manager at the same company participate in one buying decision and share a single account journey.
- Report Marketing-Influenced Pipeline And Revenue At Campaign And Channel Level. The output metric is closed-won ARR attributed by channel. Form-fill volume by campaign becomes a diagnostic metric rather than the primary success metric.
Tip: B2B SaaS Companies Need At Least 30–50 Closed Deals Per Quarter To See Meaningful Patterns From Attribution Models. Below that threshold, sample size is too small for statistically reliable channel-level insights. Use qualitative attribution such as customer journey interviews and CRM deal notes instead of forcing a model onto insufficient data.
Sending Closed-Won Revenue Back To Google Ads And LinkedIn In 2026
Google: Enhanced Conversions And Data Manager
Starting 15 June 2026, Google Will Migrate Offline Conversion Import And Enhanced Conversions For Leads Uploads To The Data Manager API And Block Them In The Google Ads API. Developer tokens that have not sent a request between January 2026 and June 2026 will not be allowlisted for legacy access. The legacy GCLID-only offline conversion import path is deprecated. Enhanced Conversions for Leads via Data Manager is now the standard path.
The implementation sequence follows four steps.
- Configure the Google tag to capture hashed user-provided data, such as email address or phone number, from lead forms on the website.
- Set up automated import of offline conversions using Google Ads Data Manager or the Google Ads API, using the same hashed customer data.
- Include GCLIDs with uploaded events wherever possible. For Salesforce And HubSpot Connectors, Data Manager Imports Only The Last 14 Days Of Data On The First Run. Plan a separate historical backfill step for data older than 14 days.
- Create a separate Google Ads conversion action for each funnel stage, including MQL, SQL, Opportunity, and Closed Won, and assign each a value that reflects its place in the funnel. New Offline Conversion Actions Should Be Set To Secondary Rather Than The Default Primary. A brand-new Primary conversion enters bidding with no history and destabilizes delivery.
Troubleshooting: Smart Bidding Needs At Least 15 Conversions Per Month Of The Event Being Optimized Toward Before That Conversion Should Drive Bidding. Below that threshold, the algorithm lacks sufficient signal and behaves erratically. Run lower-volume stage events as Secondary conversions and optimize toward a higher-volume upstream event, such as SQL rather than Closed Won, until volume supports the downstream signal.
LinkedIn: Conversions API
LinkedIn’s Conversions API Is The Mechanism For Attributing Offline And Online Marketing Data To A LinkedIn Campaign. Create multiple conversion rules to attribute ad campaign impact to different CRM sales stages representing both pipeline and closed-won deals. Pass conversion value dynamically through the CRM to calculate ROAS as Total Conversion Value divided by Spend.
LinkedIn Added MARKETING_QUALIFIED_LEAD And SALES_QUALIFIED_LEAD As Granular Conversion Types Starting With The 202608 API Version, enabling deeper-funnel campaign optimization beyond the existing QUALIFIED_LEAD type. LinkedIn’s Conversions API Supports A 180-Day Post-Click And View-Through Attribution Window Option On The Conversion Rule Schema for conversion types including QUALIFIED_LEAD, MARKETING_QUALIFIED_LEAD, and SALES_QUALIFIED_LEAD.
LinkedIn Recommends Sending Both SHA256_EMAIL And LINKEDIN_FIRST_PARTY_ADS_TRACKING_UUID For Best Matching. The li_fat_id mapping to a LinkedIn member profile is stored for 365 days. That persistence allows it to serve as a match identifier even after the browser cookie has expired.
LinkedIn’s Conversions API Takes Up To 24 Hours To Complete Event Ingestion And An Additional 48 Hours For Reporting, so teams should plan for up to 72 hours before complete data appears in Campaign Manager. LinkedIn Marketing Version 202510 Will Be Sunset On October 15, 2026. Migrate to the latest versioned APIs before that date.
Cohort-Based Reporting: Separating Realized And Expected ROAS
Cohort-based reporting separates mature cohorts, where closed-won ARR is fully realized, from immature cohorts where pipeline is still open. This separation matters for board reporting. Blending the two into a single ROAS number produces a figure that misstates performance in both directions.
The worked example below shows how a single month’s spend splits into a realized portion and a modeled portion. That split produces two different ROAS figures from the same cohort. Figures are illustrative.
- January spend: $100,000
- Opportunities created from January spend cohort: 20
- Pipeline created: $800,000
- Closed-won ARR (mature portion): $400,000
- Open pipeline (immature portion): $400,000
- Historical stage-to-close rate applied to open pipeline: 50%
- Expected ARR from open pipeline: $200,000
- Total Expected ARR: $600,000
- Realized ROAS: 4.0x ($400K / $100K)
- Expected ROAS: 6.0x ($600K / $100K)
Reporting template columns:
| Cohort Month | Spend | Opportunities Created | Pipeline Created | Closed ARR | Expected ARR From Open Pipeline | Total Expected ARR | Realized ROAS | Expected ROAS |
|---|---|---|---|---|---|---|---|---|
| January | $100,000 | 20 | $800,000 | $400,000 | $200,000 | $600,000 | 4.0x | 6.0x |
Tip: Label realized versus expected ROAS explicitly in every board report. A CFO who sees a single blended ROAS number will ask which portion is closed revenue and which is modeled. Answer that question in advance by separating the two columns in the dashboard.
Attribution Vs. Incrementality In B2B SaaS
Attribution shows what is associated with revenue. Incrementality shows what caused it. A board-ready measurement program needs both layers, reported separately and never blended into one number.
Across 15 Large-Scale Advertising Randomized Controlled Trials Covering 500 Million User-Experiment Observations And 1.6 Billion Impressions, Observational Methods Were Off By A Factor Of Three In Half The Studies, Usually Overstating Advertising’s Effect. Attribution models distribute credit. They do not measure whether the deal would have happened without the ad.
Three test designs apply well to B2B SaaS.
Geographic Holdouts: Pause all paid advertising in matched geographic markets and compare conversion rates against live markets. Run geographic holdout tests for a minimum of 30 days, though B2B may need 60–90 days because shorter tests miss lagged conversions and understate true incremental lift. Compute incremental ROAS as incremental revenue divided by spend in the test geos. Google Researchers Jon Vaver And Jim Koehler Formalized The Geographic Holdout Method Using The 210 US Designated Market Areas As The Standard Partition.
Account-Level Holdouts: Randomly Split Target Accounts Into Treatment And Control Groups, Suppress Ads For The Control Cohort Via Exclusion Lists On Every Platform In The Test, And Compare Pipeline Creation And Closed-Won Revenue Over A Window At Least As Long As The Sales Cycle. This design fits B2B because the account, rather than the individual, is the unit that generates revenue.
Campaign Suppression: Pause a specific campaign and measure the delta in total qualified pipeline over one full sales cycle. This design is the simplest and the easiest to execute. It cannot isolate the effect of a single channel from concurrent activity.
For A B2B Design Of 800 Target Accounts Split Evenly Into Treatment And Control With 8% Of Control Accounts Expected To Create An Opportunity During The Test Window, The Smallest Lift Detectable At 95% Confidence And 80% Power Is A 67% Relative Increase In Opportunity Creation. Detecting a 20% lift at the same baseline would require roughly 4,500 accounts per arm.
Common Mistakes: Common B2B Incrementality Test Contamination Paths Include Contacts From One Account Split Across Arms, Lookalike And Similar-Audience Expansion Serving Control Accounts, And Parallel Outbound And SDR Sequences. Contamination that leaks demand generation into the control group biases measured lift downward. Real lift measured in spite of contamination is stronger than it looks.
The Board-Ready Reporting Artifact
Board reporting must use the CFO’s vocabulary, including CAC, payback period, and pipeline coverage. Platform metrics such as impressions, clicks, and cost per lead do not answer board-level questions. The table below maps each metric a CFO actually asks about to the CRM-sourced number you should report and the platform metric you should avoid.
| Metric | What The CFO Asks | What To Report | What To Avoid |
|---|---|---|---|
| CAC | Cost to acquire a customer | Blended CAC and CAC by channel, sourced from CRM | Platform-reported cost per lead |
| Payback period | Months to recover CAC | CAC payback using closed-won ARR and spend | Platform-reported ROAS |
| Pipeline coverage | Pipeline vs. target | Marketing-sourced pipeline coverage ratio | Form-fill counts |
| ROAS | Return on ad spend | Realized ROAS (closed-won) and Expected ROAS (modeled) labeled separately | Blended single ROAS number |
The comparison table below shows how attribution approaches differ on the dimensions that matter for a multi-month B2B SaaS program.
| Attribution Approach | Window Sizing | CRM Connection | Best For |
|---|---|---|---|
| Platform default (30-day) | Fixed 30 days | None | Short-cycle B2C |
| Extended platform window | 90–180 days | None | Mid-cycle B2B |
| CRM-connected attribution | 1.5–2x sales cycle | GCLID → contact → account → opportunity | Multi-month B2B SaaS |
| Incrementality testing | Test duration = sales cycle | Account-level holdout | Validating attribution |
Tip: Use Looker Studio and HubSpot dashboards to show pipeline, CAC, and payback period rather than impressions and clicks. Board reporting then becomes a live view of the same dashboard the team works from every week instead of a separate exercise assembled the week before the meeting.
Frequently Asked Questions
How Long Does It Take To Set Up CRM-Connected Attribution?
Setup time depends on CRM complexity and platform integrations. Google’s Data Manager imports conversions from up to 90 days ago for file and cloud sources, and only the last 14 days for Salesforce and HubSpot connectors on the first run. LinkedIn’s Conversions API takes up to 24 hours to complete event ingestion and an additional 48 hours for reporting. For native Salesforce multi-touch attribution using Campaign Influence plus custom reports, plan for a 2–4 week implementation window including historical data cleanup, conversion action configuration, and CRM field mapping validation; integrating external marketing platforms adds 2–4 weeks per platform.
What Roles Are Required To Maintain This Measurement Architecture?
Teams need three core roles. A RevOps or Marketing Operations owner manages CRM field mapping and lifecycle stage definitions. A paid media manager owns platform-side conversion configuration and Data Manager setup. A marketing leader owns the reporting narrative and translates CRM data into board-ready metrics. In practice, the seams between these roles are where measurement breaks. The conversion action may be configured correctly in Google Ads while the CRM field it reads from is inconsistently populated, or the HubSpot lifecycle stage may be updated manually rather than by automation. SaaSHero operates as the outsourced inbound growth team that owns this measurement layer end to end, including the join logic between the ad platform and the CRM record.
How Does This Adapt For Smaller Vs. Larger SaaS Teams?
Smaller teams at $10M–$20M revenue can start with a single CRM-connected conversion action for SQL and expand to stage-level conversion actions as volume grows. The 15-conversions-per-month floor for Smart Bidding means that a team closing 8 SQLs per month should optimize toward a higher-volume upstream event, such as MQL or form submission, until SQL volume reaches Google’s recommended minimum of roughly 30 conversions per month per campaign for reliable Smart Bidding. For SaaS teams at $50M+ ARR, ORM recommends advanced data-driven attribution with account-level rollup, audience holdout tests that split a target account list into exposed and withheld groups, and continuous incrementality testing across channels.
What Are The Most Common Risks And Troubleshooting Steps?
The most common failure modes in CRM-connected attribution for B2B SaaS are missing UTM/GCLID parameters (caused by redirects or form submissions that strip the parameter), incomplete Salesforce Campaign Member records (HubSpot’s Salesforce integration cannot write to Campaign Member fields, leaving opportunities unattributed), and broader CRM data quality gaps that undermine attribution accuracy. Troubleshoot Google implementations using the enhanced conversions diagnostics report in Google Ads, which identifies missing or incorrectly formatted user-provided data and incorrect in-page code. Troubleshoot LinkedIn using the signal quality indicators in Campaign Manager — a Low Match Rate status indicates the conversion events are not matching LinkedIn profiles at sufficient rates. For Salesforce, run a Campaign Member audit using the ‘Campaigns with Opportunities’ report type filtered by Stage = Closed Won and Close Date range, to identify the share of closed-won deals with no campaign association (no Contact Role linked to a Campaign Member).
What Measurement Expectations Should We Set With The Board?
Set expectations that the first 90 days establish the measurement architecture and produce the first cohort data rather than the first realized ROAS. Realized ROAS is visible only for mature cohorts where the sales cycle has completed. Immature cohorts require expected-value modeling using historical stage-to-close rates. Report both separately and label them explicitly. For a six-month B2B sales cycle with a two-to-five-month ramp period for opportunity creation, a January spend cohort’s first revenue lands in month seven (July) and the monthly rate stabilizes at twelve to thirteen months, so complete closed-won ARR is not visible until Q3 at the earliest. The board should also understand that the Expected ROAS figure is a modeled estimate. Incrementality test results, when available, should be reported alongside attribution output as a separate layer rather than blended into the attribution number.
How Often Should We Revisit The Attribution Window And Model?
Teams should revisit the attribution setup when the triggers described in the multi-touch attribution steps occur. The quarterly health check is the trigger most often skipped, so treat it as the default cadence and let pricing changes or channel-mix shifts override it when they happen. The attribution model itself should be revisited when deal volume crosses the 30–50 closed deals per quarter threshold that makes model output statistically meaningful, or when a new funnel stage is added to the CRM that changes the join logic.
Conclusion: The Measurement Layer Is The Weakest Link
Multi-month B2B SaaS sales cycles break standard attribution because nothing joins the ad click to the CRM opportunity unless somebody builds and maintains the join. The click is recorded in Google Ads or LinkedIn. The opportunity appears in Salesforce or HubSpot months later. The default report is last-touch. Every budget decision made on that report defunds the channels that created demand and rewards the branded search that captured it after the decision was already made.
The fix is a maintained field-level join from GCLID through contact, account, opportunity, and closed-won ARR. That join must be combined with extended attribution windows sized to the actual sales cycle, stage-level conversion actions feeding Smart Bidding, and cohort reporting that separates realized from expected ROAS. Incrementality testing sits on top of that architecture as the causal validation layer that confirms what attribution only associates.
SaaSHero operates as the outsourced inbound growth team that owns this measurement layer end to end, from impression to CRM record, and optimizes against closed-won ARR rather than form fills. Teams evaluating their current setup should ask whether they are optimizing campaigns around CRM data or just form submissions. When the answer is form submissions, the ad platform trains itself to find the wrong people, and the damage appears in the CRM a quarter after the budget is spent.
See How SaaSHero Measures Multi-Month SaaS Revenue