




Written by: Aaron Rovner, Founder, Saas Hero
Key Takeaways
- Demand generation agency reporting connects ad spend directly to CRM outcomes like pipeline and revenue, instead of stopping at form fills or cost per lead.
- Reports should group metrics into three tiers: revenue outcomes (Tier 1), pipeline outcomes (Tier 2), and leading indicators (Tier 3), with Tier 1 metrics driving board-level conversations.
- A complete report includes an executive summary, funnel performance, channel and campaign breakdowns, attribution methodology, experiments, risks, and a 30/60/90-day action plan.
- Multi-touch attribution models, especially W-shaped, work best for B2B SaaS with long sales cycles, while last-touch belongs in diagnostic views only.
- SaaSHero delivers CRM-connected reporting that trains campaigns around qualified pipeline and revenue outcomes instead of raw form submissions.
Talk To SaaSHero About Your Reporting
The Three Tiers Of Demand Generation Reporting
Every demand generation report should organize its metrics into three tiers so stakeholders instantly see which numbers matter most. The tier a metric belongs to determines where it appears in the report and how much weight it carries in a board conversation.
Tier 1 — Revenue Outcomes: closed-won revenue, customer acquisition cost (CAC), CAC payback period, LTV:CAC ratio, and net revenue retention. These are the numbers a CFO evaluates a channel on, and they come with clear benchmarks. An LTV:CAC ratio of 3:1 is generally considered healthy for SaaS, and CAC payback under 12 months is strong.

Tier 2 — Pipeline Outcomes: marketing-sourced pipeline, marketing-influenced pipeline, sales-qualified leads (SQLs), cost per SQL, cost per opportunity, and pipeline coverage ratio. Mature B2B marketing programs typically source 30–50% of total pipeline. Marketing-sourced pipeline is the leading indicator that most directly predicts marketing-sourced revenue, so these metrics answer board questions about future revenue.
Tier 3 — Leading Indicators: qualified lead volume, cost per qualified lead, engagement rates, and branded search volume. Activity metrics answer what marketing did; response metrics answer how the market responded. Tier 3 metrics are diagnostic and explain why a Tier 2 number moved, but they never serve as headline metrics.
Top-performing demand generation programs consistently achieve MQL-to-SQL conversion rates above 20–30% on their best campaigns. Reports need to show that conversion rate by channel so leaders can see exactly where the funnel is breaking.
Those tiers and conversion rates become useful only when they sit inside a structured report that decision-makers can scan quickly, which the next section outlines.
What Should A Demand Generation Agency Report Include?
A complete demand generation agency report follows a clear structure that moves from outcomes to actions. A report missing the executive summary or the next-actions section becomes a historical document instead of a tool for improving performance.
- Executive Summary – State the pipeline number, whether it will be hit, and what is at risk. Write this in the CFO’s vocabulary using pipeline coverage, CAC payback, and marketing-sourced pipeline against target. Keep it to three sentences or fewer.
- Funnel Performance – Show lead to MQL to SQL to opportunity to closed-won by stage, with conversion rates between each stage. B2B MQL-to-SQL conversion broadly benchmarks at 10–20%; below 10% indicates poor lead quality or sales-marketing misalignment.
- Channel Performance – Report paid search, paid social, and any other active channel on pipeline created and cost per SQL instead of cost per lead. Cost per lead flatters almost any campaign because low-quality leads are cheap to generate.
- Campaign Performance – Break down performance by campaign, ad group, and audience so stakeholders see which structures produced qualified pipeline and which produced form fills that never converted.
- Attribution Methodology – Explain the model used, why it was chosen, and its known limitations. This section prevents performance conversations from turning into debates about methodology.
- Experiments And Learnings – List what was tested, what it produced, and what is being tested next. When this section is missing, the agency is maintaining the account instead of advancing it.
- Risks And Dependencies – Highlight what could break the pipeline number and what the client needs to do to prevent that outcome.
- Next 30/60/90-Day Plan – Spell out specific actions, owners, and expected outcomes. This section shows that the agency owns the account and has a concrete plan.
- Appendix – Include platform-reported metrics such as impressions, clicks, and cost per click for reference only. Label these clearly as secondary so they do not drive optimization decisions.
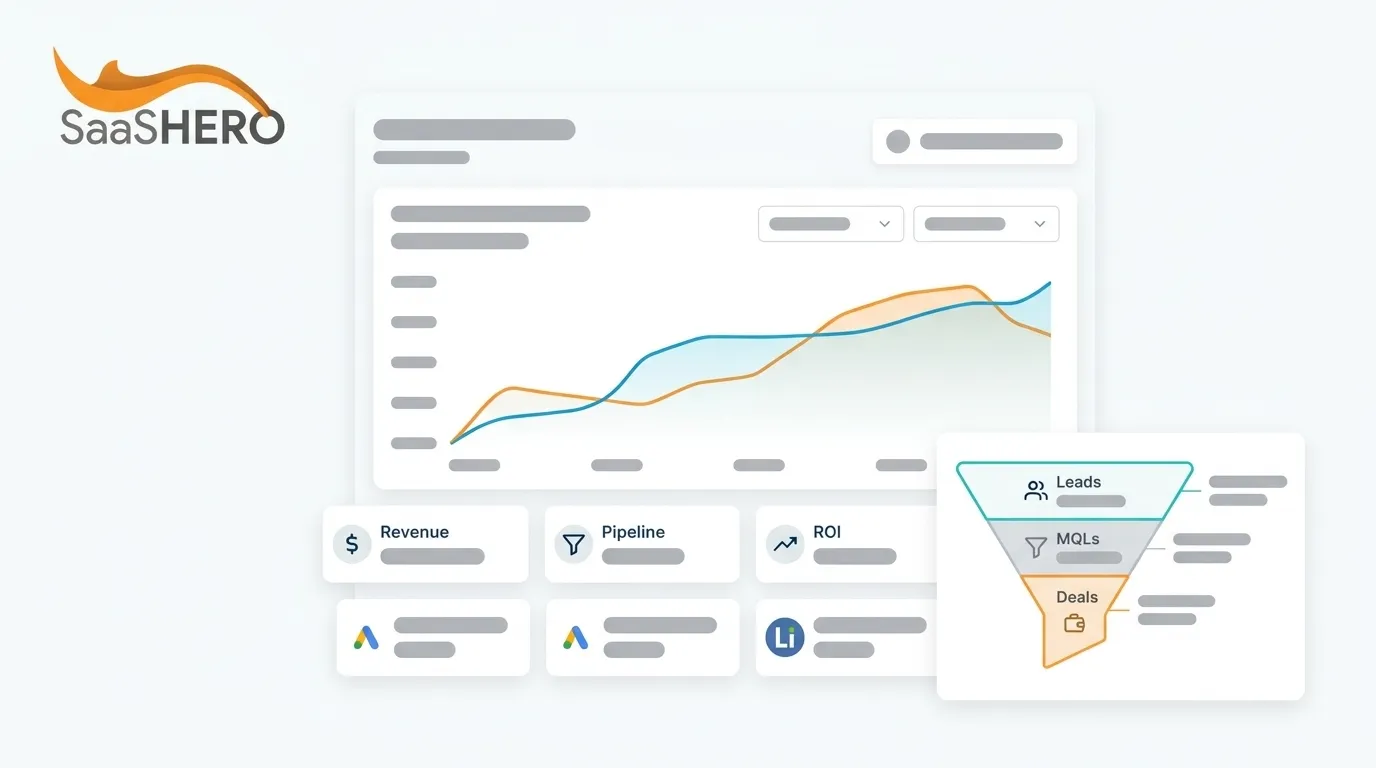
See A CRM-Connected Report In Action
Demand Generation Attribution Models Explained
B2B SaaS companies with multi-month sales cycles and buying committees need multi-touch attribution because the data supports that approach. Last-touch belongs in diagnostic views and should not serve as the primary model.
Last-touch credits the branded search that happened after the buyer was already convinced. Channels that created demand, such as paid social, content, and events, then appear weak and lose budget. Last-touch overvalues bottom-funnel channels such as branded search and demo forms, which systematically over-rewards demand harvesting while starving demand creation.
First-touch helps leaders understand which channels generate net-new contacts, but it ignores every touch after the initial one. That gap becomes significant in a buying cycle that Forrester’s 2026 State Of Business Buying report found now involves an average of 13 internal stakeholders and 9 external influencers.
Self-reported attribution, which asks “how did you hear about us?”, captures dark social and research where no pixel reaches. Industry estimates put the dark-funnel share between 38% and 51%. Self-reported attribution works best as a supplement to multi-touch rather than a replacement.
Most B2B SaaS companies can treat W-shaped attribution as the practical default. This model assigns 30% to first touch, 30% to lead conversion, 30% to opportunity creation, and spreads the remaining 10% across middle touches. GitLab’s demand generation handbook uses a linear (fractional) attribution model for MQLs, while Marketing Generated Pipeline (MGP) is attributed via GitLab’s GitLab-owned multi-touch attribution model implemented in Snowflake as a verifiable, auditable baseline. Linear attribution, which gives equal credit to every touch, provides a defensible starting point when data is messy and needs auditing before a more complex model goes live.
The right attribution model depends on deal volume, sales-cycle length, and data maturity. Consistency matters more than model choice, so teams should pick one model, document its assumptions, apply it uniformly, and disclose the methodology in every report so results stay comparable over time.
Marketing-Sourced Vs Marketing-Influenced Pipeline
Marketing-sourced pipeline and marketing-influenced pipeline need to be reported as separate numbers so leaders avoid double-counting that a CFO will spot immediately.
Marketing-sourced pipeline is the total dollar value of opportunities where marketing served as the first touch and generated the net-new contact before any sales activity. It functions as a first-touch, binary metric, where the deal either belongs to marketing or does not. Marketing-sourced pipeline is typically defined using first-touch attribution set at lead creation, with the lead source set once and not overwritten as the opportunity progresses, though inconsistent lead source capture remains a common failure point.
Marketing-influenced pipeline is the total dollar value of opportunities where marketing touched the prospect at any point in the buying journey, including after a sales touch. Pipeline influenced often reveals that marketing is influencing 60–80% of all pipeline, far more than last-touch sourced attribution captures.
Both numbers require agreed definitions documented before the reporting period starts. The most common attribution mistake is not choosing the wrong model but building the report before agreeing on definitions. Without agreed definitions, performance conversations drift into methodology debates instead of budget decisions.
The definitions must be configured in HubSpot or Salesforce and owned jointly by marketing and RevOps. In Salesforce, lead source flows to account source and to lead source on the contact and opportunity at conversion, but custom fields require explicit mapping by an admin, and unmapped custom source fields are the most common reason a sourced number evaporates at the conversion boundary.
The CRM-To-Ad-Platform Feedback Loop
Modern ad platforms operate as goal-seeking algorithms that adjust bids and audiences based on the conversion events they receive. Google Ads’ Enhanced Conversions For Leads uses hashed user-provided data to supplement imported offline conversion data, improving conversion measurement accuracy and bidding performance, but only when the conversion events represent qualified outcomes.
Accounts that optimize toward a form fill train the algorithm to find people most likely to fill out forms, such as students, job seekers, competitors, and existing customers. Cost per conversion falls and the dashboard looks better, while pipeline stays flat. This pattern reflects a self-fulfilling-prophecy mechanism where the platform succeeds at the goal it was given.
The correction starts by separating primary conversions, such as SQL created, opportunity created, and closed-won, from secondary conversions, such as content downloads, webinar registrations, and newsletter signups. Primary conversions drive account-wide optimization. Secondary conversions remain visible in reporting but stay excluded from bidding signals.
The next step involves pushing lifecycle stage events from HubSpot or Salesforce back into Google Ads and LinkedIn Ads as conversion actions. When a lead becomes an SQL, when an opportunity is created, and when a deal closes, those events return to the platform as the signals worth optimizing toward. Microsoft Advertising’s offline conversion import supports three methods, including one-time file upload, scheduled recurring imports, and API uploads, which makes CRM-to-ads feedback loops operationally practical.
SaaSHero’s mandatory discovery question targets this gap directly: “Are you optimizing campaigns around CRM data or just form submissions?” The answer reveals whether the report will drive action and whether the algorithm will search for the right people tomorrow.
How To Report Demand Generation To A Board
Board reporting uses the same CRM-connected dashboard that the marketing team relies on, filtered to the metrics a CFO and board actually evaluate.
The CFO focuses on unit economics and cash timing, including CAC, CAC payback period, and pipeline coverage ratio. The board looks for efficiency trends, such as whether marketing-sourced pipeline grows quarter over quarter and whether cost per opportunity improves. The CEO wants a clear view of whether the number will be hit. None of these questions require channel-level detail, and none can be answered by a monthly PDF of platform metrics.
SaaSHero’s reporting stack uses Looker Studio dashboards alongside HubSpot reporting to connect ad platform data to CRM data. This setup puts platform-side metrics and CRM-side outcomes in one view instead of forcing teams to reconcile three spreadsheets the day before the board deck is due. Board-ready reporting becomes the artifact that protects the budget.

Reporting Cadence
Reporting cadence shapes how quickly teams catch issues and make decisions. A report delivered on a fixed schedule without being requested signals an agency that owns the account.
Weekly Operational Updates: cover spend pacing, lead volume by channel, any tracking anomaly, and what is being tested. A weekly 10-minute pulse check on spend pacing and lead volume by channel catches a tracking break early before it corrupts monthly numbers.
Monthly Pipeline And Attribution Review: covers full funnel performance, channel performance measured on pipeline and cost per SQL, attribution methodology, experiments and learnings, and risks. Monthly review covers lagging indicators like pipeline created, CAC, and conversion rates.
Quarterly Budget Analysis: reviews allocation across channels against results and identifies which channels earned their allocation, which did not, and where the next dollar should go.
Monthly Competitor Analysis: tracks what competitors are bidding on, what messaging they are running, and where the gaps are. Competitive position in paid media depends on who is bidding this month.

What The Client Should Demand From The Agency Report
Clients can use the agency report as a litmus test for whether the partnership supports board-level accountability.
Before the next agency review, ask these questions:
- What is the ad platform trained on, form fills or qualified opportunities?
- What does the monthly report lead with, leads and CPL or pipeline and CAC payback?
- Who owns the post-click experience?
- What attribution model do you use, and why?
- What happens to our accounts and data if we leave?
Use the answers alongside these red flags, which indicate a lead generation vendor operating under a demand generation label:
- Cost per lead as the headline metric
- No attribution methodology section in the report
- No next-actions section
- No CRM connection, with reporting running on platform data only
- A monthly PDF of platform metrics instead of a live dashboard
- A report that forces you to rebuild the deck from three sources that do not agree
The report ultimately determines whether the agency relationship continues. When you cannot defend the pipeline number in a board meeting without rebuilding the deck yourself, the report has failed its primary purpose.
Demand Generation Agency Reporting Vs Lead Generation Agency Reporting
The table below contrasts the two reporting models across core attributes that decide whether a report can withstand board scrutiny.
| Attribute | Lead Generation Agency Reporting | Demand Generation Agency Reporting |
|---|---|---|
| Headline Metric | MQL volume, cost per lead | Marketing-sourced pipeline, cost per SQL |
| Attribution Model | Last-touch or none documented | Multi-touch, documented with known limitations |
| CRM Connection | Platform data only; no CRM link | CRM-connected; lifecycle stage events feed ad platforms |
| Next-Actions Section | Absent; report is historical | Required; report drives optimization decisions |
Why SaaSHero’s Demand Generation Agency Reporting Is Different
SaaSHero serves as the outsourced inbound growth team for B2B companies, with one team owning strategy and execution across paid media, creative, landing pages, and reporting, and aligning all of it to CRM revenue data instead of form-fill counts. Founded in 2018, SaaSHero has served more than 100 B2B companies. The team manages roughly $16M in annual ad spend, with over $60M lifetime, and includes about 20 full-time specialists such as in-house designers and copywriters. SaaSHero is a Google Premier Partner, a designation held by the top 3% of agencies, and a G2 High Performer in digital marketing for over two years, currently ranked #20 of approximately 6,000 agencies.

SaaSHero’s reporting is CRM-connected by default. Looker Studio and HubSpot dashboards highlight pipeline, CAC, and payback period instead of impressions and clicks. Primary and secondary conversions stay separated in every account. Lifecycle stage events flow back into Google Ads and LinkedIn Ads as conversion actions so the algorithm learns from qualified outcomes. Marketing-sourced and marketing-influenced pipeline appear as separate metrics with agreed definitions documented before the reporting period starts.
The retainer is a flat fee based on total monthly ad spend, so the fee stays the same regardless of channel mix. Channel-mix recommendations and the invoice stay decoupled, which means moving budget from LinkedIn to Google, testing a new channel, or shutting down an underperforming one does not change fees. The client owns all accounts, assets, and files throughout the engagement and at exit, and nothing goes live without client sign-off.
Review Your Reporting With SaaSHero
Frequently Asked Questions
How Often Should A Demand Generation Agency Report Be Delivered?
The cadence section above outlines the full schedule. In summary, weekly updates handle pacing and anomalies, monthly reviews handle pipeline and attribution, and quarterly analysis handles budget allocation, with competitor analysis running monthly.
What Is The Difference Between Demand Generation Agency Reporting And Lead Generation Agency Reporting?
The comparison table above shows the structural differences. Demand generation reporting centers on qualified pipeline, multi-touch attribution, CRM connection, and next actions, while lead generation reporting centers on form fills and cost per lead.
How Do You Report Demand Generation When The Sales Cycle Is Longer Than The Reporting Cycle?
Teams should report on in-flight pipeline, pipeline coverage ratio, and leading indicators instead of waiting for closed revenue. Pipeline coverage ratio, which compares open pipeline to the revenue target, tells the board whether the number is on track before the quarter closes. Leading indicators such as MQL-to-SQL conversion rate and cost per opportunity move inside the reporting cycle and predict closed revenue two to three quarters out. A rolling six-to-twelve-month cohort view, which tags leads by acquisition month and measures pipeline and revenue contribution over that window, captures the contribution of spend that closes outside the current quarter.
What Should A Demand Generation Reporting Template Include?
The nine-section structure above forms the complete template, with two non-negotiables: the executive summary and the next-actions section. The executive summary must lead with the pipeline number and whether it will be hit, written in the CFO’s vocabulary. The next-actions section must specify what is being done, who owns it, and what outcome is expected. The attribution methodology section is the third critical element because it documents the model and its known limitations. The appendix containing platform-reported metrics should be clearly labeled as secondary and should not drive budget decisions.
How Do You Connect Ad Platforms To The CRM For Reporting?
The connection requires four steps:
- Capture the Google Click ID (GCLID) or Microsoft Click ID (MSCLKID) on the landing page and store it against the CRM lead record at form submission.
- Configure lifecycle stage events in HubSpot or Salesforce, such as SQL created, opportunity created, and closed-won, as distinct CRM milestones with timestamps.
- Push those lifecycle stage events back into Google Ads as offline conversion actions using Enhanced Conversions for Leads, and into LinkedIn Ads using the Conversions API, so the algorithm learns from qualified outcomes instead of form fills.
- Build Looker Studio dashboards on top of the CRM so platform-side metrics and CRM-side outcomes sit in one view instead of being reconciled by hand in a spreadsheet each month.
This setup creates a reporting layer where every pipeline dollar traces back to a specific campaign, channel, and ad group, and where the algorithm trains on the outcomes the business cares about.
Conclusion: Build The Report This Week
A report that leads with cost per lead fails to answer board questions, defend the pipeline number, or explain what the spend produced.
A CRM-connected report built on the three-tier metric hierarchy, a defensible multi-touch attribution model, and an ad-platform feedback loop proves pipeline and revenue impact in the vocabulary your CFO already uses. That structure turns the report into the mechanism that drives optimization instead of a document that only records what already happened.
The report structure, questions for your agency, and red flags all appear above. The remaining decision is whether your current agency can deliver this level of reporting or whether you need a team that does it by default.
Start Building Your Board-Ready Report