




Written by: Aaron Rovner, Founder, Saas Hero
Key Takeaways
- The CAC payback period measures how many months it takes for a new customer’s gross profit to recover the fully loaded cost of acquiring them.
- Accurate calculation requires mapping CRM objects and fields in HubSpot or Salesforce to both the fully loaded acquisition cost numerator and the monthly gross margin denominator.
- Common errors such as using revenue instead of gross margin or deal amount instead of MRR can understate payback by 20–40% or more.
- Segmenting payback by channel and cohort reveals which acquisition sources are truly efficient and prevents blended averages from hiding underperforming tactics.
- SaaSHero helps B2B teams build CRM-connected CAC payback reporting that ties paid media spend directly to qualified pipeline and closed revenue.
See How SaaSHero Builds CRM-Connected CAC Payback
Process Overview: Building CAC Payback In Your CRM
This process follows four core steps that work in both HubSpot and Salesforce, with Salesforce adding an attribution configuration step.
- Configure campaign spend tracking on the campaign object.
- Build the deal or opportunity and revenue view, including MRR and gross margin.
- Build the cohort and channel view from those deals or opportunities.
- Calculate payback by cohort and validate against finance records.
Salesforce teams also configure Campaign Influence between steps one and two so campaign costs connect cleanly to revenue.
Which CRM Objects And Fields Feed CAC?
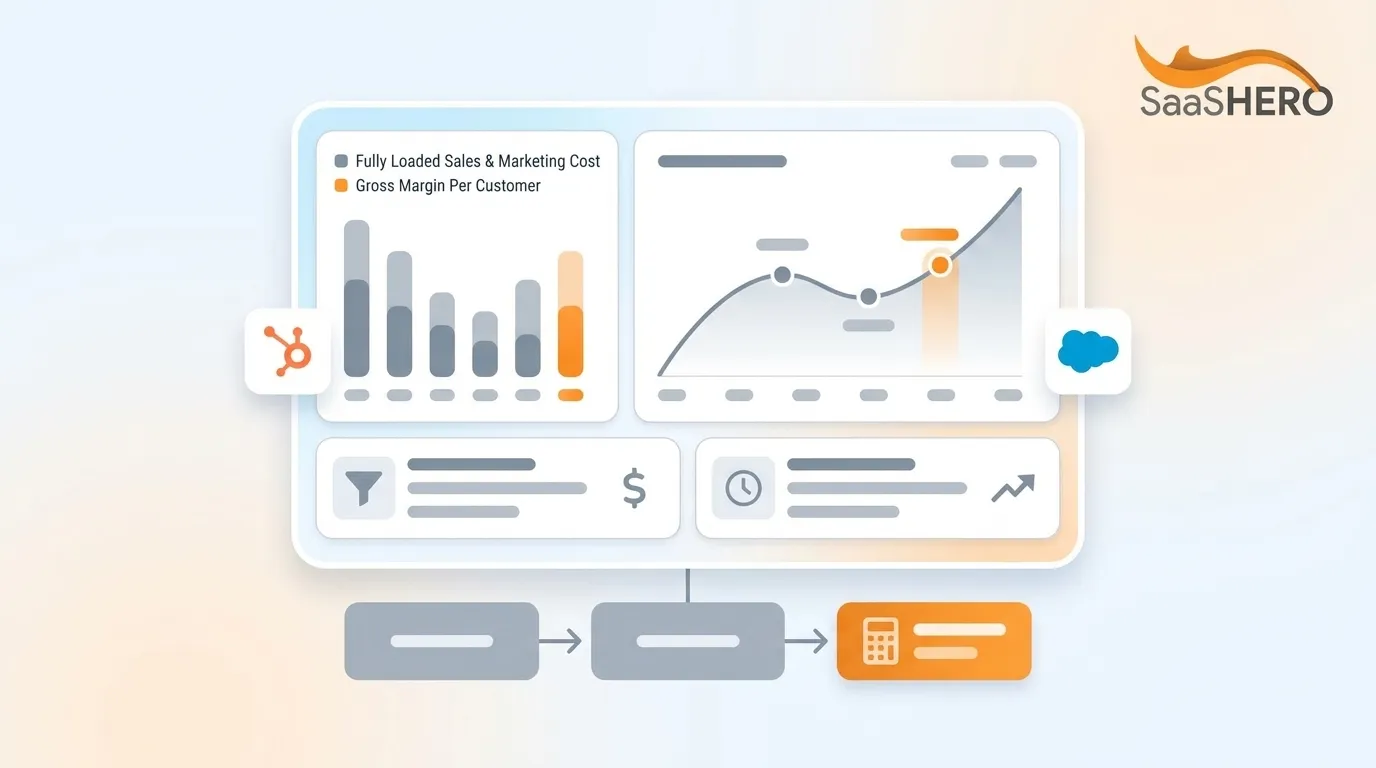
The Numerator: Fully Loaded Sales And Marketing Cost
Customer success, support, and product costs relate to retention, so they sit outside CAC. Reporting paid CAC, or ad spend only, as total CAC is the most common founder error, and the undercount typically runs 2x to 4x. Most acquisition costs live outside the CRM in the general ledger. Campaign spend may live in the CRM, while salaries, tooling, and overhead sit in finance systems. Because of that split, the implementation challenge becomes mapping external costs to CRM records. Teams solve this with custom fields, a connected spreadsheet, or a BI tool that joins CRM and finance data.
The Denominator: Monthly Gross Margin Per Customer
The denominator uses monthly gross margin per customer. Gross margin subtracts cost of goods sold and cost of service, such as hosting, customer support, onboarding specialists, and payment processing, from revenue. At gross margins of 55–65%, which are common for businesses with heavy implementation or professional-services costs, a revenue-based formula can understate real payback by about 40%.
CRM Objects That Hold This Data
- HubSpot: Deals (amount, close date, associated contacts), Campaigns (spend, associated assets), Campaign Members (contacts associated with campaigns).
- Salesforce: Opportunities (amount, close date, stage, primary campaign source), Campaigns (budgeted cost, actual cost, type), Campaign Members (leads or contacts associated with campaigns, response status).
The table below maps each data requirement to its HubSpot and Salesforce equivalent so you can see where each platform stores the fields your payback calculation needs.
| Attribute | HubSpot | Salesforce |
|---|---|---|
| Campaign cost tracking | Campaign Spend property | Budgeted Cost and Actual Cost fields on Campaign object |
| Attribution data source | Contacts, Deals, or Revenue | Campaign Influence, Primary Campaign Source |
| MRR storage | Custom property or external join | Custom field on Opportunity object |
| Cohort reporting | Report Builder with custom grouping | Campaigns with Opportunities report type |
Step-By-Step: How To Calculate CAC Payback Period In HubSpot
Step 1: Configure Campaign Spend Tracking
Purpose: Capture acquisition cost at the campaign level.
Actions: In HubSpot, navigate to Marketing > Campaigns. For each campaign, enter the Spend property. Record paid media spend, agency fees allocated to that campaign, and any directly attributable costs.
Decision Point: Decide whether to track fully loaded costs at the campaign level or allocate them separately. Most teams track media spend in HubSpot and allocate salaries and overhead in a connected spreadsheet or BI tool.
Validation: Confirm that total campaign spend reconciles to your finance records for the same period.
Step 2: Build The Deal And Revenue View
Purpose: Capture the denominator using monthly gross margin per customer.
Actions: Navigate to Reports > Report Builder and select the Deals or Revenue data source. Add properties such as Deal Amount, Close Date, Associated Contact, and any custom property for MRR or Gross Margin.
Decision Point: Confirm whether your HubSpot instance stores MRR. If it does not, create a custom property and populate it via workflow, or join HubSpot data to a billing system export.
Common Mistake: Teams often use Deal Amount instead of MRR. A $50,000 annual contract represents $4,167 in MRR, not $50,000 of monthly revenue.
Step 3: Build The Cohort View
Purpose: Group customers by acquisition month and channel to calculate payback by cohort.
Actions: In Report Builder, create a custom report using the Deals data source. Group by Close Date (month) and Original Source or a custom Channel property. Add calculated fields for MRR and Gross Margin.
Validation: Confirm that the sum of cohort customers equals total new customers for the period.
Step 4: Calculate Payback By Cohort
Purpose: Produce the payback figure for each cohort.
Actions: Export the cohort data or build a calculated field. For each cohort, use this formula: Payback (months) = Total Acquisition Cost for Cohort ÷ (Average MRR per Customer × Gross Margin %).
Validation: Compare the blended payback across all cohorts to your finance team’s calculation. If they differ by more than 10%, investigate the discrepancy before presenting the number.
HubSpot’s campaign ROI report calculates ROI as ((revenue or attributed revenue − campaign spend total) / campaign spend total) × 100, which provides a useful cross-check against your cohort payback calculation.
HubSpot ad campaign reporting can show the number of Closed Won deals associated with attributed contacts, which links acquisition activity directly to revenue and supports your denominator.
SaaSHero’s CAC payback period calculation methodology guide explains the broader methodology decisions behind the number you defend.
Validate Your HubSpot Payback Build With SaaSHero
Step-By-Step: How To Calculate CAC Payback Period In Salesforce
Step 1: Configure Campaign Cost Fields
Purpose: Capture acquisition cost at the campaign level.
Actions: In Salesforce, navigate to the Campaign object and populate the Budgeted Cost and Actual Cost fields for each campaign. Create custom fields such as Agency Cost or Media Spend if you need more detail.
Decision Point: Salesforce Campaigns are available in Professional, Enterprise, Performance, Unlimited, and Developer Editions. Confirm that your edition supports campaign tracking before you invest in this setup.
Validation: Run a Campaigns with Campaign Members report and confirm that cost fields are populated.
Step 2: Configure Campaign Influence
Purpose: Connect campaign touchpoints to opportunities for attribution.
Common Mistake: Campaign Influence attributes revenue only when a Contact Role on the opportunity is also a member of that campaign and the campaign member record was created before the opportunity’s close date. Missing Contact Roles often cause influence reports to show zero revenue.
Troubleshooting: If influence reports show zero, check that Contact Roles are populated on opportunities and that campaign members were added before opportunity close.
Step 3: Build The Opportunity And Revenue View
Purpose: Capture the denominator using monthly gross margin per customer.
Actions: Create a custom report using the Opportunities report type and add fields such as Opportunity Amount, Close Date, Stage, Primary Campaign Source, and any custom MRR or Gross Margin fields.
Decision Point: Salesforce can store MRR through the AssetStatePeriod object’s Mrr field in API version 50.0 and later. If that object is not in use, create a custom field on the Opportunity object and populate it via formula, such as Annual Contract Value ÷ 12, or via integration with your billing system.
Step 4: Build The Cohort And Channel View
Purpose: Group customers by acquisition month and channel to calculate payback by cohort.
Validation: Confirm that the sum of campaign-attributed opportunities reconciles to total closed-won opportunities for the period.
Step 5: Calculate Payback By Cohort
Purpose: Produce the payback figure for each cohort.
Actions: Create a summary formula: Payback (months) = SUM(Actual Cost) ÷ (SUM(Opportunity Amount ÷ 12) × Gross Margin %).
Validation: Compare the result to finance records. Document any variance and its cause before presenting the number to a board or CFO.
SaaSHero’s guide on why your SaaS CAC payback number is probably wrong highlights the most common errors that appear at this validation step.
What To Include In Fully Loaded CAC
Both HubSpot and Salesforce implementations depend on the same definition of acquisition cost, so the numerator needs a clear scope.
Fully loaded CAC includes four cost buckets:
- Paid Spend: Ads, sponsorships, events, and media bought to generate demand.
- People Costs: Salaries, commissions, and bonuses for everyone in sales and marketing, loaded at roughly 1.3x base to cover benefits and payroll tax.
- Tools: CRM, marketing automation, sales engagement, and data enrichment tools.
- Allocated Overhead: The share of general costs those teams consume.
Most of these costs live outside the CRM, so you need a mapping step into CRM records. Teams handle this with custom fields, a connected spreadsheet, or a BI tool that joins CRM data to finance data. Paid-media-only CAC will always come out smaller than fully loaded CAC for the same business, and a payback period built on that smaller number will look healthier than a properly calculated one.
The Methodology Decisions That Change The Number
Gross Margin Vs. Revenue
Using revenue instead of gross margin in the denominator produces a number that can be 20–40% better than cash reality at typical SaaS gross margins. Document the choice and use gross margin consistently so later comparisons stay clean.
Salaries In Or Out
Reporting paid CAC as total CAC creates a 2x to 4x understatement in many sales-led motions, and investors usually correct for that. Include salaries and benefits so the number you present matches what a board expects.
Blended Vs. Cohort
Blended CAC hides which channel or segment actually performs well. A blended figure of $10,200 and 9.0 months can look healthy while an outbound SDR channel runs at $18,500 CAC and 16.4-month payback above target. Report both views, using blended for trend and cohort for decisions.
Why Document The Choice
Inconsistent definitions are a primary reason marketing teams argue about CAC numbers. Document which costs are included, what timeframe you use, and whether you measure blended or segmented CAC, then share that definition with the entire team.
How To Segment CAC Payback By Channel And Cohort
Segmentation turns a single CAC payback number into a tool for budget and channel decisions.
Segment By Channel: Calculate payback separately for paid search, paid social, outbound, referral, and organic. One example shows inbound and organic at $4,200 CAC and 3.7-month payback, partner and referral at $7,400 and 6.6 months, paid search and social at $12,800 and 11.3 months, and outbound SDR at $18,500 and 16.4 months while the blended figure sits at $10,200 and 9.0 months.
Segment By Cohort: Group customers by acquisition month and track cumulative gross profit month by month until it crosses cohort CAC. This cohort walk automatically penalizes channels whose customers churn before recovery, even when a simple formula suggests fast payback.
HubSpot’s attribution reports can be built from Contacts, Deals, or Revenue data sources, which supports cohort-level payback by channel. Salesforce’s Campaign Influence and Einstein Attribution connect campaign spend to influenced pipeline and closed revenue for the same purpose.
SaaSHero’s CAC payback period benchmarks guide provides segment-level context for evaluating whether your channel-level numbers sit on target.
Get Help Segmenting CAC Payback By Channel
Why Your CAC Payback Number Is Probably Wrong
Missing Gross Margin Data: If your CRM does not store gross margin, teams usually fall back to revenue in the denominator, which creates the 40% understatement discussed earlier.
Deal Amount Used Instead Of MRR: A $50,000 annual contract represents $4,167 in MRR. Using the full deal amount as monthly revenue inflates the denominator and shortens apparent payback.
Unallocated Salaries: One founder with a sales-led motion calculated CAC at $410 by dividing ad spend by new logos, while the actual fully loaded cost was around $1,900. Fully loaded CAC often runs far higher than the media-only number most teams report.
Last-Touch Attribution Distorting Channel-Level Payback: In a six-to-nine-month B2B cycle with a buying committee, last-click credits the branded search that happens after the decision is made. The channels that created demand appear weak and lose budget. Multi-touch attribution, such as position-based or time-decay, fits cycles longer than 30 days.
Expansion Revenue Contaminating New-Logo Payback: One company at $24M ARR reported a blended 11-month payback, but when new-logo CAC was isolated against new-logo recognized margin only, new-logo payback stretched to 21 months.
CAC Payback Vs. LTV:CAC Ratio
CAC payback and LTV:CAC ratio describe different aspects of growth economics. CAC payback measures how fast you recover acquisition cost in months, while LTV:CAC measures total lifetime economic return on that spend.
Frequently Asked Questions
How Long Does It Take To Set Up CAC Payback Reporting In HubSpot Or Salesforce?
Standing up a defensible CAC payback calculation from scratch usually takes four to eight weeks. Teams spend one to two weeks agreeing on the CAC definition with finance, two to three weeks getting a true gross margin from cost of goods sold detail, and another one to two weeks building the cohort view and reconciling it against actuals. If MRR or gross margin data does not exist in the CRM, expect extra time for integrations or custom fields. The validation and reconciliation phase often takes the longest because fully loaded sales and marketing expenses from the general ledger must match CRM and billing records.
What Roles Are Required To Build And Maintain This Report?
Three roles support CAC payback reporting over time: a finance partner, a marketing lead, and a sales owner. The finance partner defines metric calculations, provides fully loaded cost data, and validates the output against the general ledger. The marketing lead oversees campaign budgets, channel spend, and channel-level analysis. The sales owner keeps deal economics and pipeline data accurate so the denominator reflects reality.
How Should Teams At The $10M–$50M ARR Range Adapt This Process?
Teams in the $10M–$50M ARR range can treat CRM-native reporting as the target state. The most common gap is MRR data, since many HubSpot and Salesforce instances store only deal amount. Creating a custom MRR field and populating it via formula or billing integration usually comes first. The second gap is gross margin. When CRM does not store it, build a connected spreadsheet that joins CRM cohort data to finance exports. Channel-level segmentation grows more valuable as deal volume and channel complexity increase.
What Are The Common Risks In This Process?
The highest-risk methodology errors include using revenue instead of gross margin in the denominator, excluding sales and marketing salaries from CAC, using deal amount instead of MRR, and relying on last-touch attribution for channel-level decisions. Salesforce teams also face the risk of missing Contact Roles on opportunities, which causes Campaign Influence to show zero revenue. Each of these issues produces a number that looks better than cash reality.
How Often Should The Methodology Be Revisited?
Review CAC payback methodology monthly for operational segment views and quarterly for the board-level number. For most startups, calculate cohort payback quarterly using rolling 3-month or 6-month cohort bases. That cadence smooths monthly volatility. If annual prepay exceeds 30% of new bookings, track both a cash-basis and a revenue-basis payback number because the standard formula uses MRR regardless of how the customer paid. Revisit attribution model configuration on a regular cadence, such as quarterly, and trigger a review whenever a major channel is added or removed, a significant new campaign type launches, or conversion data diverges from business results.
Conclusion: Build The Report On Data You Can Defend
A CAC payback number only works when the underlying CRM data holds up under scrutiny. Many teams report the wrong figure because fully loaded costs live outside the CRM, deal amount stands in for MRR, gross margin data is missing, and last-touch attribution distorts channel-level payback. The steps above show which objects and fields to pull in HubSpot and Salesforce, how to build the cohort report, and which methodology decisions shape the number before you present it.
SaaSHero acts as an outsourced inbound growth team for B2B companies and focuses on CRM revenue data such as qualified pipeline, lifecycle stage, and closed revenue rather than conversion counts from ad platforms. SaaSHero owns the full chain from impression to CRM record across paid media, creative, landing pages and CRO, attribution and reporting, and strategy. The payback number rests on data the same team manages.
SaaSHero’s CRM-connected reporting works in HubSpot, Salesforce, or any CRM that connects ad spend to leads, pipeline, and revenue. Its primary-versus-secondary conversion architecture feeds lifecycle stage events back into ad platforms so algorithms learn from qualified outcomes rather than form fills, which matches the data used in a defensible CAC payback report.
Talk With SaaSHero About Your CAC Payback Reporting