




Written by: Aaron Rovner, Founder, Saas Hero
Key Takeaways
- Large B2B paid media budgets run on four sequential decisions: what the ad platform is trained on, which channel owns which job, where the marginal dollar goes next, and what the CRM says happened.
- Replace CPL with cost per qualified opportunity, pipeline-to-spend ratio, and the contribution formula so ad platforms learn from pipeline, not form fills.
- Separate demand capture (Google Ads, Microsoft Ads) from demand creation (LinkedIn, Meta, Reddit, TikTok) as distinct budget lines with distinct KPIs to judge each channel fairly.
- Use marginal-dollar reviews and incrementality tests to find the efficiency cliff and see where incremental spend stops producing proportional pipeline.
- SaaSHero acts as an outsourced inbound growth team that owns the full chain and keeps reallocation recommendations independent from its fee structure.
See How SaaSHero Runs These Four Decisions
The Four Allocation Decisions Behind Large B2B Paid Media Budgets
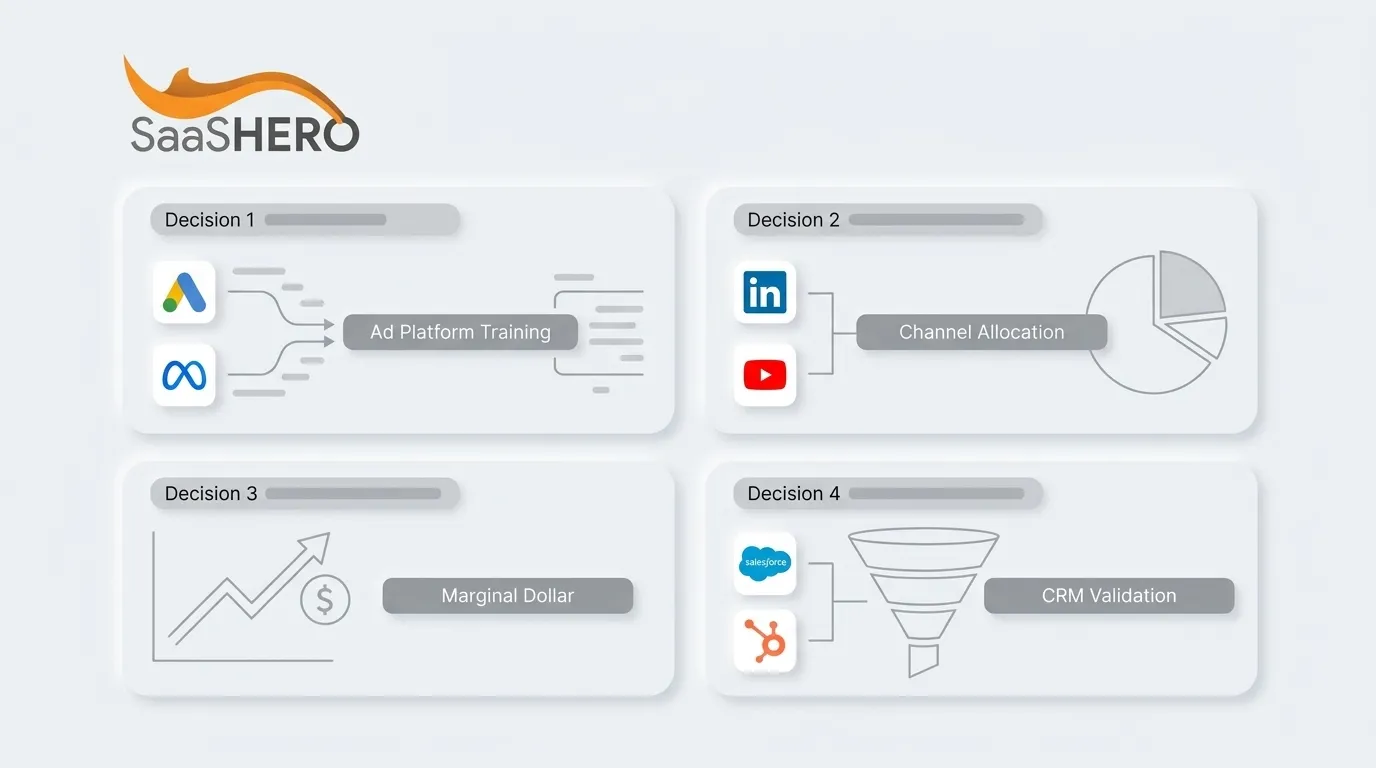
Each decision changes a different part of the system, and together they form a sequence that only works in one direction.
- What the Ad Platform Is Trained On – replacing CPL with cost per qualified opportunity, pipeline-to-spend ratio, and the contribution formula
- Which Channel Owns Which Job – separating demand capture from demand creation as distinct budget lines with distinct KPIs
- Where the Marginal Dollar Goes Next – diagnosing the efficiency cliff and running a marginal-dollar review
- What the CRM Says Happened – making the CRM the source of truth before reallocating a dollar
Decision 1 changes what the algorithm optimizes toward. Decision 2 changes how channels are evaluated. Decision 3 changes where budget moves. Decision 4 determines whether any of the first three decisions can stand up in a boardroom.
Decision 1: What the Ad Platform Is Trained On
CPL breaks at scale because an algorithm pointed at a form fill finds the people most likely to fill in forms, then reports a falling cost per conversion. Students, job seekers, competitors, and existing customers all qualify as conversions in that setup. Replace CPL with cost per qualified opportunity, pipeline-to-spend ratio, and the contribution formula: spend × qualified-opportunity rate × win rate × contribution per win.
The mechanism is self-reinforcing. Google Ads behaves like a self-fulfilling prophecy: feed the machine high-quality data and the account receives high-quality performance. Feed it a newsletter signup or an unfiltered contact form and it faithfully finds more people who do that thing. A B2B cybersecurity company spending $60k per month on paid media, with 85% on LinkedIn lead gen forms, generated 400+ leads per month but only 8 qualified opportunities, a 2% lead-to-opportunity rate that made the program unprofitable. After restructuring around qualified outcomes, lead volume dropped from 400 to 110 per month while qualified opportunities rose from 8 to 20 and cost per qualified opportunity fell from $7,500 to $3,000 within 90 days.
The contribution formula makes comparisons between campaigns with different CPLs straightforward. A channel with a $50 CPL and a 2% opportunity conversion rate produces a cost per opportunity of $2,500, and a channel with a $200 CPL and a 20% opportunity conversion rate produces a cost per opportunity of $1,000. The cheaper lead becomes the more expensive pipeline.
The fix in Google Ads and LinkedIn Ads unfolds in three connected steps. Start by auditing which conversion actions are set to primary, because the algorithm optimizes toward whatever holds that status. Demote every event that is not a qualified opportunity or a lifecycle stage change; content downloads, webinar registrations, and low-commitment form completions belong in secondary tracking, visible but excluded from account-wide optimization. Once the primary set is clean, push lifecycle stage events such as MQL, SQL, opportunity created, and closed won back into the ad platforms via Google Tag Manager and offline conversion imports so bidding learns from qualified outcomes. Then use GA4 and Salesforce or HubSpot to confirm that the signal reaching the auction matches what the CRM records as pipeline.
Decision the Reader Can Make: Clean the primary conversion set in Google Ads and LinkedIn Ads so only qualified opportunities or lifecycle stage changes guide bidding.
Decision 2: Which Channel Owns Which Job
Demand capture on Google Ads and Microsoft Ads and demand creation on LinkedIn, Meta, Reddit, and TikTok function as separate budget lines with separate KPIs. A paid social program judged on last-click demo requests always looks like a failure, while branded search volume often rises after awareness spend on LinkedIn. These channels influence each other and should not be evaluated in isolation.
The channel-to-job mapping below assigns each channel one job and one primary metric so budget lines stay clean. Evaluating demand creation on demand-capture KPIs remains the most common reason a VP of Marketing concludes that LinkedIn did not work.
| Channel | Job | Primary KPI | Failure Pattern |
|---|---|---|---|
| Google Ads | Demand Capture | Cost Per Qualified Opportunity | High-intent terms saturated and incremental spend flows to broad match |
| Microsoft Ads | Demand Capture | Cost Per Qualified Opportunity | Left unmanaged and conversion tracking not configured separately |
| LinkedIn Ads | Demand Creation | Engagement, Audience Build, Branded Search Lift | Judged on last-click demo requests and conversion campaigns run against cold audiences |
| Meta / Reddit / TikTok | Demand Creation | Engagement, Audience Build | Used as default line items instead of where audience and motion justify them |
Channel mix also shifts with GTM motion. B2B SaaS channel allocation by ACV runs roughly 45–55% Google and 30–40% LinkedIn for mid-ACV ($30k–$75k) products, and 30–40% Google and 45–55% LinkedIn for high-ACV ($75k–$150k) products, because at higher deal sizes LinkedIn’s ability to reach a specific buyer persona by title and company outweighs Google’s intent signal. PLG companies tend to stay Google-heavy even at higher ACVs because their motion is signup-driven rather than demo-driven, which reverses the typical high-ACV channel mix.
The spend tier changes the playbook. Below $15k per month, concentrate on one demand-capture channel and prove unit economics before adding demand creation. Above $50k per month, only 3–5% of a B2B SaaS company’s total addressable market is actively shopping at any given time, so investing only in demand capture channels means fishing in a structurally shrinking pond.
Decision the Reader Can Make: Assign each channel one job and one primary metric, and evaluate demand creation on engagement and lift, not on last-click demo volume.
Map Your Channels to Jobs With SaaSHero
Decision 3: Where the Marginal Dollar Goes Next
The efficiency cliff marks the point where incremental spend stops producing proportional pipeline. Diagnose it by checking whether high-intent terms are saturated at the lower budget, whether incremental spend is flowing to broader and worse traffic, and whether efficiency is degrading while the account still appears maintained.
Google’s marketing-saturation-curve framework, published by Michał Protasiuk in April 2026, divides the spend-revenue relationship into five zones: wear-in, acceleration, efficiency, contribution, and saturation, and states that in the saturation zone, further spend destroys value and should be stopped immediately. The practical implication for a $50k-plus per month B2B paid search account is clear. The account was built for a lower budget. High-intent terms were already saturated at that level. Incremental spend now flows to broader match and worse traffic. The buyer experiences this as paid media stopping working. This pattern reflects a structural ceiling.
A marginal-dollar review runs in four steps:
- Pull cost per qualified opportunity by campaign and keyword cluster for the last 90 days from the CRM, not from the platform dashboard.
- Identify which clusters are producing qualified pipeline at or below target and which are producing it above target or not at all.
- Check whether the underperforming clusters are structurally broken, such as wrong audience, wrong page, or wrong conversion event, or simply saturated, with all available high-intent volume already captured.
- Move the next dollar to the channel or cluster with the highest marginal return, not the highest average return. On a saturating response curve, a channel showing a 4.0 average return can easily have a marginal return under 1.0, which means the last tranche of spend is losing money inside a headline that looks excellent.
Incrementality testing on a live account without pausing all campaigns remains possible through geo-holdout and matched-market tests. A geo holdout test requires at least 10–15 matching geographic pairs and a minimum four-week test duration to reach statistical significance at 80% power for most B2B campaigns. The method treats whole geographic regions as the unit of experimentation. Ads keep running in treatment regions and pause in holdout regions, and the team measures the difference in pipeline creation between the two groups. The IAB and IAB Europe formalized the definition of incrementality in a joint paper dated November 3, 2025, defining it as the additional business outcomes directly driven by a campaign compared with what would have occurred without marketing activity.
The efficiency cliff is not the only structural ceiling. The multi-product and multi-segment account problem compounds it. By $50M ARR, most B2B SaaS companies sell more than one product or one product to two or three segments with different buyers, value propositions, and price points, while the paid account was built when there was one product and one message. Budget cannot be allocated by product line, performance cannot be read by segment, and one generic landing page receives traffic from three different intents. Fixing that pattern requires restructuring campaign architecture, not adjusting bids.
Cutting a channel and fixing a channel follow different rules. Cut when the channel’s next dollar produces less pipeline than the next dollar in any other channel, confirmed by an incrementality test. Fix when the channel produces qualified pipeline but the post-click experience or the conversion configuration suppresses it. Audited accounts show cost per qualified opportunity dropping 40% in a quarter purely from rebuilding landing pages, with no change to the media plan.
Decision the Reader Can Make: Run a marginal-dollar review this quarter and document which channel’s next dollar produces the weakest marginal pipeline.
Decision 4: What the CRM Says Happened
Reallocating a large budget intelligently requires treating the CRM as the source of truth. Reconcile ad platform, GA4, and CRM numbers by treating the CRM as authoritative for pipeline and revenue, the ad platforms as authoritative for spend, and GA4 as authoritative for on-site behavior. Then compute cost per qualified opportunity across sources instead of reading it from one.
The numbers disagree for structural reasons. Google Ads, GA4, and CRM systems were built for different jobs, use different attribution models, and measure different moments in the customer journey, so their numbers routinely disagree; the mismatch is structural rather than a tracking bug, though a CRM-connected reporting layer can resolve the discrepancies. Summing all platform-reported conversions routinely produces 150–250% of actual closed customers because Meta defaults to a 7-day click and 1-day view window, Google defaults to a 30-day click window, and LinkedIn uses its own rules, so a single buyer touching multiple platforms is counted as a conversion by each.
In a six-to-nine-month B2B sales cycle with a buying committee, last-click attribution assigns the conversion to a branded search that happened after the buyer was already convinced. In 6sense’s 2025 study of nearly 4,000 B2B buyers, the average buying cycle lasted 10.1 months, buyers first contacted sellers at 61% of the journey, and the winning vendor was already on the Day One shortlist in 95% of purchases. Every budget decision made on last-click data at this scale defunds the top of the funnel and then quietly starves the bottom of it two quarters later. Multi-touch attribution aligns with how long B2B cycles actually work.
Boards and CFOs evaluate channels on a specific set of metrics. They look at CAC, CAC payback, LTV:CAC, pipeline coverage, and cost per qualified opportunity. A CAC payback period under 12 months is considered strong for SaaS. LTV:CAC of 3:1 is generally considered healthy for SaaS. These metrics connect directly to CRM data and support defensible allocation decisions.
The weekly reconciliation report that makes reallocation defensible shows four things side by side: ad platform spend by channel, platform-reported conversions by channel, CRM-verified conversions by channel, and the variance between platform and CRM numbers. A variance threshold of 15% between platform-reported conversions and CRM-verified conversions is the recommended trigger for a structured investigation. Salesforce or HubSpot serve as the CRM source of truth, Looker Studio powers the dashboard, GA4 tracks on-site behavior, and Google Tag Manager manages conversion tracking configuration.
Decision the Reader Can Make: Stand up a weekly reconciliation report that shows spend, platform conversions, CRM conversions, and variance for every channel.
Why Universal Budget Splits Fail at Scale
With the four decisions in place, the next step is deciding how to split the budget itself. Universal percentage rules provide a starting heuristic for companies just entering paid media, but they do not replace marginal-return analysis for teams already spending at scale.
The 70-20-10 rule allocates 70% to proven strategies, 20% to emerging channels, and 10% to experiments. The 40/40/20 rule allocates 40% of budget to your best-proven channel, 40% to a secondary proven channel, and 20% to testing new channels or formats. The 50/30/20 budget rule allocates 50% of after-tax income to needs, 30% to wants, and 20% to savings and goals. These ratios help frame early decisions but do not function as an operating model for a mature program.
At scale, the split should follow the marginal return on the next dollar in each channel. Growth-stage B2B SaaS companies often split roughly 60% toward demand creation and 40% toward demand capture within the demand gen budget, and that ratio shifts with ACV, GTM motion, category maturity, and how saturated the existing demand-capture channels already are. The ratio becomes an input to the marginal-dollar review, not a replacement for it.
How to Run the Quarterly Allocation Review
The quarterly allocation review operationalizes the four decisions on a fixed cadence. Run the review in sequence: CRM pipeline by channel first, then cost per qualified opportunity, then marginal return by channel, then the reallocation decision, then the test queue for next quarter.
The sequence matters because each step depends on the one before it. Pipeline by channel establishes which channels are producing qualified outcomes. Cost per qualified opportunity normalizes for volume differences. Marginal return identifies where the next dollar should go. The reallocation decision follows from the data in that stack. The test queue ensures the next quarter’s review has new information to work from.
A recommended review cadence runs weekly for performance updates, bi-weekly for strategy calls, monthly for competitor analysis, and quarterly for budget analysis. When the sales cycle is longer than the reporting cycle, pipeline creation becomes the primary metric until cohorts mature. Leading indicators matter in this setup. If demo requests drop 20% week over week, pipeline drops 20% inside six weeks and revenue drops 20% inside 16 weeks.
Why SaaSHero Is Built Around These Four Decisions
Allocation breaks when responsibility splits across too many parties. The agency running the ad account often cannot change the landing page headline, cannot change what the CRM counts as qualified, and is paid per channel, which makes reallocation the recommendation its pricing discourages. SaaSHero operates as an outsourced inbound growth team that owns the whole chain.
Founded in 2018, SaaSHero has spent more than eight years in the category, has served more than 100 B2B companies, and manages roughly $16 million in annual advertising spend, with more than $60 million over its lifetime. The team includes about 20 full-time specialists, including in-house designers and copywriters, and does not outsource execution. SaaSHero is a Google Premier Partner, a designation held by the top 3% of agencies, and has been a G2 High Performer in the Digital Marketing category for over two years, currently ranked #20 of approximately 6,000 agencies.
The commercial model uses a flat monthly retainer indexed to total monthly ad spend under management rather than channel count. Moving budget from LinkedIn to Google, opening a Meta test, or shutting a channel down does not change client fees and does not increase SaaSHero’s revenue. The reallocation recommendation and the invoice stay structurally decoupled. Growth Team starts at $4,000 per month, the floor of a scale that rises with total monthly spend under management.
The five capability areas, paid media, creative, landing pages and CRO, attribution and reporting, and strategy, are delivered as one team on one accountability line. The client owns all accounts, assets, and files throughout the engagement and at offboarding. The operating commitment is direct: “We don’t need to be managed. That’s the point.”
Decision the Reader Can Make: Ask any agency you are considering whether their fee changes when the channel mix changes and whether the person who pitched you will still be in the account in month seven.
Talk With SaaSHero About Your Allocation Model
Frequently Asked Questions
What Is the Difference Between Demand Capture and Demand Creation in a B2B Paid Media Budget?
Demand capture targets people who have named their problem and are typing it into a search box, so Google Ads and Microsoft Ads serve as the primary channels. Demand creation targets people who have the problem but have not named it, which makes LinkedIn, Meta, Reddit, and TikTok the main options. These motions sit in separate budget lines with separate KPIs. A demand creation program judged on last-click demo requests will always look like a failure because that metric belongs to demand capture. The second-order effect of demand creation is that it raises branded search volume on Google, which means a paid social program that looks unprofitable on its own last-click numbers may be the reason the demand-capture channel performs at all.
How Do I Know If I Have Hit the Efficiency Cliff on Paid Search?
Three signals usually appear together when an account hits the efficiency cliff. High-intent terms are saturated at the current budget level. Incremental spend flows to broader match and worse traffic. Efficiency degrades while the account structure still looks intact. The diagnostic is a marginal-dollar review that pulls cost per qualified opportunity by campaign and keyword cluster from the CRM and identifies where the next dollar produces less pipeline than the last. Confirm the finding with a geo-holdout or matched-market incrementality test before cutting. A performance dip can also come from creative fatigue, landing page issues, or conversion configuration problems, and each of those patterns has a different fix.
Why Do My Ad Platform, GA4, and CRM Numbers Never Match?
These systems were built for different jobs, use different attribution models, and measure different moments in the customer journey. The mismatch is structural. As noted earlier, platform-reported conversions routinely exceed actual closed customers by 150–250%. GA4 counts every form event including spam and bot traffic, while the CRM records only validated contacts. Ad platforms backfill conversions retroactively as attribution windows close, so recent periods remain provisional. The correct approach treats the CRM as authoritative for pipeline and revenue, the ad platforms as authoritative for spend, and GA4 as authoritative for on-site behavior, then computes cost per qualified opportunity across sources. A weekly reconciliation report showing all three side by side, with variance flagged above 15%, forms the minimum viable measurement discipline for a budget above $50k per month.
What Metrics Should I Report to My Board Instead of CPL?
Report CAC, CAC payback, LTV:CAC, pipeline coverage, and cost per qualified opportunity. These metrics match how a CFO and board evaluate channels and they are answerable from a CRM-connected reporting stack. Net revenue retention above 100% also matters because growth from the existing base changes the unit economics of acquisition spend. Pipeline coverage, the ratio of qualified pipeline to the committed revenue target, acts as the forward-looking metric that tells the board whether the current quarter’s number is achievable. Reporting this set requires CRM-connected dashboards in Looker Studio or HubSpot, not a monthly PDF of platform metrics.
When Should I Cut a Channel Versus Fix It?
Cut a channel when its next dollar produces less pipeline than the next dollar in any other channel and an incrementality test confirms the finding. Platform performance dips alone do not qualify because attribution systematically over-credits bottom-of-funnel channels and under-credits upper-funnel ones. Fix a channel when it produces qualified pipeline but the post-click experience or the conversion configuration suppresses it. A landing page rebuild or a conversion hierarchy correction, such as demoting secondary conversions from primary status in Google Ads or LinkedIn Ads, can move cost per qualified opportunity significantly without changing the media plan. The most common misdiagnosis cuts a demand creation channel because it fails on demand-capture KPIs. LinkedIn judged on last-click demo requests looks like a candidate for cuts, while judged on branded search lift, multi-touch pipeline influence, and audience build for the conversion stage, it often underwrites the performance of demand capture.
Review Your Channels With SaaSHero