




Written by: Aaron Rovner, Founder, Saas Hero
Key Takeaways
- Standard attribution models overstate ABM ROI by up to 40% because they measure correlation rather than causation, so control-group testing becomes essential for credible CFO reporting.
- A matched control group of non-treated accounts isolates incremental revenue and converts ABM correlation into a defensible causal claim.
- Incremental ROI uses the formula (ABM group revenue minus control group revenue) divided by marketing investment, which produces a transparent figure that survives finance scrutiny.
- Three pipeline numbers must be reported separately: sourced, influenced, and incremental, so ABM results stay credible with CFOs and boards.
- SaaSHero helps B2B SaaS companies measure true incremental ABM ROI by tying programs to CRM revenue data and instrumenting holdouts at program launch.
Talk With SaaSHero About ABM Measurement
Why Attribution Alone Overstates ABM ROI: The Influenced-Pipeline Trap
The core question in every serious ABM post-mortem is, “How do you know it was not going to close anyway?” Attribution cannot answer that question.
When five campaigns touch a $1M deal, every one can claim credit. A LinkedIn ad, a Demandbase display impression, an SDR sequence, a webinar, and a branded search click all appear in the log. Influenced pipeline is defined as opportunity value where marketing engaged any buying-group member during the cycle, and that definition is deliberately broad. A single ad exposure to a single contact qualifies. An unlabeled “70% influenced” claim presented to a CFO destroys the report’s credibility, because finance cannot see whether the program moved the deal or simply appeared near it.
As noted in the Key Takeaways, attribution models often overstate marketing impact by up to 40%, particularly for lower-funnel or retargeting tactics. They measure correlation, meaning which channels were present when a conversion happened, without answering the counterfactual of whether removing those channels would have changed the outcome. On eBay’s own paid search data, the standard observational method estimated a 4,100% return on non-brand search, while a controlled experiment on the same data estimated minus 63%.
Conflating sourced pipeline, influenced pipeline, and incremental pipeline into a single “marketing pipeline” number inflates ABM ROI and then invites finance to discount it. Sourced pipeline suits CFOs and boards for budget allocation decisions, while influenced pipeline suits CROs and program leads for program effectiveness. These metrics answer different questions and must remain separate. For implementation guidance on separating these attribution layers, see ABM Campaign Multi-Touch Attribution: Implementation Guide.
How To Build A Control Group For ABM Measurement
A control group converts an ABM correlation into a causal claim that finance can trust. Without a control group of non-target accounts, every ABM number reported is unfalsifiable and cannot prove lift.
The design principle stays simple. Identify accounts that fit the ICP but do not receive the ABM treatment. Measure them on the same cadence as the ABM group and compare outcomes. Match the ABM pilot and control groups on firmographics, segment, and geography, and keep list size within 20% between the two groups.
The matching variables that matter most are:
- Industry and sub-vertical
- Company size (headcount band and revenue band)
- Technology stack (especially tools that signal buying readiness)
- Geography and seasonality exposure
- Prior engagement history with the company
Tomba’s 2026 framework recommends sizing the control group at 30–50% of the target list, matched on firmographics, and freezing cohorts so accounts cannot be added mid-quarter. The Starr Conspiracy recommends holding out 10% of Tier 2 accounts from treatment for two quarters, then comparing against treated accounts on opportunity creation and win rate. That approach gives a practical starting point when teams cannot afford to withhold a larger segment.
The metrics to compare across both groups are opportunity creation rate, win rate, average deal size, and sales-cycle length. ABM-targeted accounts close at a median win rate of 38% for 1:1 programs versus a 9% non-ABM B2B baseline. That benchmark only holds when the control group stays constant and receives the existing marketing motion. The control group must receive the company’s existing marketing motion rather than a degraded one, so measured differences reflect the ABM treatment rather than a worse baseline experience.
Demandbase’s baseline-before-launch guidance and Forrester’s ABM measurement research both frame the pre-program baseline as a non-negotiable prerequisite. Export a date-stamped baseline from the CRM before any new program goes live. Without that baseline, finance will not accept a before-and-after comparison.
One design failure appears frequently. The most common measurement failure is quietly moving accounts out of the holdout when they start showing intent, which guarantees the ABM group outperforms and guarantees the result is meaningless. Flag control accounts in the CRM at program launch and leave the flag untouched.
How To Calculate Incremental ABM ROI With A Simple Example
Once a matched control group exists, the incremental ROI calculation replaces the standard formula with one that isolates what ABM actually caused.
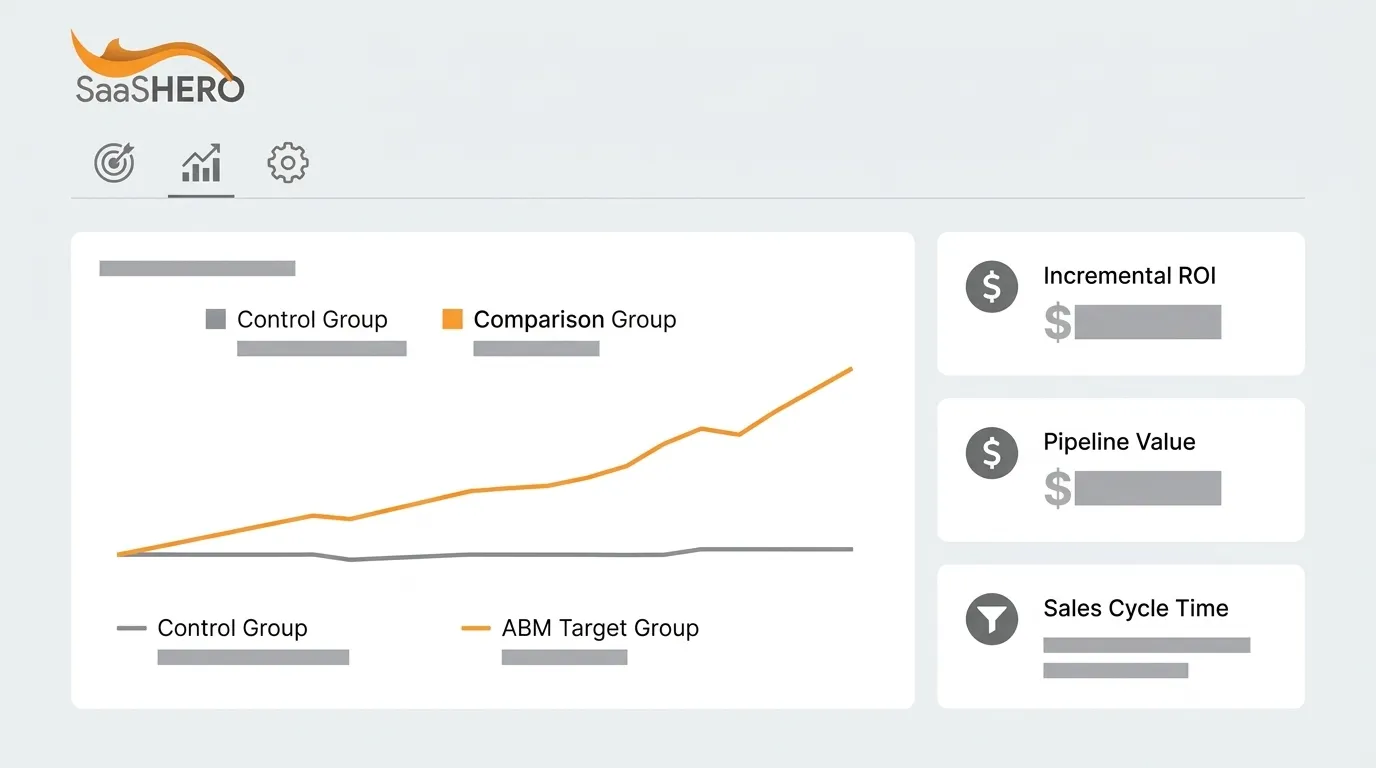
Incremental ROI = [(Revenue from Test Group − Revenue from Control Group) / Marketing Investment] × 100, where the test group is the ABM group and the control group represents expected revenue without ABM.
Expected revenue without ABM comes from the control group’s per-account revenue over the same window. Consider this simple example.
- ABM group: 200 accounts producing $2.4M in closed revenue
- Matched control group: 200 accounts producing $1.5M in closed revenue
- ABM investment: $400K (platform fees, paid media, content, headcount allocation)
- Incremental lift: $2.4M − $1.5M = $900K
- Incremental ROI: $900K ÷ $400K = 225%
That 225% figure stands up in a CFO review because the methodology stays visible and the counterfactual is explicit. A standard attribution report with a similar headline number cannot withstand the same scrutiny.
The calculation only works when you measure the right metric at the right time. Measurement should follow a phase-based ladder that aligns each metric to the point in the program where it can actually be read. 6sense’s engagement, pipeline, revenue, and coverage metric set maps to this sequence:
- Engagement Phase (Months 1–3): Account engagement depth, buying-group reach, coverage rate, and multi-stakeholder touch frequency. These metrics act as leading indicators rather than revenue claims.
- Pipeline Phase (Months 3–6): Opportunity creation rate in targeted accounts versus control, meeting acceptance rate, and pipeline per target account versus the control baseline.
- Financial Return Phase (Months 6–12+): Win-rate delta, average deal size delta, sales-cycle compression, incremental ROI, and CAC payback on ABM investment.
A defensible ROI analysis requires six to nine months, with tracking starting at program launch and ROI reporting beginning at month six. Reporting incremental ROI before the sales cycle has completed produces noise rather than insight.
A lift result is the only slide in the deck the CFO cannot argue with. That result holds only when the holdout design is documented before the program starts, not reconstructed after the results appear.
See How SaaSHero Sets Up Holdout Testing
The Three Pipeline Numbers To Report Separately
Every ABM program produces three distinct pipeline figures. Presenting them as one number is the single most common reason ABM ROI reports lose credibility with finance. Each belongs on its own line, with its own definition stated in the deck. The table below shows how each figure is defined, what question it answers, and which stakeholder trusts it most, with only the incremental figure providing a causal view.
| Pipeline Type | Definition | What It Answers | Who Trusts It |
|---|---|---|---|
| ABM-Sourced Pipeline | Opportunity value where marketing generated the first touch leading to opportunity creation (first-touch attribution) | Did ABM open the door? | CFOs and boards, because it is the most conservative and hardest to manipulate figure |
| ABM-Influenced Pipeline | Opportunity value where marketing engaged any buying-group member during the cycle (multi-touch attribution, typically a 90-day lookback through close) | What was ABM’s full footprint on deals in motion? | CROs and program leads, who use it for program effectiveness rather than budget allocation |
| Incremental Pipeline / Revenue | ABM list performance minus control group performance, representing revenue that would not have occurred without the ABM program | Did ABM cause revenue? | Finance and PE operating partners, because it is the only causal figure and requires a holdout group |
Reporting only sourced pipeline under-credits an ABM program, while reporting only influenced pipeline over-credits it. The correct presentation leads with sourced as the conservative floor, shows influenced as program context, and anchors the causal claim in the incremental figure derived from the holdout comparison.
Most ABM attribution conflict is simply a marketing team presenting an influenced figure into a room that is mentally expecting a sourced one. Defining each term in writing, in the footer of every reporting deck, prevents that argument from starting.
How To Report ABM ROI To A CFO Or Board
Finance leaders evaluate marketing programs on unit economics, not engagement scores or impression share. They apply the same lens they use for every capital allocation decision: CAC payback, pipeline coverage, and incremental lift.
Translating ABM results into that language requires three conversions.
- CAC Payback: Divide fully loaded ABM program cost (platform fees, paid media, content production, headcount allocation) by the gross margin generated from ABM-sourced closed revenue. Under 12 months is the industry standard for strong CAC payback in SaaS, and LTV:CAC of 3:1 is the widely cited healthy benchmark. Present ABM’s payback against those thresholds.
- Pipeline Coverage: Report the ratio of ABM-sourced pipeline to the sales target it supports. This coverage ratio gives finance a forward-looking view of whether the program generates enough qualified opportunity to hit the number.
- Incremental Lift: Present the holdout-derived revenue delta as causal evidence. Finance leaders think in pipeline, cost per opportunity, and time-to-payback rather than lift percentages. Frame the incremental figure as incremental pipeline generated per dollar of ABM investment.
Pre-walking the ROI model with the CFO’s finance team (head of FP&A or a senior finance partner) before the formal CFO meeting, sharing the model so finance can audit the formulas and surface objections offline, is a key preparation step in ValueNova’s CFO-ready business case guidance. A CFO who has already seen the methodology spends the meeting on decisions rather than on re-litigating the math.
When To Judge ABM ROI
The evaluation window must align to the sales cycle rather than the reporting calendar. The median time from ABM program launch to first ABM-sourced qualified opportunity is 118 days. Judging the program at 60 days produces a confident wrong answer.
Before closed revenue exists, three leading indicators signal whether the program is working.
- Account Engagement Depth: Multi-stakeholder, multi-touch activity across at least two buying-group members per account. A drop in engagement metrics predicts a pipeline drop 60–90 days out, which makes this the earliest reliable warning signal.
- Meeting Acceptance Rate: The share of outreach to target accounts that results in a confirmed first meeting. Median ABM programs book 9.4 first meetings per 100 named accounts per quarter, which provides a reference point for early-stage momentum.
- Opportunity Creation Rate In Targeted Accounts Versus Control: The earliest pipeline signal that can be compared against the holdout group. ABM teams should expect 6–9 months before win-rate deltas are statistically meaningful, and should report leading indicators in months 1–5 while explicitly saying so.
Communicating the measurement timeline to stakeholders before the program launches keeps a working program from losing budget during a slow month.
Frequently Asked Questions About ABM ROI Measurement
How Do You Measure ABM Success?
Teams measure ABM success by comparing named target accounts against a matched control group on four outcome metrics: opportunity creation rate, win rate, average deal size, and sales-cycle length. The delta between the ABM group and the control group on each metric represents the program’s measurable contribution. Leading indicators such as account engagement depth, buying-group reach, and meeting acceptance rate provide earlier signals before closed revenue accumulates. A program showing no win-rate lift after four quarters typically has an account selection problem rather than a creative problem.
What Is Influenced Pipeline And Why Does It Overstate ABM ROI?
Influenced pipeline is the dollar value of opportunities where marketing engaged any buying-group member at any point during the sales cycle. The definition stays intentionally broad, so a single ad impression to a single contact qualifies. Because ABM programs run concurrent with other marketing motions, influenced pipeline can claim credit for deals that would have closed regardless of the ABM program. When five campaigns touch the same deal, all five can report it as influenced, which produces a total influenced figure that exceeds the deal’s actual value.
Influenced pipeline works well as a program-effectiveness metric for internal review. It does not make a causal claim and should never appear in a finance deck as evidence that ABM caused revenue. Sourced pipeline, based on first-touch attribution, and incremental pipeline, based on holdout-derived lift, are the figures that survive CFO scrutiny.
How Long Before ABM ROI Can Be Measured?
Leading indicators typically become visible within the first 30–60 days. These include account engagement depth, such as repeat visits and high-intent page activity, and buying-group reach, meaning multiple distinct contacts per account. Target-account coverage often reaches 30–60% within the first quarter.
Pipeline effects, meaning opportunity creation rate in targeted accounts versus control, typically emerge at the 3–6 month mark. Win-rate delta and average deal size lift require at least one full sales cycle of closed deals to stabilize. For mid-market and enterprise B2B SaaS, that window typically spans 9–18 months, with mature-program benchmarks citing 12–18 months.
Full incremental ABM ROI, holdout-validated with closed revenue in both the ABM and control groups, typically requires 9 to 18 months of program history. Most programs show closed revenue in months 9 to 12, and win-rate and closed-revenue comparisons need the full 9 to 18 months. Evaluating ABM ROI at 60 or 90 days against a sales cycle measured in months produces a false negative and often causes working programs to lose budget.
What Is A Good ABM ROI?
Median ABM ROI is 3.4 times program spend over 12 months for programs past 18 months in market, calculated as closed-won revenue divided by total program cost. Programs under 18 months typically run lower as the investment compounds.
On a unit-economics basis, ABM investment should produce a CAC payback under 12 months and an LTV:CAC ratio of at least 3:1. Finance applies these same thresholds to every other growth investment. An ABM program counts as a winning program when its payback period is under four quarters and it shows a meaningfully higher win-rate lift over a defensible control group. No specific incremental lift percentage defines success.
The more important question focuses on whether the ROI number is defensible. A holdout comparison provides that defensibility, while an attribution-only model cannot establish causation.
Conclusion: Make ABM ROI Measurable
The gap between what ABM programs report and what finance accepts comes from methodology rather than performance. Attribution tells you who touched the deal. Incrementality tells you whether ABM caused revenue.
Building a matched control group, calculating incremental ROI against it, and reporting sourced, influenced, and incremental pipeline on separate lines creates a measurement design that survives a CFO review. This approach answers the counterfactual question that attribution alone cannot address.
SaaSHero serves as the outsourced inbound growth team for B2B SaaS companies, tying programs to CRM revenue data such as qualified pipeline, lifecycle stage, and closed revenue rather than form-fill counts. With over $60M in ad spend managed for B2B SaaS companies and Google Premier Partner status, the team owns strategy, execution, and measurement across paid media, creative, landing pages, and reporting as one accountable unit. That measurement layer makes incremental ABM ROI calculable. When the CRM is the optimization target and the holdout is instrumented at program launch, the numbers finance needs appear as a byproduct of how the program runs, rather than as a scramble the week before the board meeting.
Schedule An ABM ROI Review With SaaSHero