

Written by: Aaron Rovner, Founder, Saas Hero
Key Takeaways
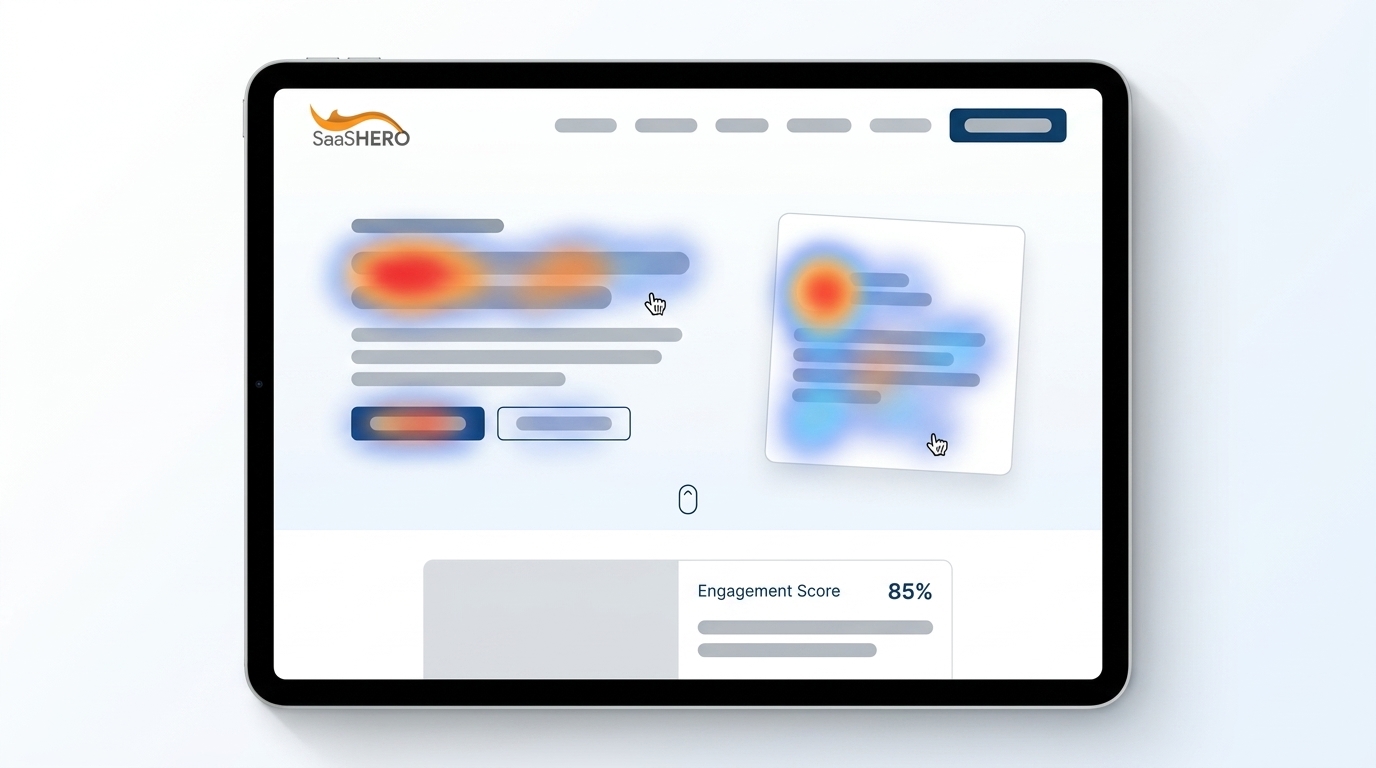
- Landing page heatmap analysis with free tools like Microsoft Clarity reveals hidden friction points such as rage clicks, dead clicks, and scroll drop-offs that hurt B2B SaaS conversions.
- Four core heatmap types (click, scroll, move, and session recordings) expose ignored CTAs, mobile fold issues, and hesitation patterns that drive high CAC.
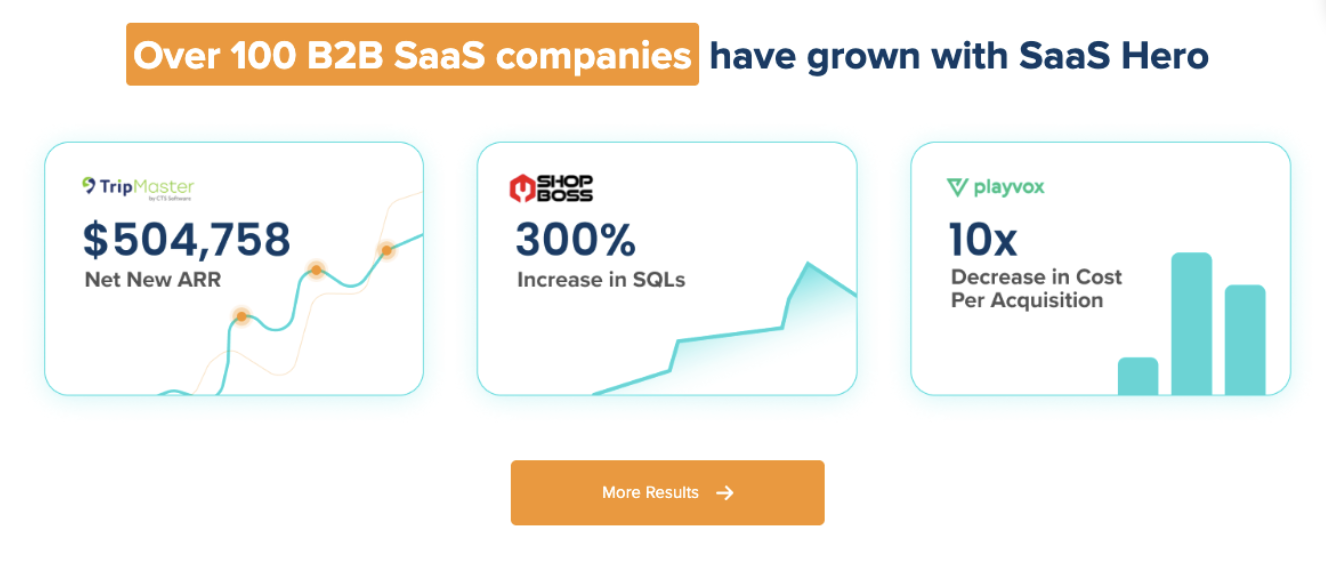
- SaaSHero’s 5-step framework (setup, collect, analyze, prioritize, test) plus seven proprietary heuristics has produced 20% conversion lifts and $504k ARR gains.
- Segment heatmaps by device and traffic source to close the 83% mobile traffic gap where desktop converts about 8% better, then prioritize fixes like CTA repositioning.
- Turn heatmap insights into revenue growth by requesting a complimentary heuristic audit of your landing pages from SaaSHero.
Executive Summary: Core Concepts & 5-Step Heatmap Analysis Framework
Before you can fix conversion problems, you need to see where users struggle on your SaaS landing pages. Four essential heatmap types work together to expose different friction points that block conversions.
- Click heatmaps: Reveal ignored demo CTAs, rage clicks, and dead clicks on non-clickable pricing elements.
- Scroll heatmaps: Highlight fold drops where many mobile users stop before reaching CTAs.
- Move heatmaps: Show hesitation zones and reading patterns and work best as supporting evidence.
- Session recordings: Add full context for heatmap patterns by showing complete user journeys.
The SaaSHero 5-step framework turns this behavioral data into specific, revenue-focused improvements.
- Setup: Install Microsoft Clarity on high-traffic, conversion-focused pages. The 2026 AI updates come free.
- Collect: Capture enough sessions over time to see stable, reliable patterns.
- Analyze: Apply SaaSHero’s seven heuristic principles to pinpoint friction.
- Prioritize: Rank issues by impact on conversion proximity and ease of change.
- Test: Validate changes with A/B testing and expand winning variants with expert support.
Mobile-Heavy B2B SaaS Traffic and What It Means for Heatmaps
B2B SaaS marketing sends high-intent traffic from Google and LinkedIn conquesting campaigns straight to focused landing pages. Yet 83% of landing page visits occur on mobile devices while desktop converts about 8% better, which creates a clear performance gap.
Most agencies still chase surface metrics like click-through rate and ignore deeper conversion behavior that heatmaps expose. SaaSHero connects GCLID data to CRM records so ad clicks tie directly to closed-won revenue and Net New ARR, not just form fills.

The mobile and desktop gap represents a large, often untapped opportunity. Mobile visitors usually convert worse than desktop visitors because of friction that hides in aggregate analytics but stands out in device-segmented heatmaps.
Legacy heatmap setups blend all traffic into a single view, which hides these differences. SaaSHero’s heuristic framework flags “relevance killers” before data collection, such as hero CTA mismatches, form friction, and weak trust signal placement that standard tools overlook.
Key Strategic Decisions & Trade-Offs in SaaS Landing Page Optimization
Strategic heatmap analysis depends on a few critical choices that shape both conversion impact and team workload.
Free vs. Paid Tools: Microsoft Clarity offers robust click, scroll, and frustration signal tracking at no cost. Premium tools like Hotjar add deeper segmentation. For most B2B SaaS teams, Clarity’s 2026 AI anomaly detection gives enough insight for the first optimization cycles.
Desktop vs. Mobile Prioritization: Mobile brings most of the traffic, while desktop often wins on conversion rate. Device-level heatmaps reveal very different interaction patterns that a blended view hides.
Aggregate vs. Segmented Analysis: Single, blended heatmaps mask behavior differences across traffic sources, user types, and devices. Effective analysis segments by UTM parameters, first-time versus returning visitors, and funnel stage.
Quick Insights vs. Deep Analysis: Heatmaps quickly show where friction occurs but not why it happens. Combining heatmap data with heuristic analysis produces stronger insights. Among the friction points this combined approach reveals, scroll depth issues often deliver the largest conversion gains.
Sharp scroll drop-offs before CTAs usually signal placement or layout problems rather than weak intent, which creates fast opportunities for improvement.
Modern Heatmap CRO: Current Approaches and Emerging Practices
Modern heatmap workflows blend several data sources into a single conversion strategy. Teams usually start with Microsoft Clarity for free heatmaps, then layer Hotjar or similar tools for richer session recordings.
New AI features in Clarity’s 2026 release automatically flag anomalous behaviors, including frustration clicks and non-responsive interactions that signal user confusion. These alerts speed up the discovery of high-priority friction.
SaaSHero’s methodology combines seven proprietary heuristics with heatmap data to unlock quick wins. That approach helped Playvox achieve a 10x decrease in cost per lead after restructuring accounts and removing specific friction uncovered in their heatmaps.

Effective heatmap implementation usually follows a few core practices:
- Segment data by device type and UTM source.
- Pair heatmap findings with A/B tests to confirm impact.
- Focus on high-intent pages such as pricing and demo request forms.
- Filter out internal traffic and bots.
- Track trends over time instead of relying on one snapshot.
Advanced teams connect heatmap behavior to CRM outcomes so they can see which patterns correlate with closed-won deals and then prioritize those behaviors.
Practical 5-Step SaaS Heatmap Implementation Guide
Most B2B SaaS teams start by simply viewing heatmaps without acting on them. With a structured process, you can reach integrated A/B testing within about 90 days. The five steps below guide that progression.
Step 1: Install Clarity on High-Traffic Pages
Start with landing pages that receive paid traffic, pricing pages, and demo request forms. Avoid a sitewide rollout at first and focus tracking on the pages that drive pipeline.
Step 2: Collect Sufficient Data
Wait until you have enough sessions to see stable patterns. Early analysis with thin data often leads to decisions based on noise instead of signal.
Step 3: Apply SaaSHero Heuristics
Run an expert heuristic review before diving deep into the heatmaps. This qualitative pass often uncovers quick wins that do not require long data collection windows.
Step 4: A/B Test Priority Fixes
Turn heatmap and heuristic findings into testable hypotheses. Start with high-impact, low-effort changes such as CTA repositioning, form field reduction, and stronger trust signal placement.
Step 5: Scale with Expert Partners
Advanced optimization relies on B2B SaaS conversion psychology and technical depth. Talk with SaaSHero about a month-to-month optimization program that scales your winning tests and builds a repeatable CRO engine.
Assess your readiness by reviewing how well you connect marketing data to pipeline. Teams that already track GCLID into the CRM can measure how heatmap-driven changes affect real revenue.
Common Pitfalls & Diagnostic Checks for Click Heatmaps
Most failed heatmap projects come from misreading the data or applying it too broadly.
Critical Pitfalls to Avoid:
- Ignoring the mobile majority discussed earlier.
- Reviewing too few sessions, which creates misleading patterns.
- Skipping segmentation by traffic source, device, and user type.
- Assuming red areas always indicate success when they may reflect design flaws.
- Chasing cold spots instead of addressing clear frustration signals.
Diagnostic Questions for Friction Identification:
- Do demo CTAs appear as cold zones even with high-intent traffic?
- Do users scroll past the fold to reach key conversion elements?
- Do frustration clicks cluster around specific non-interactive elements?
- Do mobile and desktop heatmaps show very different engagement patterns?
SaaSHero’s structured use of these questions helped Playvox isolate and remove the exact friction points behind their 10x cost per lead improvement.
SaaS Team Archetypes: Real-World Heatmap Use Cases
Different SaaS team structures need different heatmap workflows and support levels.
Bootstrap Founder: Limited resources require maximum value from free tools. Microsoft Clarity plus SaaSHero’s $1,250 monthly audit can drive 20% conversion lifts without hiring a full-time CRO specialist. Focus on obvious friction such as weak CTAs and bloated forms.

Frustrated VP of Marketing: Leaders moving away from vanity-metric agencies must prove that heatmaps affect pipeline. MatchDay Health grew revenue 6x in 90 days using heatmaps after discovering that many users never reached their booking button. Moving the CTA produced an immediate lift and helped secure executive buy-in.
Post-Funding Scaler: Teams with aggressive targets need fast, reliable optimization. Competitor conquesting campaigns paired with heatmap-tuned landing pages can support 80-day payback periods that satisfy investors. Higher ad spend plus better conversion creates compounding growth.
Each archetype leans on different parts of heatmap analysis, yet all must connect behavior insights to revenue to sustain their programs.
To match your team’s archetype and constraints, schedule a strategy session with SaaSHero and design a heatmap plan aligned with your growth stage.
FAQ: SaaS Landing Page Heatmap Best Practices
What are the best free landing page heatmap analysis tools for SaaS companies?
Microsoft Clarity currently leads the free heatmap category with strong click, scroll, and move tracking. The 2026 AI update adds automatic frustration detection and anomaly alerts, which makes it especially useful for B2B SaaS teams. Clarity also offers unlimited usage without sampling, while many premium tools restrict free tiers.
Teams that need deeper segmentation can add Hotjar’s free tier for basic heatmaps and recordings. Even then, Clarity’s Microsoft integration and AI features make it the default starting point for most SaaS companies.
Can you provide a landing page heatmap analysis example specific to B2B SaaS?
A typical B2B SaaS heatmap review shows clear differences across devices and segments. Pricing page heatmaps often cluster clicks around plan comparisons, while mobile visitors scroll differently than desktop users. Demo request forms frequently show frustration on non-responsive elements or heavy interaction with optional fields that slow users down.
SaaSHero’s case studies show how pairing these patterns with CRO tactics turns raw behavior into measurable revenue gains.
How should I analyze click heatmap insights to identify conversion barriers?
VWO’s nine-step clickmap framework covers hotspot detection, distribution analysis, goal comparison, unexpected behavior, and click sequences. Pay close attention to frustration signals and non-interactive elements that attract clicks.
Strong clickmap analysis always segments by device, traffic source, and user intent. Cold zones around primary CTAs usually point to placement or design issues, while hot zones on non-functional elements show interface confusion that needs fast fixes.
What are the limitations of free heatmap analysis tools?
Free tools show what users do but not why they do it. They aggregate behavior without capturing motivation, so you still need session recordings, surveys, or expert heuristic reviews. Many free tools also limit segmentation compared to paid platforms.
Some features such as detailed form analytics, funnel views, and CRM integrations often sit behind paywalls. At that stage, working with a specialist like SaaSHero helps you interpret the data and turn it into a structured optimization roadmap.
How do I integrate heatmap analysis with A/B testing for SaaS optimization?
A strong integration process starts with heatmaps that reveal friction and inspire hypotheses. You then validate those hypotheses with controlled A/B tests.
Heuristic-based prioritization keeps your tests focused on high-impact changes instead of random ideas. Track both behavior patterns and conversion metrics during tests so you can connect user actions to business results.
Why do scroll heatmaps show drop-offs on my SaaS landing page?
Mobile-first layout fixes that address scroll depth can lift conversions within weeks. Sharp drop-offs usually reflect content and layout issues, not weak interest. Common causes include crowded above-the-fold sections, missing visual cues to keep scrolling, and key CTAs placed below typical scroll depth.
Device-level analysis often shows that mobile users scroll in shorter bursts and rely on thumb-friendly layouts. Adjusting for these patterns can significantly improve overall performance.
Conclusion: Turn Heatmap Insights into SaaS Revenue with SaaSHero
Landing page heatmap analysis turns invisible friction into clear, testable ideas that affect B2B SaaS revenue. The five-step framework of setup, collect, analyze, prioritize, and test gives your team a repeatable way to remove conversion barriers that standard analytics overlook.
Interpreting this data correctly still requires B2B SaaS conversion expertise and solid implementation. DIY efforts often miss key signals or misread patterns, which leads to changes that do not move pipeline or ARR.
SaaSHero’s month-to-month retainer, starting at $1,250, combines heatmap analysis, proprietary heuristics, and $750 landing page design services. The team has produced $504k ARR wins, 650% ROI improvements, and 20% conversion lifts across multiple SaaS verticals.
Request your complimentary heuristic audit to uncover your highest-impact heatmap opportunities and turn landing page behavior into predictable revenue growth.