

Key Takeaways
- B2B SaaS CAC averages $1,200 in 2026, with median companies spending $2 to acquire $1 of ARR. Calculate CAC by dividing total sales and marketing spend by the number of new paying customers.
- Example: $70,000 monthly spend acquiring 100 customers yields $700 CAC. Always include salaries, commissions, ad spend, and tools for accurate numbers.
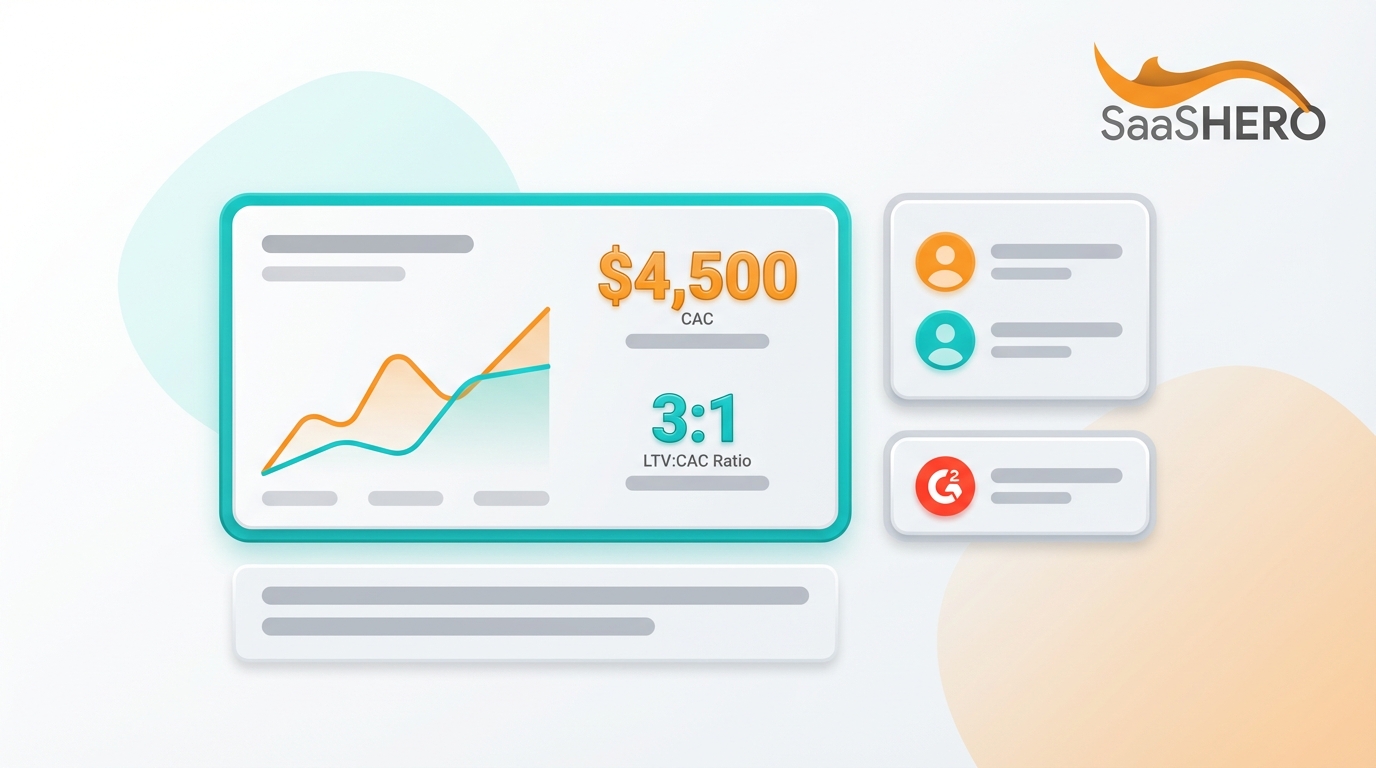
- Target LTV:CAC ratios of 3:1 to 5:1 with payback under 12 months. Benchmarks vary by industry, such as $612 for HR Tech and $1,200 for Cybersecurity.
- Lower CAC through competitor conquesting, negative keywords, conversion rate improvements, and content marketing. These tactics can deliver 10x better lead costs and 80-day payback periods.
- Use precise tracking and continuous improvement with SaaSHero’s discovery call to apply tactics that have produced 650% ROI and durable growth.
Data You Need Before Calculating B2B SaaS CAC
Accurate CAC calculation starts with clean, complete data. You need access to your CRM system such as HubSpot or Salesforce, your advertising platforms like Google Ads and LinkedIn Ads, and at least 12 months of revenue and lead data for meaningful trends. The basic CAC formula uses Total Sales and Marketing Spend divided by New Customers Acquired, but B2B SaaS adds complexity through sales commissions, long sales cycles, and multi-touch attribution.
Plan 1 to 2 hours for a full CAC review. Common risks include attribution gaps when customers touch multiple channels before converting and the urge to exclude soft costs such as team salaries. SaaSHero’s CRM tracking methodology acts as a practical standard for accurate B2B SaaS attribution, connecting ad clicks through to closed-won revenue.
Five-Step Framework for Reliable CAC
The five-step CAC framework delivers consistent, repeatable results. First, gather all sales and marketing spend. Second, count new customers accurately. Third, divide spend by customers to find CAC. Fourth, benchmark CAC against LTV ratios. Fifth, refine based on channel performance. This framework shifts focus away from vanity metrics like impressions and clicks and centers attention on activities that create revenue.
|
Step |
Action |
Data Needed |
Output |
|
1 |
Sum Spend |
Marketing + Sales Costs |
Total Investment |
|
2 |
Count Customers |
Closed-Won Deals |
New Customer Count |
|
3 |
Calculate CAC |
Spend ÷ Customers |
Cost Per Customer |
|
4 |
Benchmark LTV |
Revenue + Retention Data |
LTV:CAC Ratio |
SaaSHero’s reporting approach focuses on Net New ARR instead of lead volume. This focus ensures every dollar spent ties back to real revenue instead of vanity metrics that make agencies look good without driving growth.
Step-by-Step: How to Calculate CAC for SaaS
Step 1: Sum All Sales and Marketing Spend
Start by gathering all spend data across marketing and sales. Include marketing costs such as $40,000 in paid advertising, content creation, marketing automation tools, and team salaries, plus sales costs such as $30,000 in sales team salaries, commissions, CRM software, and sales enablement tools. B2B SaaS CAC includes marketing costs, sales costs, technology costs, and allocated overhead.
|
Category |
Amount |
Notes |
|
Paid Advertising |
$25,000 |
Google Ads, LinkedIn Ads |
|
Marketing Team |
$15,000 |
Salaries, tools, content |
|
Sales Team |
$20,000 |
Salaries, CRM, training |
|
Sales Commissions |
$10,000 |
Variable compensation |
|
Total |
$70,000 |
Monthly spend |
Step 2: Count New Customers Accurately
Count only closed-won customers who have paid their first invoice. Exclude free trial users who have not converted and customers who churned within the measurement period. In this example, 100 new paying customers joined during the measurement month.
Step 3: Calculate CAC
Divide total spend by new customers. Using the example, $70,000 divided by 100 customers equals $700 CAC. This figure represents the fully loaded cost to acquire each new customer, including all sales and marketing investments.
Step 4: Validate Against LTV
Compare CAC to Lifetime Value using the formula LTV = (Average Revenue Per Customer × Gross Margin Percentage × Average Customer Lifespan). Healthy B2B SaaS companies maintain LTV:CAC ratios of 3.8x with median payback periods of 8.6 months. If a customer pays $200 monthly with 80% gross margin and stays 24 months, LTV equals $3,840, which creates a 5.5:1 LTV:CAC ratio.
Step 5: Attribute CAC by Channel
Break CAC down by acquisition channel to find the most efficient sources. Use GCLID tracking for Google Ads and UTM parameters for other channels to keep attribution accurate.
Pro Tip: Use first-party tracking with tools like HubSpot’s attribution reporting to capture the full customer journey beyond last-click data.
Common Mistake: Relying only on last-click attribution undervalues top-of-funnel awareness efforts that influence buying decisions.
Partner with SaaSHero for accurate Net New ARR tracking and book a discovery call to set up attribution that connects every marketing dollar to closed revenue.
2026 B2B SaaS CAC Benchmarks and Healthy Targets
Industry benchmarks give context for your CAC performance. B2B SaaS CAC varies by vertical, with Fintech at $1,450, Engineering at $551, and eCommerce SaaS at $274. Company stage also shapes CAC expectations, with early-stage companies often spending $500 to $2,000 per customer and growth-stage companies refining CAC into the $1,000 to $3,000 range.
|
Industry/Stage |
Average CAC |
Payback Period |
LTV:CAC Target |
|
HR Tech |
$612 |
6-8 months |
4.0x |
|
Cybersecurity |
$1,200 |
10-12 months |
3.5x |
|
Early Stage |
$800 |
12-18 months |
3.0x |
|
Scale-up |
$400 |
6-9 months |
4.5x |
Payback periods under 80 days show exceptional performance, as seen in SaaSHero’s work with TestGorilla. Healthy LTV:CAC ratios for SaaS in 2026 range from 3:1 to 5:1, with ratios below 3:1 signaling weak customer value relative to acquisition costs. SaaSHero’s 2026 client data shows Playvox achieving a 10x improvement in cost per lead through account restructuring and negative keyword refinement.
Practical Ways to Reduce CAC for B2B SaaS
Effective CAC reduction focuses on channel performance, conversion rates, and precise targeting. Competitor conquesting campaigns reach high-intent users who search for alternative solutions and evaluate options. Content marketing can reduce CAC by 61% compared to paid advertising, with organic leads converting at three times the sales qualification rate.
Conversion rate optimization improves CAC by making existing traffic work harder. Landing page improvements, form changes, and stronger trust signals can double conversion rates without higher ad spend. SaaSHero uses a structured approach that combines negative keyword hygiene, bid strategy refinement, and landing page testing to deliver measurable gains.

Case studies highlight this impact. TripMaster generated $504,758 in Net New ARR with 650% ROI through integrated paid search and CRO strategies. Playvox cut cost per lead by 10x while increasing lead volume by 163% through account restructuring and tighter targeting.

SaaSHero’s flat-rate pricing at $1,250 per month removes the percentage-of-spend incentive that pushes agencies to raise budgets regardless of results. This model aligns recommendations with efficiency and profit instead of fee growth.
Interactive CAC Calculator: Enter your monthly marketing spend, sales costs, and new customer count to see your current CAC and compare it to industry benchmarks.
Scale with SaaSHero’s Full Team approach and book a discovery call to apply CAC reduction strategies that have delivered 80-day payback periods for fast-growing SaaS companies.
Advanced CAC Measurement and Validation
Monthly CAC trends reveal seasonality and shifts in campaign performance. SaaSHero’s HubSpot integration supports automated CAC tracking with attribution from first touch through closed-won revenue, which removes manual errors and gives real-time visibility into acquisition efficiency.
Advanced CAC analysis covers channel segmentation across organic and paid, customer segment splits such as SMB versus enterprise, and cohort-based calculations that reflect different sales cycle lengths. ARR-weighted CAC calculations give a clearer picture for companies with wide deal size variation.
Connect CAC analysis to broader revenue operations by tying it to expansion revenue, churn analysis, and customer success metrics. This full view supports decisions based on total customer value instead of acquisition cost alone.
Summary and Action Plan
Accurate CAC calculation depends on complete spend tracking, precise customer counts, and clear benchmarks. The five-step framework keeps the process simple: gather spend data, count new customers, calculate CAC, compare against LTV ratios, and refine based on performance. Aim for LTV:CAC ratios of 3:1 or higher with payback periods under 12 months to support sustainable growth.
Your next steps include setting up tracking systems that connect marketing spend to closed revenue, creating monthly CAC reporting rhythms, and testing reduction strategies such as competitor conquesting and conversion rate improvements. SaaSHero’s methodology has helped companies reach 80-day payback periods and 650% ROI through structured optimization.

Frequently Asked Questions
What is a good CAC by industry for B2B SaaS companies?
CAC benchmarks vary by industry and company stage. HR Tech companies often reach $612 CAC, while Cybersecurity averages $1,200 because of longer sales cycles and higher deal values. Fintech companies frequently see $1,450 CAC due to regulatory complexity and enterprise sales motions. Early-stage companies usually spend $500 to $2,000 per customer as they build product-market fit, while scale-up companies refine CAC into the $400 to $1,000 range through better targeting and stronger conversion rates. The key goal is to maintain LTV:CAC ratios above 3:1 regardless of the absolute CAC level.
Can you reduce CAC in 30 days?
Meaningful CAC improvements can appear within 30 days through tactical changes. Negative keyword additions cut wasted spend on irrelevant searches within days. Landing page conversion gains from stronger trust signals, simpler forms, and clearer messaging can double conversion rates in 2 to 4 weeks. Competitor conquesting campaigns reach high-intent prospects who actively compare alternatives and often deliver results within the first billing cycle. SaaSHero’s month-to-month engagement model supports rapid testing and optimization without long contracts, which helps companies see measurable gains in their first 30 days.
How does SaaSHero cut CAC for B2B SaaS companies?
SaaSHero lowers CAC through improvements in targeting, conversion, and attribution. Their competitor conquesting approach captures high-intent prospects during active evaluation, while negative keyword hygiene removes wasted spend. Landing page refinement and conversion testing increase the value of existing traffic without higher ad budgets. Their flat-rate pricing model also removes the incentive to inflate budgets for larger fees, which keeps recommendations focused on efficiency. Case studies show 80-day payback periods and 10x cost per lead improvements from this combined approach.
What costs should be included in B2B SaaS CAC calculations?
Comprehensive CAC calculations include all sales and marketing expenses. Include paid advertising, marketing team salaries, sales team compensation including commissions, marketing automation and CRM software, content creation, events and conferences, and allocated overhead for facilities and management. Exclude customer success, support, and product development costs because these relate to retention instead of acquisition. The goal is to capture every dollar spent to win new customers and provide accurate unit economics for growth planning and investor reporting.
What LTV:CAC ratio indicates healthy B2B SaaS economics?
Healthy B2B SaaS companies usually maintain LTV:CAC ratios between 3:1 and 5:1. Ratios below 3:1 point to high acquisition costs or weak customer value, which makes growth hard to sustain. Ratios above 5:1 can signal under-investment in growth and missed market share. The median B2B SaaS company reaches about 3.8x LTV:CAC with 8.6-month payback periods. Enterprise-focused companies may accept slightly lower ratios because of higher deal values and longer retention, while SMB-focused companies often target higher ratios to offset shorter lifespans and lower expansion revenue.
Book a discovery call for CAC mastery and apply strategies that help B2B SaaS companies reach sustainable, profitable growth through disciplined customer acquisition.