

Written by: Aaron Rovner, Founder, Saas Hero
Key Takeaways
- Capital-efficient B2B SaaS growth depends on KPIs that tie marketing directly to qualified pipeline, revenue, and retention instead of surface activity metrics.
- Revenue-first KPI sets focus on qualified pipeline created, win rate, pipeline velocity, CAC payback, pipeline ROAS, and LTV:CAC by acquisition source.
- AI, predictive analytics, and intent data improve targeting, help prioritize high-value accounts, and increase the efficiency of performance marketing spend.
- A unified data foundation, clear dashboards, and realistic benchmarks turn KPIs into decisions that executives and boards can trust.
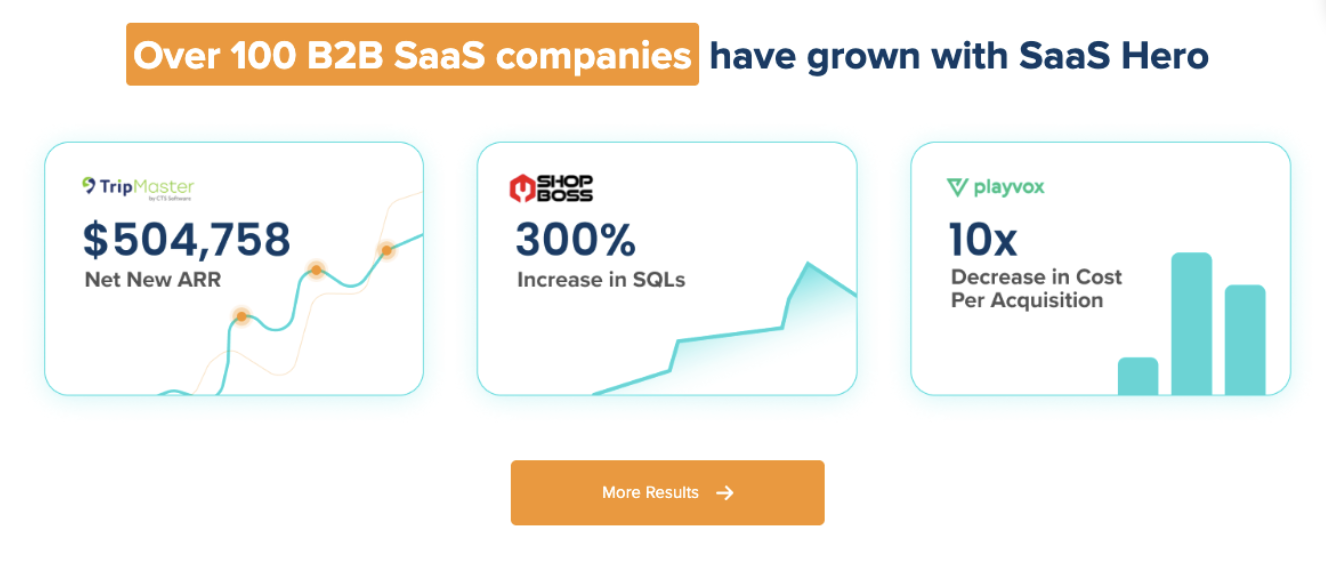
- SaaSHero helps B2B SaaS teams design and implement revenue-focused KPI frameworks that support Net New ARR growth, and you can schedule a discovery call to get started.
Why Traditional KPIs Fall Short For B2B SaaS Growth
B2B SaaS growth now depends on capital efficiency and clear unit economics. CEOs in 2026 focus on revenue impact, CAC payback, and marketing’s contribution to Net New ARR, not on activity counts.
Legacy metrics such as MQLs, traffic volume, and CPL often mislead teams. Privacy changes, larger buying committees, and AI-driven research move much of the buying journey off-site and earlier in the process, so these surface metrics no longer reflect pipeline quality.
The B2B buyer journey now spans many touchpoints and stakeholders. A prospect may research on G2, listen to peers, review your content, then finally convert on a branded search. A last-click report that gives all credit to that final search hides most of the demand creation work and leads to poor investment decisions.
This gap between what gets measured and what drives revenue creates risk for leadership. Boards expect proof that marketing spend produces sustainable, predictable Net New ARR. Activity-based KPIs cannot answer that question with enough clarity.
KPIs That Tie B2B SaaS Marketing Directly To Revenue
Modern B2B SaaS teams use a KPI set that connects campaigns to pipeline and revenue. Key metrics in 2026 include qualified pipeline created, win rate from SQL to Closed-Won, pipeline velocity, CAC payback period, pipeline ROAS, and Marketing Efficiency Ratio (MER).
Measure Pipeline Quality And Velocity
Pipeline quality shows whether marketing generates opportunities that fit your ICP and convert at healthy rates. Qualified pipeline created should reflect the dollar value of opportunities that meet your sales-accepted criteria, paired with win rate tracking from SQL to Closed-Won by channel and campaign.
Pipeline velocity captures how quickly opportunities move through the funnel. By tracking time from first touch to close across channels, you can:
- Spot campaigns that deliver fast-moving, high-intent deals
- Identify stages where opportunities stall
- Reallocate budget toward higher-velocity sources
Track Capital Efficiency And ROI
CAC payback period shows how long it takes to recover acquisition costs through gross margin. Teams increasingly replace CPL and basic channel ROAS with CAC payback and pipeline ROAS so they can see how efficiently spend turns into revenue, not just leads.
Two useful efficiency metrics include:
- Pipeline ROAS tracks pipeline value generated per dollar of ad spend and gives a forward-looking view of campaign impact.
- MER compares total marketing spend with total revenue in a period and reflects the multi-touch nature of B2B buying.
Align Acquisition With Long-Term Customer Value
LTV:CAC remains a core health check. A common benchmark is a 6:1 LTV:CAC ratio, but this ratio should be measured by acquisition source so you can favor channels that drive durable, high-value customers.
Tracking NRR and GRR by acquisition source highlights whether certain channels bring in customers who expand and stay, or churn quickly. This view helps avoid optimizing for cheap leads that damage unit economics over time.
Uncover the real ROI of your performance marketing KPIs with a SaaSHero discovery call.
Connect Marketing Investments To Financial Outcomes
Revenue-driven KPIs work best as a connected system. Together, they explain what is happening in the funnel and why.
A full-funnel view tracks the journey from first touch through Closed-Won revenue:
- Top of funnel metrics such as qualified pipeline created show demand generation strength.
- Mid-funnel metrics such as pipeline velocity reveal sales readiness and message fit.
- Bottom-funnel metrics such as win rate by source prove final revenue impact.
Multi-touch attribution views that include off-site research, qualitative signals, and earlier touches provide a more accurate picture than last-touch models and make budget shifts more reliable.
|
Feature |
Traditional B2B SaaS |
Revenue-Driven B2B SaaS Performance Marketing KPIs (2026) |
|
Primary Focus |
Volume, activity |
Revenue quality, efficiency, predictability |
|
Acquisition Metric |
CPL, MQLs |
CAC payback period, pipeline ROAS |
|
Sales Alignment |
Lead quantity |
Win rate (SQL→Closed-Won), pipeline velocity |
|
Retention Focus |
Gross churn |
NRR and GRR by acquisition source, predicted LTV |

Use AI, Predictive Analytics, And Intent Data To Prioritize Revenue
AI and predictive analytics give B2B SaaS teams new ways to find and prioritize high-value accounts. Predictive lead scoring and predicted LTV (pLTV) help shift budget toward accounts most likely to convert and retain.
Signal-based selling layers in intent indicators such as technology changes, hiring patterns, and content consumption. AI-powered ABM and signal-based selling tied to revenue KPIs allow teams to:
- Target accounts that show active buying intent
- Adjust bids and messaging in near real time
- Protect spend from low-intent audiences
AI-driven analytics also introduce metrics such as dynamic CLV, churn prediction accuracy, and real-time cost per acquisition, which support more proactive revenue management.
Build A Revenue-First KPI Tracking Framework
A revenue-first KPI strategy depends on accurate data and shared definitions. Teams need CRM and marketing analytics tools connected into a single source of truth for accounts, opportunities, and revenue.
Key implementation steps include:
- Passing campaign identifiers such as GCLID or UTMs from ad click to CRM so Closed-Won revenue ties back to specific campaigns and keywords
- Standardizing lifecycle stages and qualification criteria with sales so win rate and velocity data stay consistent
- Designing dashboards that roll key KPIs up to Net New ARR and margin instead of listing disconnected metrics
Executive dashboards that highlight a few revenue-linked KPIs give leadership faster, clearer insight than pages of activity metrics. Regular reviews of funnel performance and win rates, supported by monthly or quarterly KPI reviews, help teams spot bottlenecks and test improvements.
Work with SaaSHero to implement a revenue-first tracking framework that your executive team trusts.

Use 2026 Benchmarks To Set Realistic KPI Targets
Benchmarks provide context so you can interpret your KPI performance correctly. Reliable B2B SaaS benchmarking resources compare metrics such as conversion rates, win rates, and churn to industry norms.
Recent data shows an average CAC around $728, an LTV:CAC ratio near 6:1, and annual churn of 5 to 7 percent, with significant variation by deal size and go-to-market motion. High-performing companies often reach CAC payback in under 12 months, and top quartile teams reach 6 to 8 months.
Channel-level benchmarks also differ. SEO can reach very high ROI over 6 to 12 months, while paid programs usually show lower ROI but faster pipeline impact. These reference points prevent teams from overreacting to early results that are normal for the chosen channel.
Put Revenue-Focused KPIs At The Center Of B2B SaaS Growth
Shifting from vanity metrics to outcome-driven KPIs changes how B2B SaaS teams plan, spend, and report. This approach favors capital-efficient growth, shorter feedback loops, and clearer communication with boards and investors.
Teams that align around pipeline quality, conversion velocity, CAC payback, and customer value gain a sharper view of what actually drives Net New ARR. They also spot underperforming channels faster and can move budget with more confidence.
Organizations that keep using outdated, activity-only reporting risk misallocating spend and missing the signals that matter. A revenue-first KPI model reduces that risk and builds a stronger foundation for long-term growth.
Frequently Asked Questions (FAQ)
Why CAC payback period and pipeline ROAS matter most for B2B SaaS performance marketing
CAC payback period shows how quickly marketing and sales investments return cash to the business. Pipeline ROAS shows how much qualified pipeline each marketing dollar creates. Together, these metrics reveal both efficiency and growth potential in language that aligns with finance and investors.
How to align marketing KPIs with CEO and board objectives
Marketing teams can align with leadership by focusing on KPIs that map to revenue and valuation. Replace lead-count metrics with Net New ARR contribution, CAC payback, LTV:CAC by channel, win rate, and pipeline velocity. Executive dashboards should highlight how marketing affects revenue quality, not just volume.
How to use MQLs in a modern B2B SaaS KPI model
MQLs can still offer funnel visibility but should not define success. Stronger indicators include lead-to-SQL conversion, progression from SQL to opportunity, win rate, and velocity by source. Many teams now rely on engagement and intent scores instead of a simple qualified or unqualified label.
What qualifies as a vanity metric in B2B SaaS performance marketing
Vanity metrics are numbers that can grow while revenue stays flat or declines. Common examples include raw traffic, social likes, email opens, and cost-per-click without downstream conversion data. Metrics should earn focus only when they correlate with pipeline and revenue.
How to approach multi-touch attribution for complex B2B sales cycles
Effective multi-touch attribution starts with consistent UTM use and CRM capture of source and campaign data at every stage. Marketing automation and attribution tools can then connect email, content, paid media, and offline interactions into a single contact and account timeline. The goal is to understand the set of touches that shape opportunities and revenue, not just the last interaction before a form fill.