

Written by: Aaron Rovner, Founder, Saas Hero
Key Takeaways
- Translate heuristic findings into clear business stories that highlight revenue impact, such as lost ARR, to secure executive buy-in.
- Follow a 5-step framework: Executive Summary, Heuristic Primer, Themed Findings, Actionable Recommendations Matrix, and Next Steps with validation plans.
- Prioritize issues by severity, frequency, and business relevance, grouped by user journey stages like pricing and demo flows with quantified impact.
- Ship quick wins first, using A/B testing and tracking metrics like conversion rates and pipeline value to prove ROI.
- Partner with SaaSHero for expert discovery calls to build custom heuristic decks that can deliver $500K+ Net New ARR gains.

What You Need Before You Build Your Heuristic Deck
Gather your core tools before you start building your presentation. Use presentation software like Google Slides or PowerPoint, screenshot tools or exports from Figma, and your completed heuristic audit with all identified violations.
Build a basic knowledge base so you can speak both UX and revenue. Know Nielsen’s 10 usability heuristics, key SaaS metrics like CAC, LTV, and ARR, and how UX friction affects those numbers. For instance, demo form friction can cut conversion rates by 20%, which can cost $50,000 in lost pipeline each year.
Plan for 1–2 hours of prep time with relatively low technical difficulty. As of 2026, AI heuristic UX evaluations achieve 95% accuracy based on 200,000+ hours of research. These tools can generate prioritized to-do lists that support quick-win implementation.
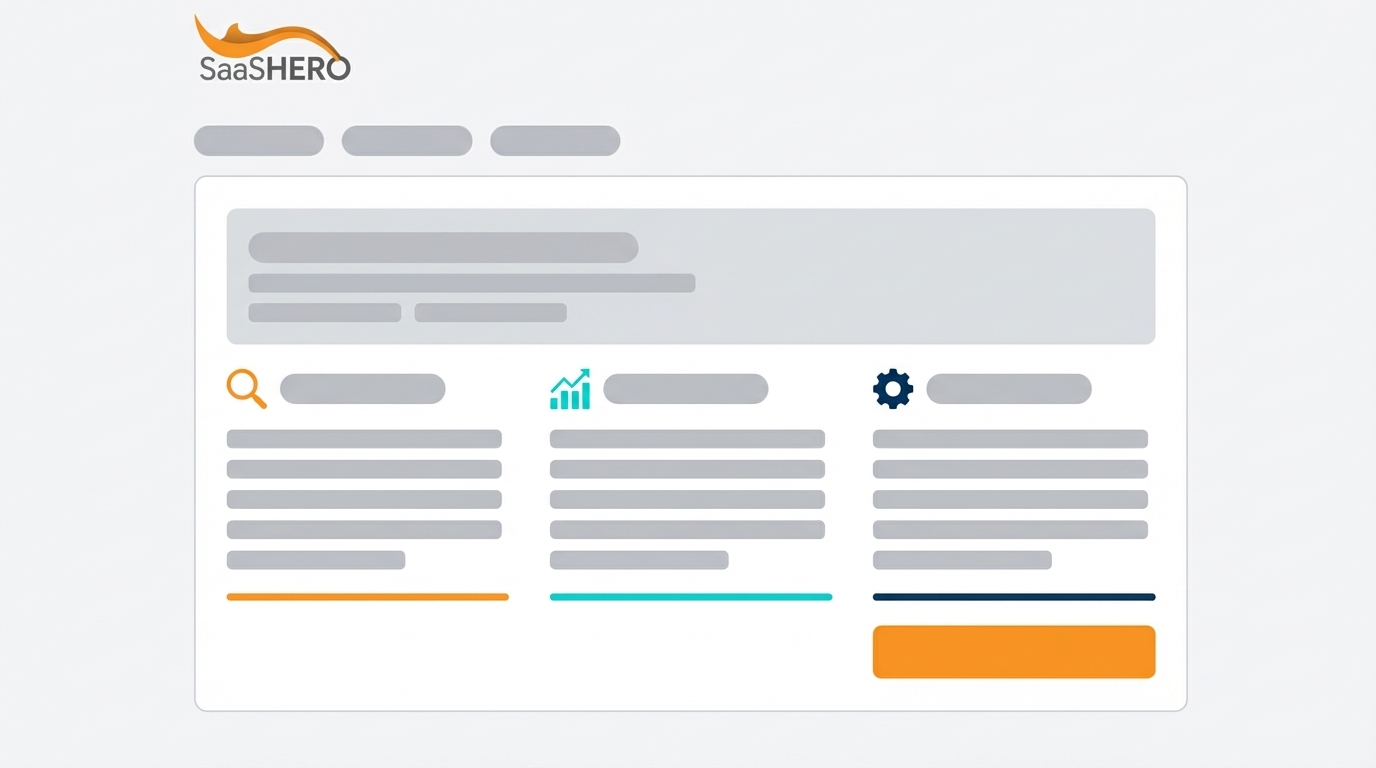
Your 5-Step Framework for Heuristic Analysis Presentations
Use a five-part structure that builds understanding and moves stakeholders toward approval. Step 1 delivers an Executive Summary that leads with revenue impact instead of UX theory. Step 2 adds a Heuristic Primer that explains your method in simple business language.
Step 3 shares Themed Findings organized by user journey stage, with severity ratings tied directly to business impact. Step 4 introduces an Actionable Recommendations Matrix that ranks quick wins and larger strategic projects. Step 5 closes with clear Next Steps, validation plans, and success metrics.
This framework aligns with CRO processes used by agencies like SaaSHero. Their approach has generated more than $504,000 in Net New ARR for clients through structured heuristic analysis and implementation. SaaSHero also offers custom presentation decks starting at $1,250 per month with month-to-month flexibility.

Step-by-Step: Build and Present Your Heuristic Analysis Deck
Step 1: Craft an Executive Summary That Leads with Revenue
Open with a slide that captures executive attention within 30 seconds by leading with revenue impact. Use a headline such as “3 Conversion Killers Costing $X ARR” to signal immediate business relevance.
Calculate friction costs using your own conversion data. If your pricing page has a 20% drop-off rate and 1,000 monthly visitors, you lose 200 prospects. With a $2,500 average contract value, that friction removes $50,000 in monthly pipeline. Present these numbers in a simple table with columns for Issue, Current Performance, Lost Opportunity, and Monthly Impact.
Use SaaS-specific examples that feel real to your executives. A pricing page trust gap might reduce demo requests by 15%, which directly shrinks sales pipeline. Avoid UX jargon. Replace “violates visibility of system status” with “this hurts demo conversions.” Add a screenshot of the issue with clear callouts so the problem is obvious.
Step 2: Explain Heuristics in Plain Business Language
Reserve one slide to explain heuristic evaluation in terms non-designers understand. Define heuristics as “proven design principles that predict user behavior and business outcomes,” not abstract usability rules. Reference Nielsen’s framework as an industry standard to reinforce credibility.
Use visual SaaS examples instead of theory. Show a strong pricing page next to a weak one to illustrate clarity. Demonstrate how clear error messages reduce support tickets and frustration. This short education segment helps stakeholders see your analysis as systematic and repeatable, not subjective opinion.
Step 3: Present Themed Findings with Clear Business Impact
Group your findings by user journey themes such as Homepage First Impression, Pricing Evaluation, Demo Request Process, and Onboarding Flow. This structure shows how friction stacks across the experience and affects revenue.
Create a findings table with columns for Issue Description, Violated Heuristic, UX Severity Rating, Business Impact, and Supporting Screenshot. Use a 4-point severity scale for heuristic issues, with a rule of thumb: critical if it blocks user tasks, minor or cosmetic if it only annoys. Rank issues with the formula Priority = Severity + Frequency + Business Relevance.
Translate each UX problem into a business statement. Replace “poor error prevention” with “unclear form validation increases abandonment by 25%, costing 50 qualified leads each month.” Include annotated screenshots that highlight the exact elements causing friction.
Step 4: Build an Actionable Recommendations Matrix
Turn your findings into a prioritized recommendations matrix. Include columns for Recommendation, Implementation Effort, Expected Impact, and Estimated ARR Contribution. Focus first on issues that affect revenue or trust, since not every problem has equal business weight.
Lead with Quick Wins that combine high impact with low effort and can ship within two weeks. Examples include adding trust badges to pricing pages, shortening demo request forms, or clarifying error messages. Follow with Strategic Initiatives that need more development time but create strong long-term gains.
Give specific implementation guidance for each recommendation. Replace vague items like “improve navigation” with “add breadcrumb navigation to pricing pages and add a ‘Talk to Sales’ CTA in the header.” Include estimated timelines and required resources so teams can plan without guesswork.
Step 5: Close with Next Steps and a Validation Plan
End with a roadmap that shows phases, metrics, and validation methods. Propose A/B tests for quick wins so you can prove impact before larger rollouts. Define KPIs such as demo request conversion rate, pricing page engagement time, or trial-to-paid conversion lift.
Lay out 30-day, 60-day, and 90-day milestones. Explain how you will measure success using Google Analytics, HubSpot, or other analytics tools. This structure builds confidence in your plan and sets clear expectations for accountability.
Measure Success with Real SaaS Outcomes
Track presentation success by looking at stakeholder approval and how quickly teams implement your recommendations. Strong heuristic presentations often drive more than a 15% conversion rate lift within 90 days when teams execute the plan. Monitor results in Google Analytics, HubSpot, or your CRM to show ROI.
Validate quick wins through A/B testing before you scale changes. The IKEA Place AR app addressed UX heuristic violations around uncertainty in product size and fit by letting users place virtual furniture in their homes. This change increased time spent browsing by 2.3x and boosted engagement. Conversion rates rose by 14%, which increased revenue from online sales.
SaaSHero applies a similar systematic approach for B2B SaaS clients. Their work with TripMaster focused on trust and friction issues that blocked conversions. Fixing those issues produced a 20% conversion rate lift and $504,758 in Net New ARR with a 650% ROI. The key was turning heuristic violations into specific business problems with measurable fixes.

Expect challenges such as complex attribution in B2B funnels and long sales cycles that delay visible impact. Work with experts who understand SaaS metrics and can support ongoing improvement. Book a discovery call with SaaSHero for full heuristic analysis, revenue tracking, and custom presentation development.
Recap and Your Next Moves
Effective heuristic presentations turn technical insights into business narratives that drive executive decisions. Use the 5-step framework: lead with a revenue-focused executive summary, teach heuristics in simple terms, share themed findings with business impact, present a prioritized recommendations matrix, and close with clear next steps and validation plans.
Your next moves are straightforward. Build your deck using this structure, identify quick wins you can implement immediately, and set up measurement systems to track improvements. Start with high-impact, low-effort changes so you can show value quickly and build momentum.
Scale your results by partnering with CRO specialists who understand SaaS funnels and metrics. Book a discovery call with SaaSHero to turn your heuristic findings into specific, revenue-driving improvements.
FAQ: Presenting Heuristic Findings
How long does it take to prepare a heuristic analysis presentation?
Most teams can prepare a comprehensive heuristic presentation in 1–2 hours once the audit is complete. This time covers organizing findings by themes, calculating business impact, building visuals like severity tables and recommendation matrices, and outlining next steps. Preparation time drops as you gain experience and use repeatable templates.
How should I adapt my presentation for executives versus product teams?
Executives need a high-level view that focuses on ARR impact, competitive advantage, and required resources. Lead with revenue metrics and keep UX details brief. Product teams need deeper implementation detail, technical feasibility notes, and alignment with the existing roadmap. They benefit from user scenarios, wireframes, and mockups that show proposed solutions.
What is the typical timeline for implementing heuristic recommendations?
Quick wins such as adding trust signals, clarifying forms, or updating error messages usually ship within 2–4 weeks. Medium-complexity work like navigation changes or layout updates often takes 4–8 weeks. Large strategic initiatives that require major development can take 8–12 weeks or longer.
How do I prioritize heuristic findings when everything seems important?
Use a prioritization model that combines severity, frequency, and business relevance. Address issues that block key tasks such as demo requests or trial signups first. Compare implementation effort with expected impact and move quick wins with strong upside to the top of the list. Anchor every decision to measurable business outcomes, not personal design preferences.
What metrics should I track to prove the success of heuristic improvements?
Track conversion metrics that match your goals, such as demo request conversion rate, trial signup completion rate, pricing page engagement time, and funnel conversion lift. Watch behavior metrics like bounce rate, time on page, and task completion for the flows you changed. Tie these improvements to revenue metrics such as pipeline value, deal velocity, and Net New ARR to show clear business value.