




Written by: Aaron Rovner, Founder, Saas Hero | Last updated: September 6, 2026
Key Takeaways For B2B SaaS Leaders
- Most adtech dashboards stop at clicks and form fills, so marketing leaders cannot answer board-level questions about pipeline and revenue from ad spend.
- Connecting ad spend to CRM data in Salesforce or HubSpot is the most important capability for B2B SaaS teams because it turns dashboards into defensible revenue-reporting systems.
- Revenue metrics such as cost per SQL, pipeline created by channel, CAC, and payback period matter more than vanity metrics like CTR or cost per lead.
- API changes from Google and Meta in 2026 make automated, server-side data collection essential to prevent data loss and broken manual exports.
- SaaSHero provides end-to-end revenue-connected reporting and campaign management for B2B SaaS teams that lack internal resources; schedule a discovery call to see how it changes board conversations.
Why Adtech Reporting Dashboards Matter For B2B SaaS
Adtech reporting dashboards sit between raw ad platform data and actual decisions. For B2B SaaS marketing leaders, the relevant terms include ROAS, CAC, LTV:CAC, pipeline coverage, and multi-touch attribution. The critical distinction is between optimizing to form submissions and optimizing to CRM revenue data. A dashboard that stops at form fills only counts clicks. Connecting it to Salesforce or HubSpot reveals how many of those clicks became qualified pipeline and closed revenue.
The most useful dashboards unify multi-channel data and tie it directly to revenue outcomes. That framing matters because the market is moving fast. Technavio’s August 2026 Global Adtech Market report forecasts the global adtech market will grow by USD 1,217.9 billion during 2025–2030 at a 14.6% CAGR, driven by privacy-centric measurement and AI adoption. At the same time, the global marketing analytics software market reached $8.02 billion in 2026. The infrastructure for unified reporting is maturing quickly, yet most B2B SaaS teams still do not connect ad spend to revenue.
Adtech Reporting Dashboard Definition For 2026
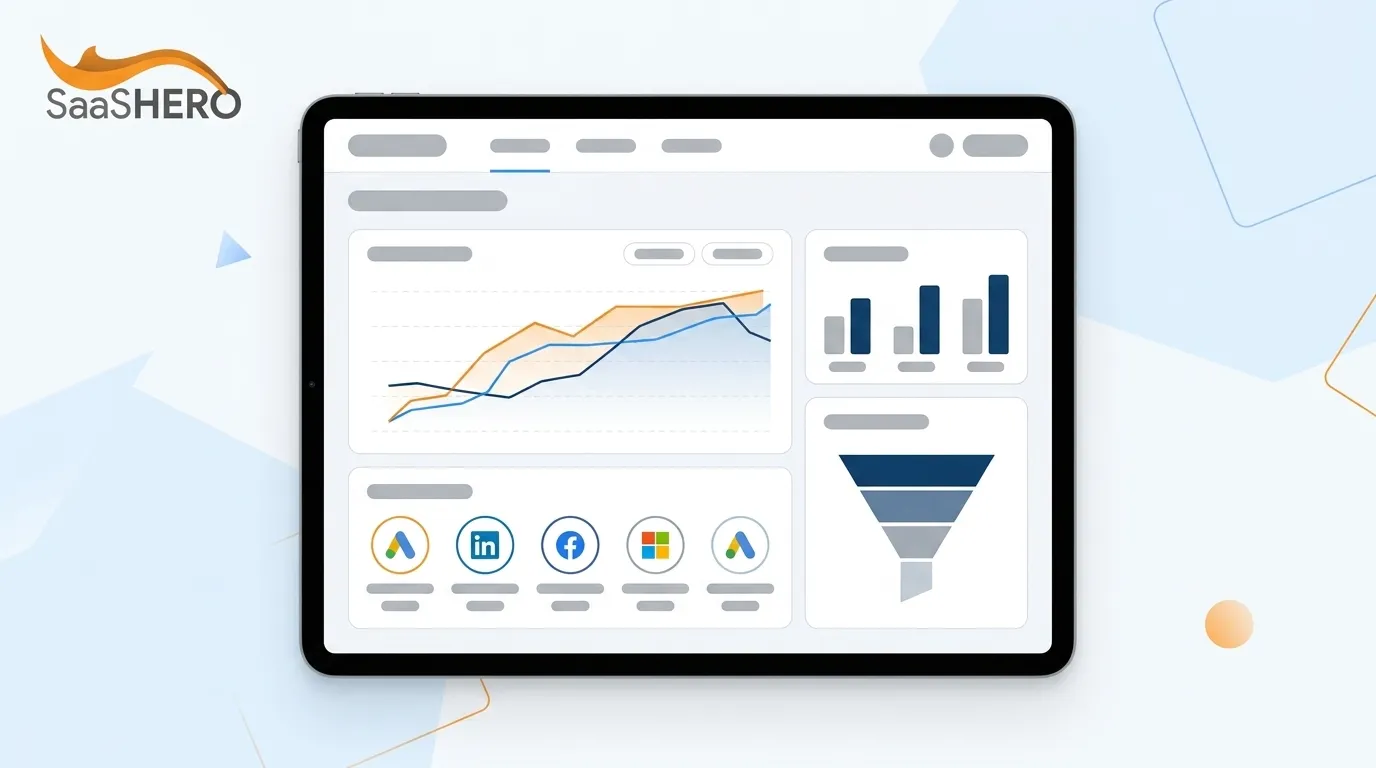
An adtech reporting dashboard is a centralized, visual interface that aggregates advertising data from multiple platforms into a single view. Platforms typically include Google Ads, LinkedIn, Meta, and Microsoft Ads. This setup lets marketers monitor performance, identify trends, and make data-driven decisions.
Modern dashboards extend beyond simple metric display. They provide real-time data visualization, automated reporting and scheduling, custom metrics, and, for B2B SaaS, CRM integration that connects ad spend to pipeline and closed revenue. Two platform changes in 2026 make automated data preservation urgent. Google Ads now limits access to granular hourly, daily, and weekly data to 37 months, after which it becomes inaccessible through both the interface and the API. Meta also requires per-account opt-in for device, hourly, and frequency breakdowns in Ads Insights, effective August 6, 2026. Accounts that have not opted in receive empty data arrays, which cause dashboards to show zeroes that can look like a performance collapse. Both changes break manual export workflows and demand automated collection.
Teams that still rely on manual exports face real risk of missing or misreading performance data. Given these platform shifts, the features below become non-negotiable for B2B SaaS teams that need to answer revenue questions.
Six Non-Negotiable Adtech Dashboard Features For B2B SaaS
B2B SaaS teams need specific capabilities from their dashboards, not a generic feature checklist. The following six features support revenue-connected decision-making.
- Multi-Channel Integration – Native connections to Google Ads, LinkedIn, Meta, and Microsoft Ads in a single view, without manual exports.
- Real-Time Data Visualization – Live data that reflects current campaign performance, instead of a weekly PDF assembled by hand.
- Automated Reporting And Scheduling – Scheduled refreshes and report delivery that remove manual reconciliation work.
- Custom Metrics And Dimensions – The ability to define metrics such as cost per SQL or pipeline created by channel, not just the defaults each platform surfaces.
- CRM Integration (Salesforce/HubSpot) – The capability that separates decision-support tools from vanity dashboards because it connects ad spend to pipeline and revenue.
- Pipeline And Revenue Tracking – Reporting on qualified pipeline, CAC, and payback period, not only clicks and impressions.
For B2B SaaS, CRM integration is the feature that matters most. Every other capability on this list is table stakes. CRM integration is the one that makes the dashboard credible in a board meeting.
Revenue Metrics Versus Vanity Metrics To Track
B2B SaaS marketing leaders should track the metrics that appear in finance conversations. These include cost per SQL, pipeline created by channel, CAC, CAC payback period, and LTV:CAC. The metrics most dashboards default to, such as cost per click, cost per lead, and CTR, measure top-of-funnel activity instead of business outcomes.
| Metric Type | Form-Fill Metrics | Revenue Metrics |
|---|---|---|
| Examples | Cost per click, cost per lead, CTR | Cost per SQL, pipeline created, CAC payback |
| What It Measures | Top-of-funnel activity | Business outcomes |
| Optimization Target | Volume | Revenue |
PipelineGrader’s 2026 B2B benchmarks rate LTV:CAC of 3:1–5:1 as healthy and recommend CAC payback targets of under 12 months for mid-market ACV tiers such as $25k–$75k. The Starr Conspiracy’s 2025 B2B marketing benchmarks put the median pipeline coverage ratio for B2B SaaS at 3.4x of current-quarter quota. These are the numbers a revenue-connected dashboard should surface, rather than impressions.
Adtech Dashboard Tools Compared For Revenue Reporting
Most popular dashboard tools excel at visualizing marketing data but do not natively connect ad spend to CRM pipeline and revenue. The comparison below highlights that gap and sets up the build-versus-buy decision for B2B SaaS teams.
| Tool | Best For | Key Advantage | Pricing |
|---|---|---|---|
| Looker Studio | Small to mid-sized teams in the Google ecosystem | Free, 1,000+ community connectors | Free (connectors range from free to $10–$30/month) |
| Supermetrics | Data pipeline management into BI tools | 100+ connectors, feeds Looker Studio, Power BI, BigQuery | Annual billing plans start at $44/month (Starter) and $177/month (Growth), with higher tiers available |
| Funnel | Automated data collection and normalization | 600+ connectors, currency normalization | From $200/month (annual) |
| Whatagraph | Agency client reporting with white-label needs | Semantic layer, linked reports across client accounts | From $229/month (annual) |
| AgencyAnalytics | Agencies managing multiple clients | 85+ integrations, white-label client portals | From $59/month (annual, 5 clients) |
Looker Studio is free but requires connectors such as Supermetrics to pull ad platform data, and building CRM connections demands technical expertise. Supermetrics functions as a connector that moves data into a visualization layer but does not itself produce revenue-connected reporting. Most tools in this list focus on marketing data and require significant custom work to tie into CRM revenue.
Build Versus Buy: Framework For B2B SaaS Dashboards
The build-versus-buy decision for adtech reporting dashboards depends on four variables. These include internal resources, time to implementation, customization needs, and ongoing maintenance burden. Building in Looker Studio with Supermetrics as a connector is the most common DIY path. This approach often gets underestimated because someone must maintain connectors, update field mappings when CRM definitions change, and rebuild reports when platforms change their APIs. Google Ads API v25, released July 22, 2026, removed legacy lifecycle-goal resources with no grace period. That change forced code rewrites for any integration that touched those resources. API maintenance remains an ongoing responsibility, not a one-time project.
B2B SaaS teams with limited marketing operations resources often gain more by partnering with a team that owns reporting end-to-end. A Fluent HQ survey of 104 agencies found that marketing agencies spend an average of 25 hours per client per month on reporting, with only about 26% of that time producing actual insights. The remaining hours go to data extraction, formatting, and QA. That ratio improves when reporting runs on a stable, CRM-connected architecture instead of monthly exports assembled by hand.
Connecting Your Dashboard To CRM Revenue Data
The core challenge of connecting ad spend to CRM revenue is that ad platforms and CRMs measure different things. Ad platforms track platform-level events such as page visits, form submissions, and clicks, while CRMs track business outcomes such as qualified leads and closed deals. This mismatch is structural and comes from how each system defines success. Many form fills never become CRM records because of spam, unqualified leads, duplicates, or non-responsive contacts.
Browser-based pixel tracking widens the gap. Ad blockers, Safari’s Intelligent Tracking Prevention, Firefox protections, and Apple’s App Tracking Transparency framework cause ad platforms to miss conversions from privacy-conscious users who still appear as legitimate CRM pipeline without ad attribution.
Closing this gap requires four coordinated practices that work together as a system.
- Server-Side Tracking – Implement Meta’s Conversions API, Google’s Enhanced Conversions, and LinkedIn’s Conversions API to bypass browser-level signal loss.
- Standardized UTM Conventions – Use consistent UTM naming and CRM field mapping so source data persists from first ad click to closed-won status, because inconsistent tags degrade attribution with each campaign.
- Click ID Capture – Store gclid or fbclid in a dedicated CRM field at capture time, since that field becomes the foundation of reliable offline conversion tracking.
- Lifecycle Stage Events Pushed Back To Ad Platforms – Send qualified lead, opportunity created, and closed-won events back to Google, Meta, and LinkedIn so bidding algorithms optimize toward revenue-correlated outcomes.
SaaSHero applies this approach in every engagement. Campaigns are optimized against CRM data rather than form submissions, and lifecycle stage events flow back into the ad platforms to improve algorithmic targeting.
Five Dashboard Pitfalls B2B SaaS Teams Should Avoid
Even with strong tools, dashboards fail when teams fall into predictable traps. The five pitfalls below cause the most damage for B2B SaaS companies, and each has a clear fix.
- Relying On Last-Click Attribution – Last-click attribution compresses a multi-week, multi-stakeholder B2B buyer journey into a single click, which pushes teams to over-invest in bottom-funnel channels while starving demand generation. Use multi-touch attribution for long B2B cycles.
- Ignoring CRM Integration – A dashboard that stops at the form fill cannot answer the board’s revenue questions. Connect Salesforce or HubSpot as a required first step.
- Tracking Vanity Metrics – Vanity metrics such as cost per click and cost per lead reflect activity, not the revenue outcomes that matter. Track pipeline created, CAC, and payback period instead.
- Failing To Automate Data Refreshes – Manual exports break when platforms change their APIs or retention policies. Automate data collection to avoid gaps.
- Misaligning With Board KPIs – Reporting in marketing language such as impressions and CTR when the board speaks finance such as CAC payback and pipeline coverage creates a translation problem that erodes confidence. Report in finance language.
Why SaaSHero Delivers Revenue-Connected Reporting
B2B SaaS companies that lack internal resources to build and maintain revenue-connected dashboards can use SaaSHero as a complete solution. SaaSHero operates as an outsourced inbound growth team for B2B companies, with one team owning strategy and execution across paid media, creative, landing pages, and reporting while optimizing everything against CRM revenue data.

SaaSHero builds reporting inside the client’s own CRM, either Salesforce or HubSpot, with Looker Studio dashboards alongside. Platform-side metrics and CRM-side outcomes appear in one view instead of being reconciled by hand each month. Dashboards show pipeline created by channel, cost per SQL, CAC, and payback period, which match the metrics a board actually asks about. Campaigns are optimized against lifecycle stage events rather than form submissions, which changes which audiences the ad platforms prioritize.

SaaSHero has managed over $60 million in ad spend for B2B SaaS companies and holds Google Premier Partner status, a designation reserved for the top 3% of agencies. Every client owns their accounts, assets, and data throughout the engagement and after it.

See Revenue-Connected Reporting In Action and explore how it can reshape your board conversations.
Frequently Asked Questions
What Is The Best Free Adtech Reporting Dashboard?
Looker Studio with a Supermetrics connector is the most common free-to-low-cost option for teams in the Google ecosystem. Looker Studio itself is free and offers strong visualization flexibility. It still requires third-party connectors to pull data from ad platforms, and those connectors carry their own costs and maintenance burden. Looker Studio also does not natively connect to CRM revenue data, so building that connection requires custom work, technical expertise, and ongoing maintenance as platforms update their APIs. For B2B SaaS teams that need to answer revenue questions, a free dashboard that stops at marketing data creates hidden costs in hours spent reconciling reports and decisions made on incomplete information.
How Do I Connect My Ad Dashboards To Salesforce Or HubSpot?
Connecting ad dashboards to Salesforce or HubSpot requires several components that work together. First, click IDs such as gclid, fbclid, and li_fat_id must be captured in a dedicated CRM field at the moment of form submission, not generated later. Second, UTM parameters must follow a consistent naming convention and be mapped to CRM fields so source data survives from first click to closed-won. Third, offline conversion imports such as Google Ads Offline Conversions, Meta’s Conversions API, and LinkedIn’s Conversions API send CRM-verified revenue events back to the ad platforms and close the loop. Teams running both HubSpot and Salesforce need a stable sync architecture that assigns one system as the source of record for each object type and defines conflict-resolution rules before enabling the connector. The most reliable implementations use server-side tracking to bypass browser-level signal loss from ad blockers and privacy restrictions.
What Is The Difference Between A Dashboard And A Report?
Dashboards are real-time, interactive views of current performance data. They support daily or weekly decision-making, such as monitoring active campaigns, spotting anomalies, and adjusting spend allocation. Reports are periodic, static summaries of historical performance that serve a specific audience, such as a board, a CFO, or a quarterly review, and cover a defined time window. Effective B2B SaaS marketing teams use both a live CRM-connected dashboard for operational decisions and a structured monthly or quarterly report for board-level communication. Problems arise when teams treat a static report as a substitute for a live dashboard because the data is already weeks old by the time the report appears.
How Often Should I Update My Adtech Dashboard?
Update frequency should match the decision cadence the dashboard supports. Real-time or daily refreshes work well for active campaign optimization, such as catching budget pacing issues, flagging underperforming ad sets, and monitoring conversion volume. Weekly refreshes support trend analysis and channel-mix decisions. Monthly data fits board reporting, where the focus is pipeline contribution and CAC payback over a meaningful period rather than yesterday’s click-through rate. CRM data such as qualified leads, opportunities, and closed-won deals moves on a different timeline than ad platform data. A dashboard that refreshes ad metrics daily but only pulls CRM outcomes weekly will show a misleading gap between spend and results. Teams must align refresh cadences across both data sources through configuration.
Why Do My Ad Platform Numbers Never Match My CRM Numbers?
The mismatch between ad platform conversions and CRM records comes from how each system attributes credit. Ad platforms use their own attribution windows. Google Ads defaults to a 30-day click window. Meta defaults to a 7-day click and 1-day view window. These windows rarely match B2B sales cycles that run 30 to 180 days. Each platform independently counts the eventual conversion as its own, so a single buyer who interacted with LinkedIn, Google Display, and branded search may appear as three separate conversions across platforms while generating one CRM record. Browser-based pixel tracking also misses conversions from users with ad blockers or privacy-protective browsers. CRM setups often default to first-touch or last-touch attribution, which does not align with any ad platform’s model.
The fix requires server-side tracking, standardized UTM conventions, a neutral attribution layer above the individual platforms, and a single CRM-connected reporting view that resolves discrepancies instead of reproducing them. Talk To SaaSHero to evaluate whether your current dashboard can answer the board’s most important revenue questions.