




Written by: Aaron Rovner, Founder, Saas Hero | Last updated: June 19, 2026
Key Takeaways for SaaS Revenue Leaders
- B2B SaaS companies now face investor pressure to prove unit-economic viability through CAC, LTV, and CAC payback metrics before scaling paid acquisition spend.
- Adtech agency billing models directly impact CAC, since percentage-of-spend models reward budget inflation, while flat-fee retainers align agency success with client efficiency.
- Competitor conquesting campaigns that target high-intent keywords like pricing, alternatives, and reviews can significantly compress CAC when paired with intent-matched landing pages.
- Accurate LTV:CAC measurement requires GCLID-to-CRM tracking that connects ad spend directly to closed-won revenue rather than relying on last-click attribution.
- Audit your CAC visibility with SaaSHero before increasing ad spend.
How Adtech Revenue Models Shape LTV and Payback
The agency billing model a SaaS company selects has a direct and measurable effect on its unit economics. A percentage-of-spend model, where an agency charges 10–20% of monthly ad budget, creates a structural conflict of interest. An agency earning 15% of a $50,000 monthly budget generates $7,500 per month. If that same agency recommends cutting spend to $30,000 because efficiency data supports it, their revenue drops to $4,500. The financial incentive points toward budget inflation, not capital efficiency.
The consequence for the client is inflated CAC. The median CAC across SaaS companies is $702 per ProfitWell data. Agencies billing on percentage-of-spend have no structural reason to reduce that figure.
SaaSHero operates on a flat monthly retainer tiered by spend band, not by spend volume within a band. A client spending $12,000 per month and a client spending $24,000 per month pay the same retainer within the $10k–$25k tier. When SaaSHero recommends a budget increase, the recommendation is driven by performance data, not fee expansion. This decoupling of agency revenue from client spend creates the foundation for trustworthy CAC improvement. Combined with month-to-month contracts, which require SaaSHero to re-earn the engagement every 30 days, the model ties agency survival directly to client LTV outcomes.
Real CAC Calculations from Google Ads and LinkedIn Spend
Revenue leaders need channel-level CAC, not generic formulas. A more useful calculation isolates closed-won ARR by source and then evaluates payback.
In the first scenario, a transit SaaS company running Google Ads at $15,000 per month generated $504,758 in net new ARR over 12 months. Total paid spend for the year was $180,000. Dividing total spend by closed-won customers produces a channel-specific CAC that, when measured against average contract value and gross margin, yields a payback period well inside the 12-month top-quartile threshold.

In the second scenario, an HR Tech company used aggressive paid search and LinkedIn targeting to add 5,000 new customers and achieve an 80-day CAC payback period. That performance directly supported a $70M Series A raise. A fully loaded CAC of $1,800 combined with $150 ARPU and 80% gross margin produces a payback period of approximately 15 months under standard conditions. Compressing that to 80 days requires precise targeting and a landing page architecture that converts high-intent traffic efficiently.
B2B SaaS CAC varies by the mix of organic and paid channels, with adtech often seeing higher costs due to media expenses that can be justified by correspondingly higher LTV. One of the most reliable ways to compress CAC inside paid channels is to focus spend on users already evaluating competing solutions.
Competitor Conquesting Tactics That Lower CAC
Competitor conquesting targets users who are already in an active evaluation of a competing product. These users have self-selected into a high-intent segment. Conversion rates rise and cost-per-closed-won falls compared with broad-match campaigns that chase cold audiences.
SaaSHero segments conquesting traffic into three psychological intent buckets. Pricing intent keywords, such as “[Competitor] pricing” and “[Competitor] cost,” capture users who are price-sensitive or facing a renewal decision. These users convert best on dedicated pricing comparison pages that lead with a clear cost table and address total cost of ownership directly.

Problem intent keywords, such as “[Competitor] alternatives” and “cancel [Competitor],” reach users experiencing active frustration with their current tool. Problem-solution pages that reference known competitor weaknesses and feature customer migration case studies perform best here. Review intent keywords, such as “[Competitor] reviews” and “[Competitor] vs [Client],” attract users in the consideration phase who need social proof. Review-focused pages that aggregate G2 badges, Capterra ratings, and side-by-side feature comparisons address this segment.
Negative keyword hygiene keeps conquesting efficient. Negating the bare competitor brand name removes navigational traffic, such as users searching for the login page, from the campaign. SaaSHero’s conquesting framework focuses only on modifier-qualified queries like pricing, alternatives, and vs. This approach filters out navigational intent and targets only evaluative or purchase-ready users. As a result, wasted spend drops and CAC compresses without reducing volume from qualified segments.

Schedule a conquesting audit to see how competitor campaigns would perform against your current CAC benchmarks.
LTV:CAC Benchmarks by Vertical and Spend Band
The table below presents 2026 benchmark data for LTV:CAC ratios and median CAC by acquisition channel and vertical. Every figure is cited inline.
| Segment / Channel | Median or Average LTV:CAC | Median or Average CAC | Source |
|---|---|---|---|
| B2B SaaS median (all segments) | 3.2:1–3.6:1 | — | recent benchmarks |
| Paid Search / SEM channel | — | $702 | ProfitWell data |
| Product-Led Growth channel | — | $702 | OpenView 2026 SaaS Benchmarks |
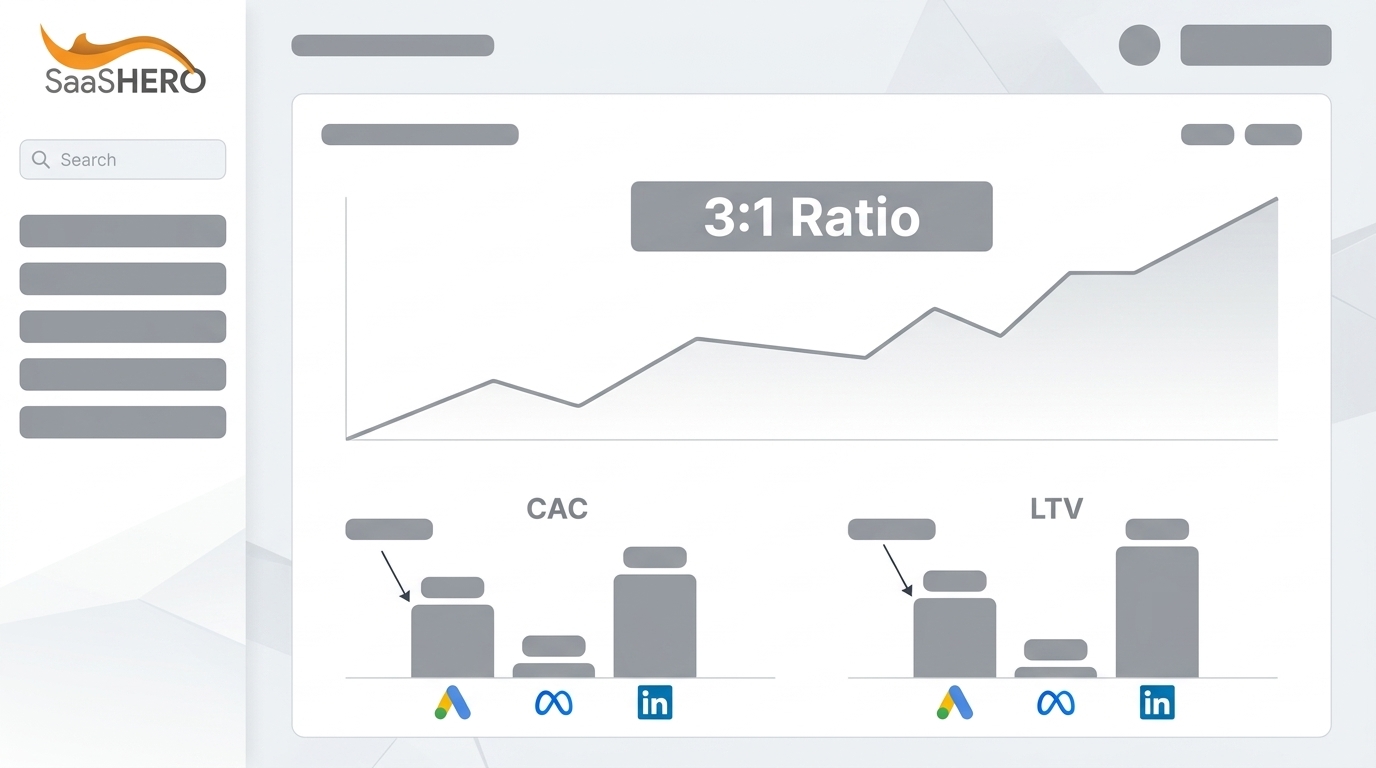
A healthy LTV:CAC benchmark for most B2B SaaS companies is a minimum of 3:1, with ratios of 3:1 to 5:1 considered healthy, meaning companies have significant headroom to invest in paid acquisition before hitting diminishing returns, provided their tracking connects spend to closed-won revenue accurately.
Tracking Setup That Connects GCLID to Closed-Won Revenue
LTV:CAC ratios are only as accurate as the data feeding them. Many SaaS companies measure CAC using last-click attribution from Google Analytics, which systematically undervalues top-of-funnel paid activity and misattributes closed-won revenue to brand search. Accurate payback measurement requires passing the Google Click ID (GCLID) from the ad click through the landing page form and into the CRM as a hidden field.
The integration sequence builds a continuous thread from click to revenue. First, auto-tagging is enabled in Google Ads so every click appends a GCLID parameter to the destination URL. This parameter becomes the identifier that links ad spend to a specific visitor. Second, the landing page form captures that parameter in a hidden field and stores it alongside the lead record in HubSpot or Salesforce, which preserves the connection as the lead moves through the funnel.
Third, when a deal closes, the GCLID on the contact record is matched back to the originating campaign, ad group, and keyword. That match reveals exactly which ad and query produced the revenue. Fourth, closed-won ARR is imported back into Google Ads as an offline conversion. This import allows the bidding algorithms to focus on revenue rather than form fills.
This architecture transforms campaign reporting from click-volume dashboards into closed-won ARR attribution. B2B teams should track pipeline by channel and campaign, SQL rate, win rate, CAC, payback period, and LTV:CAC as core revenue metrics, not opens, clicks, or impressions. Without GCLID-to-CRM tracking, none of those metrics can be calculated accurately at the channel level.
Common Adtech Traps and How to Diagnose Them
Vanity metric reporting. Agencies that report on impressions, CTR, and click volume without connecting those figures to pipeline or closed-won ARR obscure performance. Diagnostic question: Can your agency show you cost-per-closed-won-customer by campaign, not just cost-per-lead?
Misaligned incentives. A percentage-of-spend billing model gives the agency a financial reason to recommend budget increases regardless of efficiency. With 2026 SaaS benchmarks reporting a median of $2.00 CAC per $1 of new ARR, budget inflation without efficiency improvement worsens payback periods directly. Diagnostic question: Does your agency’s fee increase when you increase spend?
Poor message match. Sending competitor conquesting traffic to a generic homepage produces low conversion rates because the user’s specific intent, such as pricing comparison, migration path, or feature validation, is not addressed. Diagnostic question: Does each high-intent campaign segment land on a dedicated page built for that intent?
Absent negative keyword hygiene. Broad match and phrase match campaigns without structured negative keyword lists bleed budget into navigational and informational queries that never convert. Diagnostic question: When did your agency last audit and expand the negative keyword list?
Three Paid Acquisition Scenarios by Maturity Level
Bootstrap founder ($500K ARR). The founder runs Google Ads manually on weekends. CAC is unknown because there is no CRM integration. The immediate priority is establishing GCLID-to-CRM tracking, building one competitor conquesting campaign for the highest-volume alternative keyword, and moving to a flat-fee management model that does not consume 10% of total revenue. SaaSHero’s Dedicated Campaign Manager tier at $1,250 per month for up to $10K in spend provides professional management at a cost lower than a junior hire, with no lock-in contract.
Frustrated VP of Marketing (Series B, $5M–$10M ARR). The current agency delivers monthly PDF reports showing impressions and CTR. The CEO asks about pipeline and CAC. The agency bills 15% of a $50K monthly budget, or $7,500 per month, with no revenue attribution. The migration path replaces percentage-of-spend billing with a flat retainer, implements offline conversion tracking in Salesforce, and rebuilds campaign reporting around SQL rate, CAC, and payback period. Top-performing SaaS companies often achieve CAC payback under 12 months, so closing the gap from the median requires both tracking accuracy and spend efficiency.
Post-funding scaler (Series A, $10M raised). Aggressive Q1 growth targets require deploying $30K per month efficiently without a three-month hiring cycle. The priority is rapid deployment of competitor conquesting landing pages, GCLID integration with the existing CRM, and a full-team management model that can scale spend across Google Ads and LinkedIn simultaneously. SaaSHero’s Full Marketing Team tier covers multi-channel management under a flat retainer, with setup completed in days rather than months.
Talk to our team to identify which scenario matches your current stage and what a realistic payback timeline looks like.
Frequently Asked Questions
What is a good LTV:CAC ratio for B2B SaaS?
The widely accepted minimum for sustainable growth is 3:1, meaning the lifetime value of a customer is at least three times the cost to acquire them. Recent benchmarks report median B2B SaaS LTV:CAC ratios of 3.2:1–3.6:1. A ratio below 2:1 signals that acquisition costs consume too large a share of customer revenue and typically indicates either inflated CAC, high churn compressing LTV, or both.
How is CAC payback period calculated for a SaaS company?
CAC payback period is calculated by dividing the total cost to acquire a customer by the gross margin generated per customer per month. Using the HR Tech example from earlier, which achieved a 15-month payback under standard conditions, compressing that timeline requires either reducing CAC through better targeting and negative keyword hygiene, increasing ARPU through expansion revenue, or improving gross margin through operational efficiency. Recent surveys show the median payback period is approximately 20 months, while top performers reach sub-12-month payback and product-led growth companies can reach even lower medians.
Why does the agency billing model affect my CAC?
A percentage-of-spend agency earns more revenue when your ad budget increases, regardless of whether that increase improves efficiency. This structure creates a direct financial incentive to recommend budget growth over budget optimization. The result is inflated spend, higher CAC, and longer payback periods. A flat-fee model removes that incentive entirely. When the agency fee does not change based on spend volume within a tier, every budget recommendation is driven by performance data rather than fee expansion. For SaaS companies already operating at a median of $2.00 CAC per $1 of new ARR, eliminating agency-driven budget inflation becomes a direct lever on unit economics.
What tracking setup is required to measure true paid acquisition CAC?
Accurate paid CAC measurement requires passing the Google Click ID (GCLID) from the ad click through the landing page form into the CRM as a hidden field. When a deal closes, the GCLID on the contact record is matched to the originating campaign and keyword, and closed-won ARR is imported back into Google Ads as an offline conversion. This setup allows campaign bidding algorithms to focus on revenue rather than form submissions and enables channel-level CAC reporting that connects ad spend directly to closed-won ARR. Without this integration, CAC calculations rely on last-click attribution, which systematically misattributes revenue and produces inaccurate payback period estimates.
Audit Your Current CAC/LTV Visibility Before Scaling Spend
Scaling paid acquisition without accurate CAC and LTV visibility compounds inefficiency rather than correcting it. The diagnostic questions in this guide, such as whether your agency can show cost-per-closed-won by campaign, whether their fee increases with your spend, whether conquesting traffic lands on intent-matched pages, and whether GCLID data flows into your CRM, highlight the specific gaps that separate median-performing programs from top-quartile ones.
The benchmarks are clear. A 3:1 LTV:CAC ratio is the floor. Recent benchmarks indicate a median payback period of approximately 20 months, with the best performers reaching the sub-12-month threshold mentioned earlier. With proper tracking and aligned agency incentives, many SaaS companies have significant headroom in their LTV:CAC ratios. The distance between where most programs operate and where the best ones perform is not a media budget problem. It is a structural and tracking problem that a flat-fee, revenue-focused adtech partner is built to solve.
Start with a free CAC assessment to map your current paid acquisition program against these benchmarks and identify the highest-leverage changes available at your current spend level.