




Written by: Aaron Rovner, Founder, Saas Hero | Last updated: August 7, 2026
Key Takeaways for B2B SaaS Attribution
- Single-touch attribution models fail for B2B SaaS because 84–104 day sales cycles and 6–10 stakeholder buying committees require multi-touch, account-level tracking.
- A 7-step system connects Google Ads and LinkedIn Ads spend to closed-won ARR, CAC payback, and LTV:CAC through server-side tracking, standardized UTMs, CRM stage mapping, and offline conversion uploads.
- Account-based W-shaped attribution with 180-day lookback windows and warehouse fact tables in BigQuery deliver accurate revenue credit across long buying journeys.
- Daily offline uploads of closed-won deals back to ad platforms improve Smart Bidding performance by 30–50% by optimizing toward revenue instead of form fills.
- SaaSHero already executes this exact attribution stack for mid-market B2B SaaS clients; book a discovery call to replace click reporting with Net New ARR reporting.
Core Attribution Terms B2B Teams Must Share
Align your team on these definitions before you start implementation.
- UTM parameters: Query-string tags appended to URLs (utm_source, utm_medium, utm_campaign, utm_content, utm_term) that identify the traffic source in analytics and CRM systems. Inconsistent parameters such as utm_source=google versus utm_source=Google_Ads create permanent data splits that undermine full-funnel accuracy.
- GCLID: Google Click Identifier, a unique parameter appended to landing page URLs by Google Ads. It is the primary key for matching an ad click to a CRM record and uploading offline conversions back to the platform.
- Offline conversion upload: The process of sending CRM-based outcomes, such as qualified leads, opportunities, and closed-won deals, back to Google Ads or LinkedIn Ads so the platforms can optimize bidding toward revenue rather than form fills.
- Account-level attribution: Aggregating all stakeholder touchpoints under a single company profile rather than treating each contact as an independent lead. Gartner states the average B2B buying group consists of 6–10 decision-makers, each conducting independent research, making contact-level attribution inadequate for committee-driven deals.
- Incrementality: The causal lift a channel produces, meaning conversions that would not have occurred without the ad exposure. This differs from attribution, which allocates credit to observed touchpoints regardless of causality.
The 7-Step Full-Funnel Attribution Checklist
- Set up server-side CAPI and enhanced conversions
- Standardize UTM taxonomy and identity resolution for buying committees
- Map every funnel stage to CRM events and revenue milestones
- Choose and blend attribution models with sales-cycle multipliers
- Build the attribution fact table in BigQuery or equivalent warehouse
- Push closed-won conversions back to Google and LinkedIn via offline uploads
- Create an executive dashboard that ties spend to Net New ARR, payback, and pipeline velocity
Step 1: Recover Lost Signal with Server-Side CAPI and Enhanced Conversions
Purpose: Recover the conversion signal lost to ad blockers, Safari Intelligent Tracking Prevention, and iOS privacy restrictions before building any attribution model on incomplete data.
Privacy changes including iOS App Tracking Transparency, Safari Intelligent Tracking Prevention, and ad blockers cause 20–50% signal loss in B2B tracking. Server-side tracking recovers 20–40% of conversions that client-side pixels miss.
Actions:
- Deploy Google Tag Manager Server-Side on a first-party subdomain (for example, metrics.yourdomain.com) to create the foundation for server-side tracking.
- After the server container is live, enable Google Enhanced Conversions for Leads, which uses hashed first-party user-provided data such as email addresses to attribute offline conversions back to Google Ads campaigns. Starting April 2026, Google combined enhanced conversions for web and leads into a single unified on/off setting accepting user-provided data from website tags, Data Manager, and API connections simultaneously.
- Apply the same server-side approach to LinkedIn by implementing the Insight Tag via server-side forwarding and connecting the LinkedIn Conversions API for form-fill and demo-request events.
- Finally, integrate a consent management platform (CMP) so only consented events are forwarded via server-side syncs, and conversions from users without appropriate consent are excluded to maintain GDPR, CCPA, and platform compliance.
Validation checkpoint: Compare server-side event counts against client-side pixel counts in GA4. A healthy implementation shows a 15–40% increase in measured events on the server-side feed.
Step 2: Standardize UTMs and Resolve Identities Across Buying Committees
Purpose: Create a single, consistent thread that connects every ad click to a CRM account record across all stakeholders in a buying committee.
Mid-market B2B deals close in 8–10 touches on average (SMB <$30K ACV: 5–7 touches), so multiple people at the same company arrive via different campaigns, devices, and sessions. Standardized taxonomy and identity resolution prevent those touches from fragmenting into unrelated records.
Actions:
- Define and enforce a UTM naming convention across every channel: utm_source (google / linkedin), utm_medium (cpc / paid-social), utm_campaign (use a consistent slug format), utm_content (ad creative ID), utm_term (keyword or audience segment).
- Capture the GCLID and LinkedIn Click ID in a hidden form field on every landing page and store both in the CRM contact record at form submission.
- Implement account-level identity resolution by stitching fragmented sessions into unified Account IDs using IP addresses, email domains, and device fingerprints, then aggregating all stakeholder touchpoints under a single company profile.
- Add a self-reported “How did you first hear about us?” field on every demo request form to capture dark touchpoints such as podcasts, peer recommendations, and conferences that pixel-based tracking cannot observe.
Validation checkpoint: Pull a sample of 20 recent CRM contacts and confirm each has a populated utm_source, utm_campaign, and GCLID or click ID field. A match rate below 70% indicates a form or tag implementation gap.
Step 3: Tie Every Funnel Stage to CRM Events and Revenue
Purpose: Translate the abstract sales cycle into discrete, timestamped CRM events that attribution models can use to assign credit and calculate pipeline velocity.
B2B SaaS organizations typically encounter 27–76 touchpoints over 92–211 day cycles, with multi-touch models needing 200+ monthly conversions for statistical stability. Each stage must exist as a named CRM event with a date, owner, and associated account.
Actions:
- Define lifecycle stages in HubSpot or Salesforce: Anonymous Visit → MQL → SQL → Demo Held → Opportunity Created → Proposal Sent → Closed-Won / Closed-Lost.
- Assign a monetary value to each stage based on historical win rates. For example, if 20% of SQLs close at $30K ACV, an SQL carries $6,000 in pipeline value.
- Enforce contact-to-deal associations so every closed-won deal has at least one associated contact with a tracked first touch. Deals without contacts become invisible to attribution.
- Set attribution lookback windows to at least 1.5× your median sales cycle. The median B2B SaaS sales cycle is 84 days, with enterprise deals often taking 90–180+ days and the 90th percentile reaching 281 days. For most mid-market teams, a 180-day window is the practical minimum.
Validation checkpoint: Run a CRM report showing the average days between each stage transition. If the MQL-to-SQL gap exceeds 30 days, your attribution window is likely too short to capture the originating ad touch.
Step 4: Blend Attribution Models for Long B2B Sales Cycles
Purpose: Select a model that distributes credit across the full buying journey rather than collapsing it onto a single touch.
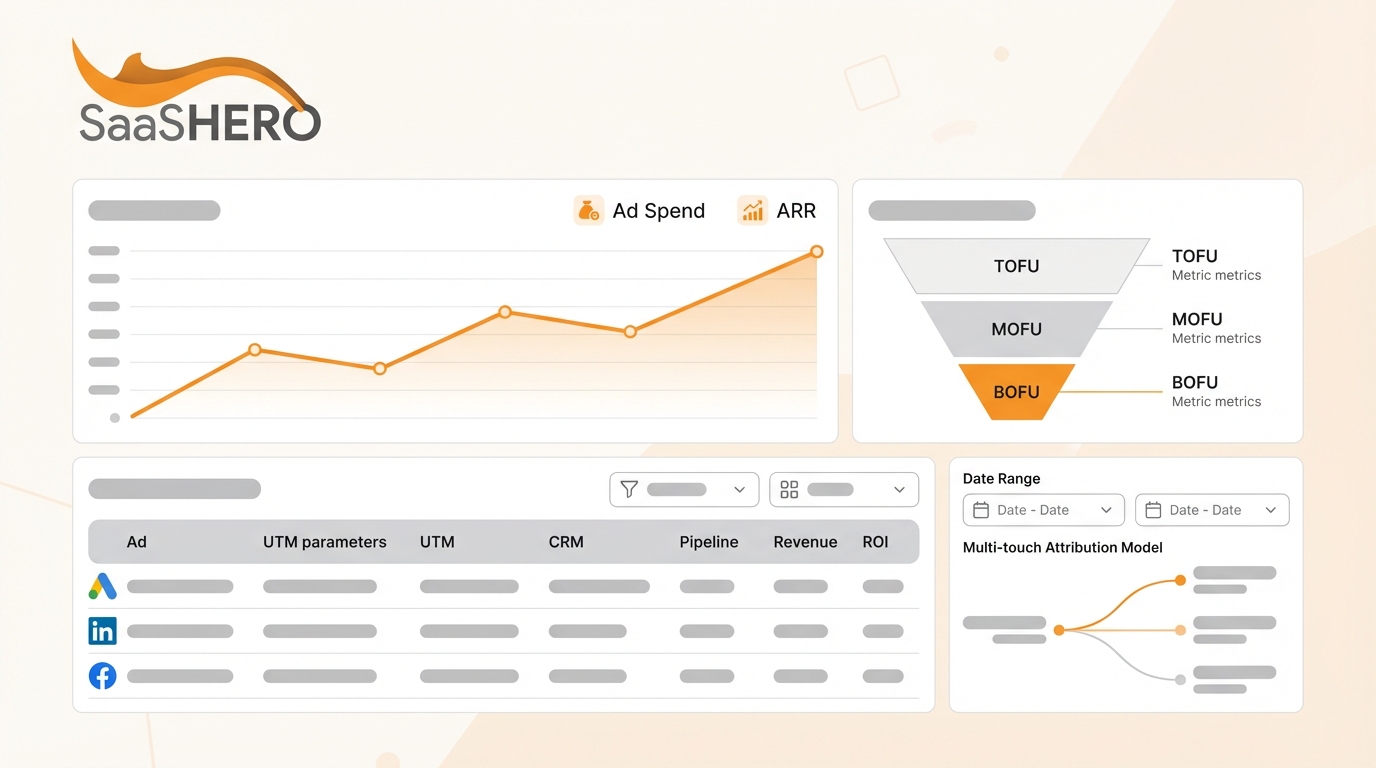
For mid-market B2B SaaS with the extended sales cycles outlined in Step 3 and the buying committees described earlier, account-based multi-touch attribution is the strongest primary model because it rolls credit up to the account level rather than fragmenting across individual contacts. Teams with fewer than 300 monthly conversions should avoid data-driven algorithmic models, because data-driven attribution models require at least 300 conversions over 30 days to generate statistically meaningful results.
The recommended blend for most mid-market B2B SaaS teams is a W-shaped model that allocates 30% credit to First Touch, 30% to Lead Creation, 30% to Opportunity Creation, and 10% to middle touches. Run first-touch and last-touch views in parallel as sanity checks. If assisted conversions outnumber last-click conversions by more than 3x, last-touch attribution is systematically undervaluing upper-funnel channels.
Validation checkpoint: Compare channel-level revenue credit under first-touch versus W-shaped models. Channels that gain significant credit under W-shaped but not first-touch are your undervalued nurture assets, typically LinkedIn retargeting and branded search.
Step 5: Build a Warehouse Fact Table for Attribution in BigQuery
Purpose: Create a single source of truth that joins ad spend, click data, CRM pipeline events, and closed-won revenue outside the limitations of any individual platform’s native reporting.
Actions:
- Use Fivetran, Stitch, or Airbyte to replicate Google Ads, LinkedIn Ads, HubSpot or Salesforce contacts, deals, and activities into BigQuery on a daily schedule.
- Build a fact table with one row per touchpoint, keyed on Account ID, Contact ID, Session ID, utm_campaign, utm_source, ad spend by day, and CRM stage event with timestamp.
- Add a master customer ID that spans CRM, customer success, support, and finance systems so post-purchase events such as renewals and expansion revenue can be joined to original acquisition touchpoints.
- Apply your chosen attribution model weights, such as W-shaped or position-based, as a SQL transformation layer so the output table contains fractional revenue credit per touchpoint.
Validation checkpoint: The sum of fractional revenue credit across all touchpoints for a given closed-won deal must equal the deal’s ACV. Any discrepancy indicates a join failure or duplicate touchpoint record.
Step 6: Feed Closed-Won Revenue Back to Google and LinkedIn
Purpose: Feed actual revenue outcomes back to the ad platforms so Smart Bidding and LinkedIn’s optimization algorithms learn to target buyers, not just form-fillers.
Actions:
- For Google Ads, use the Data Manager API. Starting June 15, 2026, the legacy ConversionUploadService route for offline conversion imports (including enhanced conversions for leads) was blocked for new adopters or developer tokens without recent usage. Upload GCLID, conversion name, conversion time, and deal ACV as conversion value. Google Ads supports uploading offline conversions with GCLID up to 90 days after the click.
- For LinkedIn Ads, use the LinkedIn Conversions API to send closed-won events with hashed email as the matching key. Create separate conversion actions for SQL, Demo Held, and Closed-Won so the platform can optimize toward the highest-value stage.
- Hash all personally identifiable information, including email, phone, and name, using SHA-256 before transmission. Teams should hash personal identifiers using SHA-256 before transmission to ad platforms, set data retention schedules aligned with purpose limitation, and ensure Data Processing Agreements are in place with every vendor.
- Schedule uploads daily. For Smart Bidding strategies to optimize effectively on offline conversion imports, advertisers should upload conversions at least daily and assign values to the conversions.
Validation checkpoint: In Google Ads, navigate to Tools → Conversions → Diagnostics. Confirm the “Closed-Won” conversion action shows a match rate above 60%. A lower rate indicates GCLID capture is failing at the form level.
Step 7: Build an Executive Dashboard for ARR, CAC, and Velocity
Purpose: Surface the four metrics a CFO and board care about most, Net New ARR sourced, CAC, CAC payback period, and LTV:CAC, broken down by ad channel and campaign.
Actions:
- Build a Looker Studio or Looker dashboard connected to your BigQuery attribution fact table. Focus on channel-level spend versus fractional closed-won ARR, blended CAC by channel, and CAC payback in days, calculated as CAC divided by monthly gross margin per customer.
- Add a pipeline velocity metric. Pipeline velocity is calculated as (Opportunities × Deal Value × Win Rate) ÷ Sales Cycle Length in days and reveals which channels generate revenue fastest rather than simply cheapest or highest volume.
- Include a “dark funnel” row that aggregates self-reported attribution responses alongside modeled attribution to show the CFO the full picture, not just the tracked portion.
- Set a weekly automated email export of the dashboard to the VP of Marketing, RevOps lead, and CFO. Bi-weekly strategy reviews with SaaSHero use this dashboard as the single source of truth.
Validation checkpoint: The dashboard’s total ad-sourced ARR should reconcile to within 10% of the CRM’s closed-won revenue filtered by marketing-sourced deals. A gap larger than 10% indicates a CRM association hygiene problem from Step 3.
Measurement and Validation: Align ROAS with CRM Pipeline
Ad platforms report ROAS based on their own attribution logic, which will always differ from your warehouse model. The gap provides insight into tracking and model design rather than signaling failure.
Flag gaps caused by three specific conditions. First, long cycles, because a campaign that ran 120 days ago may have generated deals that closed last week, and the platform’s default 30-day conversion window will miss them entirely. Extend Google Ads conversion windows to match your sales cycle length. Second, dark-funnel activity, because 31% of SaaS revenue came from opportunities appearing in Salesforce with no prior logged sales activity, which requires probabilistic matching and self-reported attribution fields to reconcile dark-funnel influence with CRM records. Third, multi-device journeys, because a buyer who clicks a LinkedIn ad on mobile and converts on desktop will appear as two separate sessions without server-side identity resolution.
The reconciliation process compares three numbers monthly: platform-reported conversions, CRM marketing-sourced deals, and warehouse-attributed fractional ARR. Persistent divergence above 15% triggers a tracking audit.
Advanced Layers: Incrementality, MMM, and Sales Alignment
Teams that complete the 7-step stack can add three advanced layers to improve decision quality.
Incrementality testing measures true causal lift rather than attributed credit. B2B SaaS teams should implement incrementality tests quarterly on their top three channels by spend, with each test running 2–4 weeks plus 2–4 weeks of observation. For account-based programs, design holdouts at the account level by suppressing or allowing ads for all known contacts at a given company domain to prevent buying-committee contamination.
Marketing Mix Modeling (MMM) uses aggregate spend and revenue data rather than user-level tracking, which makes it far less exposed to privacy restrictions. B2B SaaS companies should prioritize MMM once annual media spend exceeds $3 million or offline and non-trackable channels exceed 20% of budget. Mature teams use MMM for quarterly budget allocation, multi-touch attribution for weekly campaign optimization, and incrementality testing as the causal verification layer.
Sales alignment depends on a shared SQL definition between marketing and sales. Attribution models only perform as well as the CRM data they consume. If sales reps log opportunities inconsistently or skip the Demo Held stage, the fact table produces noise. A monthly 30-minute RevOps sync to audit stage-transition data quality keeps the system reliable.
Recap Checklist, Maturity Roadmap, and FAQ
The complete implementation checklist:
- Server-side CAPI and Enhanced Conversions deployed with CMP integration
- UTM taxonomy enforced across all channels and GCLID captured in CRM
- CRM lifecycle stages defined with monetary values and contact-to-deal associations
- Attribution model selected, typically W-shaped for most mid-market teams, with a 180-day or longer lookback window
- BigQuery attribution fact table built and reconciled to CRM closed-won revenue
- Daily offline conversion uploads to Google Ads Data Manager API and LinkedIn Conversions API
- Executive dashboard live with Net New ARR, CAC, payback, and pipeline velocity
Next steps vary by team maturity. Teams spending under $10K per month on ads should start with Steps 1–3 and use HubSpot’s native attribution reports as a proxy for the warehouse until deal volume justifies BigQuery. Teams spending $10K–$50K per month should execute all seven steps within 60 days, prioritizing the offline upload in Step 6 first because it immediately improves Smart Bidding performance. Teams spending above $50K per month should add incrementality testing in quarter two and begin MMM planning once annual spend crosses $1.5M.
SaaSHero operates on a flat monthly retainer with no percentage-of-spend billing and no long-term lock-in contracts. The TripMaster engagement produced $504,758 in Net New ARR within 12 months. The TestGorilla engagement achieved an 80-day CAC payback period, which justified a $70M Series A raise.

Frequently Asked Questions
How long does it take to implement this full-funnel attribution stack?
A team with an existing HubSpot or Salesforce CRM, Google Ads, and LinkedIn Ads accounts can complete Steps 1 through 6 in 30–45 days. The server-side tracking setup and CMP integration typically take one to two weeks. UTM standardization and CRM stage mapping take another one to two weeks. The BigQuery fact table and offline upload automation require a further two to three weeks of engineering time. The executive dashboard in Step 7 can be built in parallel and is usually live within the first 30 days. SaaSHero handles the full implementation as part of its onboarding process, which includes a one-time setup fee covering tracking architecture, CRM configuration, and initial campaign structure.
What roles are required to run this attribution system?
The minimum viable team includes a RevOps or marketing operations lead who owns CRM hygiene and UTM governance, a paid media manager who configures the ad platforms and manages offline uploads, and a data analyst or engineer who builds and maintains the BigQuery fact table. For teams without an in-house data engineer, SaaSHero’s Full Marketing Team tier includes the attribution architecture as part of the retainer. The VP of Marketing or CMO owns the executive dashboard and the monthly reconciliation review. Sales leadership must participate in the SQL definition alignment process, because without their buy-in the CRM data quality that powers the entire system degrades quickly.
Does this system work for teams spending less than $10,000 per month on ads?
This system works at lower spend levels with a lighter footprint. At sub-$10K monthly spend, the BigQuery warehouse build is often premature because deal volume is too low to produce statistically stable attribution weights. Teams at this stage should implement Steps 1 through 3 fully, including server-side tracking, UTM standardization, and CRM stage mapping, and then use HubSpot’s built-in multi-touch attribution reports or Salesforce’s campaign influence model as a proxy. The offline conversion upload in Step 6 is still worth implementing at any spend level because it improves Smart Bidding quality immediately. SaaSHero’s Dedicated Campaign Manager tier starts at $1,250 per month for up to $10K in ad spend and includes the tracking setup needed to execute the foundational steps.
How often should the attribution model be recalibrated?
Attribution model weights should be reviewed quarterly. The review compares the model’s channel-level credit distribution against incrementality test results and self-reported attribution data. If a channel consistently receives high multi-touch credit but shows low incremental lift in holdout tests, its weight should be reduced. The lookback window should be recalibrated annually or whenever average deal size shifts significantly, because ACV changes alter sales cycle length and therefore the window required to capture originating touchpoints. The UTM taxonomy and CRM stage definitions should be audited monthly in the RevOps sync to catch data quality drift before it corrupts the fact table.
What if a large portion of our pipeline has no attributable touchpoint?
This pattern is normal for B2B SaaS. As noted in the Measurement section, nearly one-third of SaaS revenue arrives without tracked touchpoints, driven by dark-funnel activity including peer recommendations, G2 reviews, podcasts, and direct word-of-mouth. The solution uses a three-layer approach. First, add a self-reported “How did you first hear about us?” field to every demo request form and log the responses as a CRM property. Second, use probabilistic matching in your warehouse to assign partial credit to campaigns that were active during the period when the account first showed engagement signals. Third, run periodic geo-holdout incrementality tests on your highest-spend channels to measure their true contribution to pipeline, including the portion that arrives without a tracked click. SaaSHero incorporates all three layers into its standard reporting framework for clients.
Conclusion: Turn Ad Spend into Provable Net New ARR
The 7-step system in this guide replaces vanity metric reporting with a closed-loop revenue attribution stack that connects every Google Ads and LinkedIn Ads dollar to closed-won ARR, CAC payback, and LTV:CAC. The design remains resilient to privacy changes, because it relies on server-side signal recovery, hashed first-party data, and warehouse-native modeling that survives cookie deprecation and platform policy shifts. The system operates at the account level, because buying committees of 6–10 stakeholders cannot be measured at the contact level without losing most of the journey.
SaaSHero is the only B2B SaaS agency already running this exact stack for clients at scale, on flat monthly retainers, with no percentage-of-spend billing and no long-term contracts. The results are measured in Net New ARR and payback periods, not impressions.