




Written by: Aaron Rovner, Founder, Saas Hero | Last updated: September 4, 2026
Key Takeaways
- Paid traffic costs are rising in 2026, so message match, structure, and revenue-focused design now decide whether cold visitors turn into pipeline.
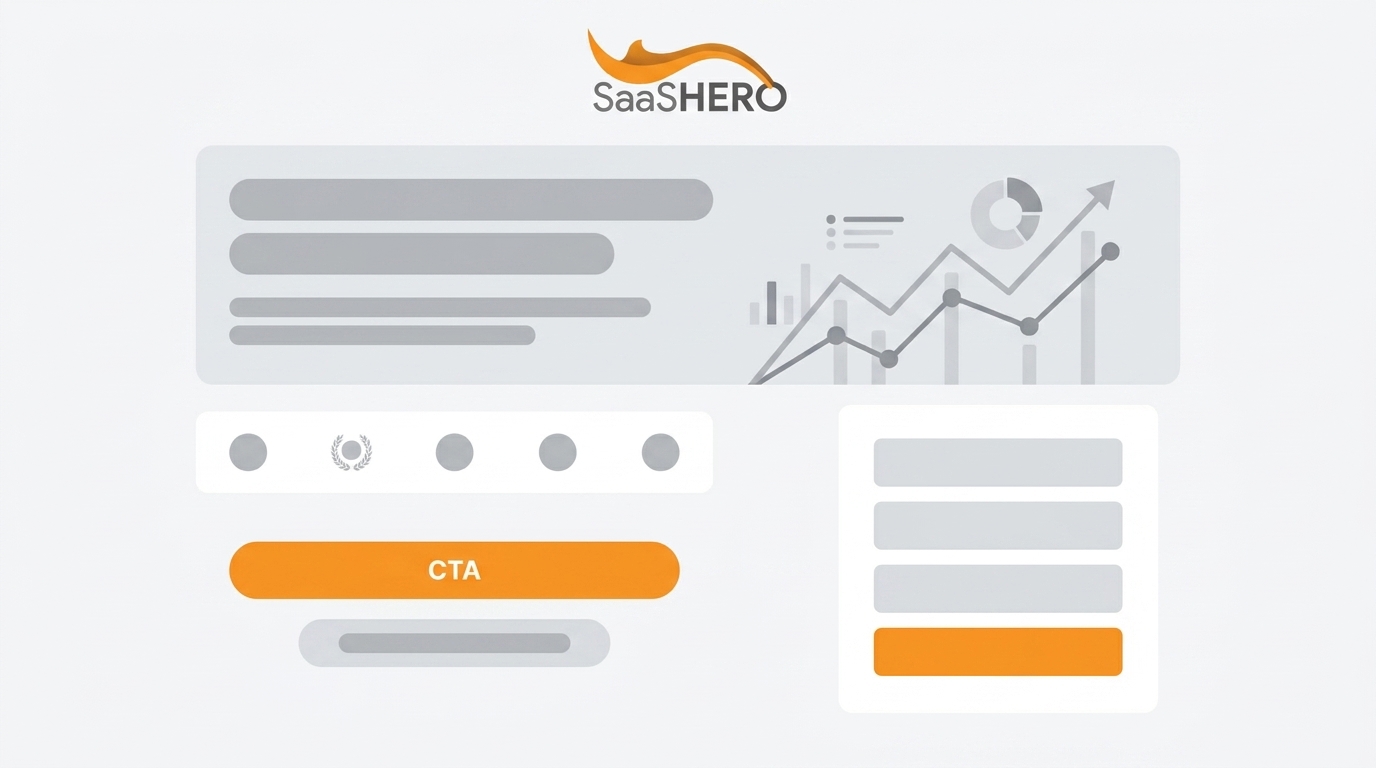
- Above-the-fold elements such as headline, subheadline, hero visual, and a single CTA decide whether visitors stay or bounce. Headline changes alone can shift conversion rates by up to 40%.
- Message match between ad and page, plus traffic-source-specific content, keeps visitors from bouncing and gives cold, retargeting, and high-intent traffic the right level of education and proof.
- Trust signals like logos, named testimonials, and metric case studies, paired with minimal-friction forms, shorten sales cycles and improve lead quality for B2B buying committees.
- Technical tracking tied to CRM sales-ready events and mobile speed improvements are non-negotiable. Partner with SaaSHero to audit your landing page against this checklist and connect the post-click experience to pipeline reporting end to end.
10-Point Quick Checklist for Your Landing Page Sales Audit
- Headline matches the ad promise and names a specific pain or outcome.
- Subheadline expands with a quantifiable result.
- Hero visual shows the product working instead of stock photography.
- Single primary CTA with action-oriented copy such as “Get a Demo.”
- Page mirrors the ad offer and message exactly.
- Social proof includes named testimonials, logos, and metric-driven case studies.
- Form asks only for what sales needs to follow up, such as name, work email, and company.
- Page loads in under 3 seconds on mobile, with LCP under 2.5 seconds.
- Conversion tracking is set up and tied to a CRM sales-ready event.
- Lead source is captured and visible in your CRM for pipeline reporting.
Get a free landing page audit against this checklist and see how optimizing to revenue instead of leads changes your paid performance.
Above the Fold: The First Screen Decides Everything
Nielsen Norman Group research shows visitors spend 57% of their viewing time above the fold. If this section fails, nothing below it matters. For B2B SaaS, cold paid traffic gives you only seconds to prove relevance before visitors bounce.

- Headline matches the ad promise and speaks to a specific pain. An Unbounce analysis of 64,000 landing pages found that changing only the headline shifted conversion rates by up to 40%. If your ad promises “Cut customer churn by 30%,” the headline should repeat that promise. Strong message match delivers one of the fastest pipeline wins.
- Subheadline expands with a quantifiable outcome. A phrase like “Without rebuilding your onboarding flow” tells the visitor how. Specific dollar-value or time-savings claims outperform vague statements by 18–40% on landing page conversion. Clear outcomes help qualified visitors self-select faster and improve lead quality.
- Hero visual shows the product instead of a stock photo. Use a real screenshot, embedded demo, or short product video. Top-quartile SaaS pages use live product imagery instead of staged screenshots. Buyers evaluating a $50K ACV product want to see what they are buying.
- Single primary CTA, high-contrast, and action-oriented. Pages with a single CTA convert at 13.5% versus 10.5% with multiple competing CTAs. “Book a 20-minute demo” outperforms “Get started” by 15–30%. One clear next step creates one clear conversion event for your bidding algorithms.
Offer and Message Match: Align Page Content With Ad Intent
The leading cause of below-benchmark conversion is a relevance gap between the ad and the page. Each traffic source carries different intent, and your page should reflect that intent.
- Page mirrors the ad offer exactly. If the ad promises a “Free ROI Calculator,” the page should lead with that calculator. A sudden switch to a demo request breaks trust and trains visitors to bounce.
- Cold traffic gets education, retargeting gets directness. Cold paid traffic in competitive B2B categories converts at 2–4% as a realistic baseline, while warm traffic can hit 8–15%. Cold visitors need context and objection handling. Retargeting visitors need proof and a clear ask. Match page length and content to awareness stage to avoid both bounce and over-explaining.
- Traffic source benchmarks set your expectations. LinkedIn Ads median conversion for B2B SaaS runs 3–7%, non-branded high-intent Google Search runs 4–8%, and email to a warm list runs 8–18%. A conversion rate that looks weak against email benchmarks may be normal for cold LinkedIn traffic, so judge performance by the right baseline.
Social Proof and Trust: Place Evidence Where Doubt Peaks
CXL eye-tracking research found that high-profile client logos are the strongest single social proof signal. For B2B buyers with a 6.8-person buying committee (Gartner), institutional trust often matters more than individual testimonials.

- Customer logos, especially recognizable ones. Specific logos outperform generic “trusted by hundreds” claims by 10–25% when placed near the CTA. Buyers want to see that companies like theirs already took the risk.
- Named testimonial with title and company. A line like “We cut our sales cycle from 45 to 28 days in the first quarter,” paired with a name, title, and logo, provides real evidence. Metric-specific proof shortens the sales cycle by pre-answering objections.
- Case study with metrics, not just quotes. A result such as “Increased SQLs by 40%” beats a vague “helped us scale.” Your sales team gains ammunition before the first call.
- Trust badges where relevant. Include SOC2, GDPR compliance, and G2 ratings with real scores. Third-party verification badges increase conversion by 15–22%. Enterprise buyers often require compliance proof before they can purchase.
Form and Friction: Design Fields That Protect Pipeline
Each additional form field drops conversion by 5–8% for most B2B forms. Cutting fields without a plan hurts lead quality, so aim for minimum viable friction that still supports your sales process.
- Minimum fields: name, work email, company size. Three-field forms convert at 10.1% versus 3.6% for nine-field forms. Every extra field beyond what sales actually uses costs qualified leads.
- Progressive profiling for repeat visitors. Marketers using progressive profiling report 20–30% improvement in initial form completion. Returning visitors who already converted once should not face the same friction twice.
- Form matches the sales process. If sales follows up by phone, ask for a phone number. If routing depends on company size, include that field. Ask your sales team which fields they actually use in first outreach. Fields that never inform follow-up add friction without downstream benefit.
- Work email required and consumer domains screened. Simple email validation blocking Gmail and Yahoo reduces wasted sales follow-up by 15–25%. Sales time remains the most expensive resource in your funnel.
Mobile and Speed: Fix Hidden Conversion Losses
Between 25–45% of B2B paid traffic arrives via mobile, and mobile conversion rates run 30–60% lower than desktop on most B2B SaaS pages. A meaningful share of that gap is fixable with basic improvements.
- Page loads in under 3 seconds. Google’s Core Web Vitals define LCP under 2.5 seconds as “good.” Pages loading in 1 second convert 3× better than those at 5 seconds. Every second of delay drops conversion 4–7% and raises your CPC through Quality Score degradation.
- Fully responsive layout with thumb-friendly CTA. Use tap targets at least 44px, font sizes above 16px, and avoid hero images that push the CTA below the fold. Reducing mobile form friction directly recovers lost conversions.
- Proper mobile input types. Forms that skip email keyboards or numeric keypads lose 15–30% of mobile completions silently. Updating input types creates a zero-cost fix with immediate impact.
Measurement and Post-Click Readiness: Connect Clicks to Revenue
Tracking infrastructure and CRM alignment turn a strong landing page into a revenue engine. The goal is clear visibility from first click through to SQLs, opportunities, and pipeline.
- Conversion tracking set up via Google Tag Manager. Track specific conversion events that match your sales process instead of only page views. Google Ads responds to the quality of the data you feed it, so define events that represent meaningful progress toward revenue.
- CRM integration tracks lead source and lifecycle. Every lead should carry its campaign, ad group, keyword, and landing page source into the CRM. This structure allows reporting on pipeline and revenue by channel instead of simple form-fill counts.
- Sales-ready events defined and synced. A demo request booked represents a different level of intent than a content download. Separate primary conversions used for bidding from secondary conversions used only for tracking. Align these definitions in both your CRM and ad platforms.
- Lifecycle stage events pushed back to ad platforms. When a lead becomes an SQL or an opportunity, send that signal to your ad platforms. This setup enables true optimization to revenue events such as SQLs and opportunities.
- Lead-to-SQL and cost metrics monitored by campaign. Typical B2B SaaS MQL-to-SQL conversion rates sit around a 13% median, with averages from 15–22%. Many programs see a large gap between form fills and SQLs, so track cost per SQL, cost per opportunity, and pipeline created for each campaign.
At SaaSHero, the growth team owns landing page design and CRO and aligns everything to CRM data. See how we tie post-click experience to pipeline reporting and build pages that support revenue decisions.

How to Prioritize This Checklist for Paid Traffic
Some checklist items move the needle faster than others, and the right priorities depend on traffic source and offer type.
- Cold paid traffic (LinkedIn Ads, cold Meta). Message match and above-the-fold clarity matter most. Your visitor has no context, so the headline should connect the ad to the page within seconds. Prioritize items 1–6.
- Retargeting traffic. Social proof and form friction matter more here. This visitor already knows you and now needs proof and an easy path. Prioritize items 8–15.
- High-intent search traffic (Google Ads, branded). Speed and form simplicity dominate. The visitor knows what they want, so keep friction low. Prioritize items 12–18.
- Low-commitment offer (ebook, webinar). Minimize form fields aggressively. You are capturing interest rather than fully qualifying buyers. Two fields often work well.
- High-commitment offer (demo, free trial). Trust signals and objection handling matter more than shaving off every field. Enterprise demo pages often perform better with a basic but meaningful form because the friction signals seriousness on both sides.
| Traffic Source | Median Conversion | Realistic Range | Primary Page Job |
|---|---|---|---|
| Branded Google Search | 18–28% | 12–40% | Close the loop with minimal friction |
| Non-branded high-intent Search | 4–8% | 2–14% | Match ad promise and prove fit |
| LinkedIn Ads (cold) | 3–7% | 1.5–12% | Educate, build trust, and capture interest |
| Meta (cold) | 1.5–4% | 0.8–7% | Build problem awareness with a low-friction offer |
| Email (warm list) | 8–18% | 4–25% | Present a direct CTA with minimal distraction |
Source: Digitelia 2026 CRO Benchmarks for B2B SaaS
Common Pitfalls and Diagnostic Questions
Most landing page failures trace back to a small set of recurring issues. These pitfalls weaken message match, add friction, or hide proof at the exact moment visitors consider converting. Use the diagnostic questions below to spot each problem on your own page.
- Generic headline that describes the product instead of the outcome. Diagnostic: “Does my headline match the ad that brought me here, and does it name a specific result?”
- Too many form fields. Diagnostic: “Does my sales team actually use every field I am asking for in their first outreach?”
- No real mobile optimization. Diagnostic: “Have I tested the page on an actual phone over cellular data, or only resized my browser?”
- Missing conversion tracking. Diagnostic: “If a lead converts to an SQL, can I trace which campaign and landing page produced them?”
- Multiple competing CTAs. Diagnostic: “Is there one obvious next step, or am I asking visitors to choose between ‘Get a Demo,’ ‘See Pricing,’ and ‘Start Free Trial’?”
- Social proof buried at the bottom. Diagnostic: “Is my proof placed where doubt peaks, or did my designer hide it in the footer?”
Frequently Asked Questions
How many form fields should I use on a B2B SaaS landing page?
For demo requests, three fields such as name, work email, and company provide a strong starting point. As mentioned earlier, three-field forms convert at roughly 10.1% versus 3.6% for nine-field forms, and each additional field drops conversion by 5–8%. Cutting fields that sales relies on for qualification hurts lead quality without recovering value elsewhere. Aim for minimum viable friction for your specific sales process. Enterprise SaaS with long sales cycles and high ACV often benefits from a slightly longer form that signals buyer seriousness, while low-commitment offers like content downloads usually perform well with two fields.
What is the ideal landing page length?
Page length should match the awareness level of the traffic arriving on it. Cold traffic from broad paid social usually needs a longer page that builds context and handles objections before asking for a conversion. High-intent search traffic, where visitors typed a specific problem into Google, often converts better on a shorter, more direct page because they already understand the category. Use scroll depth and conversion rate together as your diagnostic. If visitors drop off before reaching the CTA, the page may be too long or early sections may not earn the scroll. If they reach the CTA and still do not convert, focus on objection handling and proof rather than length.
How do I know if my landing page is actually working?
Start by benchmarking against your specific traffic source. As noted earlier, cold LinkedIn traffic typically converts in the low single digits, while warm email lists often convert in the high single or low double digits. A conversion rate that looks low against an email benchmark may be normal for cold social traffic. The more important lens is pipeline: track whether you are producing SQLs and opportunities at a cost per SQL that supports your CAC payback. A page converting at 6% with unqualified leads underperforms a page converting at 3% that consistently produces sales-accepted opportunities. Monitor lead-to-SQL conversion rate by campaign to find where the funnel leaks.
What is the difference between a landing page and a homepage for paid traffic?
A landing page has one job: convert the specific promise from the ad that brought the visitor. A homepage serves multiple audiences at once, including prospects at different stages, existing customers, job seekers, and press, which dilutes intent. Pages with no navigation links convert 28% higher than those with standard website navigation, because navigation gives visitors an exit before they act. For paid traffic, use a dedicated landing page that mirrors the ad message exactly. Sending paid traffic to the homepage remains one of the most common and expensive mistakes in B2B SaaS demand generation.
How long should I run A/B tests on my landing page?
Plan to run tests for 4–8 weeks to reach 95% confidence on a 10% lift. Calling a test at two weeks only makes sense when the lift is very large, such as above 30%, because smaller lifts require more data to separate signal from noise. Prioritize tests in this order: headline first, then CTA copy and placement, hero visual, form length, and social proof format. Before running any test, establish a baseline with at least 1,000 unique visitors and document your hypothesis. A minimum of 250 conversions per variant is needed for statistical significance, so a page generating 40 conversions per month may need roughly six months to validate a single two-variant test. This reality makes a strong case for testing your highest-traffic pages first.
Conclusion: Run This Audit Before Your Next Campaign Launches
A revenue-focused landing page sales checklist separates wasted ad spend from healthy pipeline. Every element on your page either moves a qualified visitor toward a sales-ready event or drains budget. The checklist above gives you a pre-launch audit framework, and the measurement infrastructure in items 19–23 turns that framework into reliable pipeline.
At SaaSHero, the growth team owns landing page design and CRO and aligns every decision to CRM data. Our in-house designers and copywriters build and test pages against the same revenue outcomes this checklist covers. If you plan to launch a campaign and want a partner who owns the post-click experience end to end, schedule your discovery call to start optimizing to revenue and get a detailed audit of your current landing page against this checklist.