




Written by: Aaron Rovner, Founder, Saas Hero | Last updated: August 13, 2026
Key Takeaways for Performance-Based Agencies
- Performance-based agencies must prove ad spend turns into closed revenue, not just impressions or CPL, to grow client budgets in 2026.
- A five-tier KPI hierarchy anchored on Net New ARR keeps teams focused on revenue impact instead of vanity metrics.
- Separate client-facing and internal dashboards give agencies the visibility to prove client ROI while protecting profitability and utilization data.
- Lead-quality scorecards and closed-loop attribution (including GCLID-to-opportunity mapping) prevent pipeline inflation and connect every closed deal to its originating campaign.
- Schedule a closed-loop reporting review with SaaSHero to audit your current stack and roll out revenue-focused dashboards for 2026.
1. North-Star Revenue Metric Hierarchy
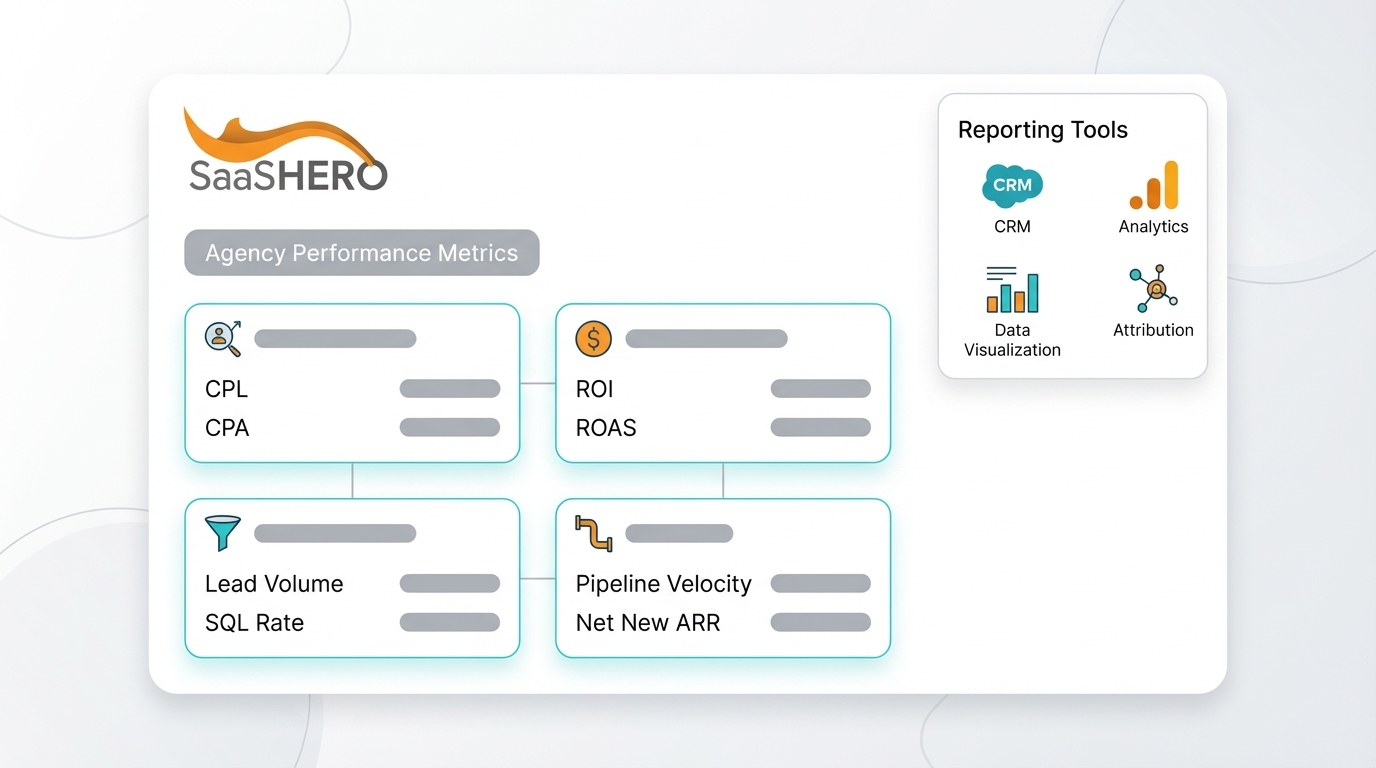
Every closed-loop reporting system needs a single shared hierarchy that ranks metrics by their proximity to revenue. Without this agreement, teams chase whatever is easiest to move instead of what drives growth. The hierarchy below runs from the boardroom metric down to the ad-platform input, with formulas and data sources at each tier.
| Metric | Formula | Data Source | Why It Matters |
|---|---|---|---|
| Net New ARR | Closed-Won ACV × New Logos in Period | CRM (Salesforce / HubSpot Closed-Won stage) | The only metric that proves revenue impact for new business growth |
| Pipeline Velocity | (Opportunities × Avg Deal Size × Win Rate) ÷ Sales Cycle Length in Days | CRM opportunity stage + close-date fields | A strong bottom-of-funnel KPI because it measures dollars moving through the pipeline per day |
| Sales Qualified Leads (SQLs) | Count of leads meeting agreed ICP threshold in CRM | CRM lead-status field (SQL stage) | Cost per SQL, calculated as total spend producing SQLs ÷ SQLs generated, is a more accurate efficiency measure than raw CPL |
| Marketing Qualified Leads (MQLs) | Leads meeting score threshold ÷ Total Leads × 100 | Marketing automation platform (HubSpot / Marketo) | MQL-to-SQL conversion benchmarks show a B2B median around 13%, with healthy programs often reaching 20%+ and up to 25% or higher when definitions align |
| Qualified Leads | Leads passing fit + intent criteria before CRM entry | Lead-quality scorecard (see Dashboard 4) | The channel with the cheapest leads rarely produces the cheapest customers, so qualification rate corrects this bias |
Every metric in this hierarchy should carry a governance card specifying its definition, numerator, denominator, source system, owner, and the decision it triggers. Without this discipline, the same figure appears differently across systems and dashboard trust erodes.
2. Six-Widget Client Executive Dashboard
The client-facing dashboard gives executives a fast view of whether the agency is generating profitable revenue. High-performing agencies standardize this template by client type and objective, which reduces onboarding time while still allowing surface-level customization such as brand colors and thresholds. The six widgets below align with Looker Studio and Power BI field names so implementation stays straightforward.

- Net New ARR vs. Target. Looker Studio field: crm_closed_won_acv vs. arr_target. This widget shows closed revenue against the agreed period goal and should appear first for CEOs.
- CAC Payback in Days. Power BI measure: DIVIDE([Total_Sales_Marketing_Spend], [Gross_Margin_Per_Customer]) × [Avg_Months_to_Payback] × 30. This view translates acquisition efficiency into a time-to-recover-spend metric that finance leaders understand.
- Pipeline Created vs. Goal. Looker Studio field: crm_pipeline_value_created_mtd vs. pipeline_target. Pipeline marketing metrics tie activities directly to closed-won revenue instead of stopping at lead volume.
- Lead-Quality Score by Source. Looker Studio field: lead_quality_score_avg segmented by utm_source. This widget highlights which channels produce high-fit leads before SQL conversion data matures.
- ROAS. Power BI measure: DIVIDE([crm_revenue_attributed], [total_ad_spend]). POAS (Profit on Ad Spend) should sit alongside ROAS for full-funnel reporting because it accounts for variable product margins.
- Margin After Agency Fee. Looker Studio field: (crm_closed_won_acv − agency_fee_mtd) ÷ crm_closed_won_acv. This widget proves the engagement is net-positive for the client after all costs.
3. Internal Profitability and Capacity Dashboard
The internal dashboard holds commercial data such as margins, salaries, and utilization that should never appear in a client-facing view. Role-based access controls ensure account managers see only their portfolio while directors see the full agency picture. The four core agency-centric metrics below support pricing, staffing, and scope decisions.
- Revenue Collected vs. Retainer. Track actual cash received against contracted MRR to flag aged debtors before they become write-offs.
- Blended Margin per Client Tier. Target a gross margin of 50–60% (revenue minus direct team and freelancer costs). High-revenue clients can still be unprofitable when scope creep goes unchecked.
- Hours Logged vs. Budget. Compare timesheet data against scoped hours per retainer tier to spot over-servicing and under-servicing.
- Utilization Rate. Aim for 70–80% billable time. Rates below 70% indicate idle capacity that erodes margins, while rates above 80% signal burnout risk.
The table below clarifies which metrics belong in each view so the dual-reporting model stays explicit and consistent.
| Dimension | Client Dashboard | Internal Dashboard |
|---|---|---|
| Primary revenue metric | Net New ARR vs. target | Revenue collected vs. retainer |
| Efficiency metric | CAC payback in days | Blended margin per client tier |
| Pipeline metric | Pipeline created vs. goal | Capacity forecast vs. pipeline intake |
| Quality metric | Lead-quality score by source | Hours logged vs. budget per account |
| Profitability metric | Margin after agency fee | Utilization rate (billable %) |
Agencies that consistently produce a monthly board pack with these two views improve their ability to manage performance and hit profitability targets.
4. Lead-Quality Scorecard for Cleaner Pipelines
A lead-quality scorecard downgrades low-fit records before they enter the CRM, which prevents pipeline inflation that corrupts every downstream metric. MQL-to-SQL conversion rate averages approximately 13% across most B2B teams, while top-performing teams reach 30–40% by enforcing strict stage-entry criteria. The weighted scoring system below uses three dimensions: fit, intent, and engagement.
Fit Dimension (0–50 points)
- ICP industry match (0–30 points). Demographic fit combined with behavioral intent supports higher opportunity conversion rates.
- Employee count in target band (0–20 points). This attribute filters out SMB leads that enter enterprise pipelines.
Intent Dimension (0–40 points)
- High-intent keyword or competitor search (0–25 points). Users searching competitor pricing or alternatives are in an evaluative mindset and convert at higher rates.
- Pricing page or demo page visit (0–15 points). Required dropdown outcomes on CRM lead records make lead-quality scoring measurable and auditable by source.
Engagement Dimension (0–10 points)
- Email open plus link click within 48 hours (0–10 points). Contacting a lead within one hour makes a rep nearly 7× more likely to qualify it, so engagement scoring helps prioritize that early contact window.
Records scoring below 40 points route to a nurture sequence instead of the SQL queue, which keeps sales focused on high-potential leads. Teams that implement a structured lead-quality framework typically see their MQL acceptance rate improve by 15–25 percentage points within two quarters. The scorecard field in Looker Studio is lead_quality_score_total, segmented by utm_source and utm_campaign to reveal which channels produce the highest-scoring leads over time.
5. CRM Attribution Architecture That Connects Clicks to Revenue
The attribution layer separates a performance-based agency from a traffic agency because it closes the loop between ad clicks and closed revenue. Without this layer, every dashboard above relies on incomplete data. Three components are non-negotiable: offline conversion imports, GCLID-to-opportunity mapping, and negative-keyword hygiene.
Offline Conversion Imports
Without offline conversion tracking, a reported CPL can hide a much higher true cost per closed deal because algorithms chase cheap form fills instead of qualified buyers. The correct data flow follows these steps.
- Capture GCLID, FBCLKID, and MSCLKID at click time through auto-tagging.
- Persist click IDs in first-party cookies and pass them through form submissions as hidden fields.
- Fire CRM webhooks on every deal-stage change (Lead Created → MQL → SQL → Closed Won). These webhooks capture the conversion data that will later flow back to ad platforms.
- Upload the closed-won events captured by those webhooks to Google Ads, Meta CAPI, and LinkedIn Conversion API. Daily uploads are best practice because stale data degrades Smart Bidding performance.
Once offline conversions flow back to ad platforms, the next critical step is making sure each conversion can be traced to its originating click.
GCLID-to-Opportunity Mapping
Value updates for Google Ads bidding models must reach Google inside a 7-day window from the original click. For B2B sales cycles that exceed platform windows, track mid-funnel milestones such as Demo Completed and Contract Sent as conversion actions so attribution stays current. The CRM field gclid_original must remain preserved on the contact record and should not be overwritten by later sessions. Keeping the original click ID on every CRM record lets ad platforms match the closed deal back to its source ad.
Negative-Keyword Hygiene
SaaSHero proactively negates competitor brand names used alone to filter out navigational intent, targeting only modifier terms like “pricing,” “alternatives,” and “vs” where users are in an evaluative mindset. This practice prevents wasted spend on users seeking a login page and keeps the offline conversion signal clean by removing low-intent clicks that would never close.
Frequently Asked Questions
What is closed-loop attribution?
Closed-loop attribution is a reporting method that feeds sales outcome data, including accepted leads, rejected leads, converted opportunities, closed-won deals, and closed-lost deals, back to the originating marketing campaign record. The loop becomes closed when a won deal in the CRM is traceable to the specific ad click, keyword, or channel that first generated the lead. This structure lets agencies adjust campaigns based on which sources produce closed revenue instead of which sources produce the most form fills. Implementing closed-loop attribution requires consistent UTM tagging, hidden form fields that capture click IDs, CRM stage-change webhooks, and offline conversion uploads to ad platforms.
Who owns the CRM data in a performance-based engagement?
The client always owns the CRM data. In a performance-based engagement, the agency receives read and write access to specific objects, typically leads, contacts, opportunities, and campaign records, which is enough to configure tracking, import offline conversions, and pull reporting data. SaaSHero operates as an embedded growth team rather than a black-box vendor, so clients retain full administrative control of HubSpot or Salesforce and can revoke access at any time. This approach aligns with the month-to-month contract model, where the agency must re-earn the relationship every 30 days and data portability becomes a structural requirement.
How long does it take to build the first dashboard?
A functional client-facing executive dashboard in Looker Studio or Power BI usually takes two to three weeks from kickoff to first live view, assuming the CRM already uses standard lead and opportunity stages. Week one covers the data audit, UTM convention alignment, and CRM field mapping. Week two covers connector setup, field naming, and widget configuration. Week three covers QA, threshold calibration, and the client walkthrough. Internal profitability dashboards add one to two weeks because they require time-tracking integration and overhead allocation logic. Agencies starting from a clean CRM with no prior attribution setup should budget four to six weeks for the full dual-dashboard architecture.
Can smaller agencies start with the free Looker Studio tier?
Smaller agencies can start with the free Looker Studio tier. Looker Studio’s free version supports direct connectors to Google Ads, Google Analytics 4, and Google Sheets, which is enough to build the client-facing executive dashboard and the lead-quality scorecard for agencies managing spend on Google channels. The main limitation is CRM connectivity because native HubSpot and Salesforce connectors require a paid third-party connector such as Supermetrics or Coupler.io, typically priced at $50–$100 per month per data source. Agencies managing under $25,000 in monthly ad spend can begin with a Google Sheets-based CRM export feeding Looker Studio, then move to a live CRM connector once the dashboard structure is validated. Power BI’s free desktop version works well for internal profitability dashboards, although sharing requires a Pro license at $10 per user per month.
How do you calculate pipeline velocity?
Pipeline velocity is calculated as the number of open opportunities multiplied by the average deal size multiplied by the win rate, then divided by the average sales cycle length in days. The result is a dollars-per-day figure that measures how fast revenue moves through the pipeline. For example, 300 open opportunities with a 22% win rate, a $14,000 average contract value, and a 45-day sales cycle produce a pipeline velocity of approximately $20,500 per day. In Looker Studio, this appears as a calculated field: (opportunities_open × avg_deal_size × win_rate) / avg_sales_cycle_days, with each input drawn from CRM opportunity-stage data. Tracking this metric weekly reveals whether changes to lead quality, sales process, or deal size are accelerating or slowing revenue generation before those effects show up in closed-won totals.
Conclusion: Reporting Standards for 2026 Agencies
The five-tier KPI hierarchy of Net New ARR, Pipeline Velocity, SQLs, MQLs, and Qualified Leads now represents the minimum viable reporting standard for performance-based lead generation agencies. Agencies that still lead with impressions, clicks, or raw CPL report on activity instead of impact. Few marketing teams currently see closed-won revenue tied to specific campaigns, so agencies that build this infrastructure now gain a structural advantage.
The dual-dashboard split, which combines a six-widget client-facing executive view with a separate internal profitability dashboard, answers the two questions that determine whether an engagement survives. Those questions are whether the agency makes money for the client and whether the agency makes money for itself. Only 8% of in-house teams use advanced analytics consistently, yet more than 70% say they want to improve their measurement skills. Performance-based agencies can close this gap by delivering the architecture their clients cannot build alone.

SaaSHero has operated this model at scale across B2B SaaS verticals including HR Tech, Cybersecurity, and Transportation, generating outcomes such as $504,758 in Net New ARR for TripMaster. The dashboards described above reflect the reporting infrastructure behind those results.