




Written by: Aaron Rovner, Founder, Saas Hero
Key Takeaways
- Executive ABM reporting succeeds when it translates campaign activity into board-level outcomes such as pipeline sourced and influenced, CAC payback, and target account coverage, expressed in precise, model-disclosed terms.
- The report structure that survives CFO scrutiny includes a one-page executive summary, a three-pillar dashboard, tiered reporting, 30/60/90 velocity framing, and attribution methodology disclosed up front.
- Pipeline sourced (first-touch) and pipeline influenced (multi-touch) must always be reported separately and never blended, because they answer different questions and use different denominators.
- Vanity metrics such as impressions, email open rates, and form fills belong in the appendix; the executive view must lead with program cost, closed-won revenue, pipeline velocity, account coverage, and buying-group penetration by tier.
- SaaSHero builds and owns this reporting layer for B2B SaaS companies, connecting CRM data to Looker Studio dashboards that speak the CFO’s language and managing roughly $16M in annual ad spend.
Book A Discovery Call With SaaSHero
Step 1: Build The Three-Pillar Dashboard
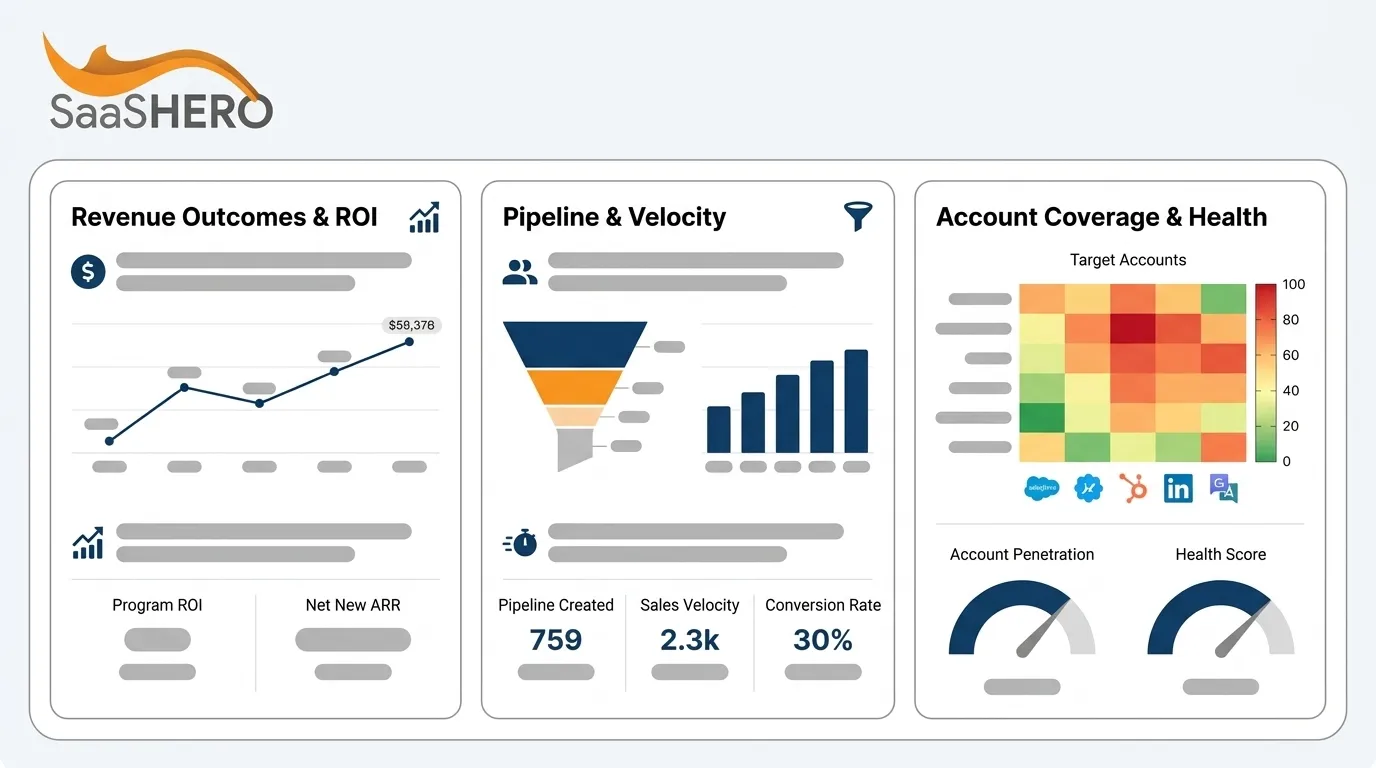
The executive ABM dashboard organizes every metric into three pillars, and each pillar answers a specific board question. Build them in this order, because the definitions in Pillar 1 govern what gets counted in Pillars 2 and 3.
Pillar 1: Revenue Outcomes And Program ROI
Program ROI for ABM is defined as (ABM-attributed closed-won revenue minus total program cost) divided by total program cost, multiplied by 100, where total program cost includes platform, enrichment and data tools, ad spend, content, headcount allocation, events, and agency or freelance fees. This is the number the CFO will reach for first.

Within that figure, two sub-metrics must be reported separately and never blended:
- Closed-won revenue sourced: Revenue from opportunities where marketing generated the first touch that led to opportunity creation (first-touch attribution). This is a first-touch construct. It is deliberately narrow and conservative, and it is the number that answers “what would not exist without marketing.”
- Closed-won revenue influenced: Revenue from opportunities where any ABM touch reached any buying group member at any point before close, credited under a stated multi-touch model with a defined lookback window. This is deliberately broad. As Harty notes, pipeline sourced and pipeline influenced are not two versions of the same number — they have different definitions, different attribution mechanics, and different denominators, and most B2B attribution conflict arises when a marketing team presents an influenced figure into a room that is mentally expecting a sourced one.
The executive question here is simple: “How much revenue did this program create, and how much did it cost?” Answer with sourced revenue first, influenced as program context, and total spend alongside both.
Pillar 2: Pipeline And Velocity
Pipeline influenced is defined as the value of open or closed opportunities where an ABM touch occurred at any point before close, credited under a stated multi-touch model with a defined lookback window, typically 90 days running through close. It is distinct from pipeline sourced, which counts only opportunities where marketing generated the first touch. Report both, always labeled, never merged into a single “marketing pipeline” figure.
Pipeline velocity in ABM uses the formula:
(Qualified Opportunities × Win Rate × ACV) ÷ Sales Cycle Days
The result is revenue generated per day from qualified pipeline. The Starr Conspiracy’s worked example: 50 opportunities × $80,000 ACV × 25% win rate = $1,000,000, divided by 90 days = $11,111 per day of pipeline velocity. Velocity is the most CFO-legible metric in the account-based canon because it converts marketing activity into a language finance already respects: time and rate.
Attribution model definitions matter because the model choice materially changes the influenced number. Use this list as your menu and pick one model for executive reporting:
- First-touch: 100% of credit to the first recorded interaction. Produces the sourced number and answers demand creation questions.
- Last-touch: 100% of credit to the final interaction before conversion. This model systematically over-credits bottom-funnel capture channels such as branded search and should not drive ABM program reporting.
- Multi-touch (linear): Credit split equally across all recorded touches. This is a neutral default when you refuse to make weighting decisions and produces the influenced number when applied with a stated lookback window.
- Time-decay: More credit to touches closer to conversion. Appropriate for long cycles where recency plausibly matters.
- U-shaped / W-shaped: Heavy credit to first touch and conversion touch (U-shaped) or first touch, lead creation, and opportunity creation (W-shaped). Useful when a meaningful mid-funnel milestone exists.
A HockeyStack Labs analysis of 150 B2B SaaS companies reported an average of 266 measurable touchpoints and 2,879 impressions for a closed-won deal, rising to 417 touchpoints and 5,500 impressions for deals above $100,000. Single-touch attribution collapses that complexity into a misleading story. Pick one multi-touch model, document why, and hold it steady through the year.
Pillar 3: Account Coverage And Health
Three definitions govern this pillar, and each one should be written down before the quarter starts so no one can adjust the denominator afterward to improve the fraction.
- Target account coverage: The percentage of the target account list (TAL) where the program has the assets required to actually run the motion, including identified buying group contacts, ad-reachable identifiers, working contact data, and active engagement channels. A TAL of 500 accounts with real coverage of 120 is a 120-account program wearing a 500-account budget.
- Buying group penetration: Within a given account, the proportion of relevant buying group roles that have been identified, reached, and engaged. Forrester estimates that in 2026 B2B buying groups average 13 people across 4 departments. Reaching two of thirteen falls far short of penetration.
- Engaged account: An account where more than one contact has acted within the measurement window. A single contact’s activity describes a research project. High engagement plus low penetration describes a research project with one enthusiastic author, not a hot account.
With the three pillars defined, the next step is to compress them into the one page the board will actually read. The dashboard holds the detail, and the executive summary is the distilled version that sits on top of it.
Step 2: Write The One-Page Executive Summary
The one-page executive summary is the artifact that determines whether the board reads the rest of the deck. It has a specific order, and you should present items in this sequence:
- Total program cost vs. total financial impact. State the bottom line first. Show total spend versus closed-won revenue sourced. The CFO will go here regardless of where you put it.
- Pipeline sourced and pipeline influenced, separately labeled. Keep them distinct and label each with its attribution model.
- Pipeline velocity trend vs. baseline. Show current velocity in dollars per day versus the pre-program baseline. A rising trend tells the efficiency story.
- Account coverage and buying group penetration by tier. Show coverage percentage for each tier and penetration depth for Tier 1 accounts.
- One-line attribution methodology footer. On every page of every deck, state which model produced which number and what the lookback window is.
This order matters because it signals confidence. Lead with the financial contribution and then use coverage and penetration to explain how the program built that contribution.
Step 3: Split Reporting By Account Tier
Tiered reporting appears in most ABM frameworks, but the report itself often stays flat. In a board-ready view, the report changes by tier, including the budget framing, the metric emphasis, and the expectation-setting conversation.
- Tier 1 (1:1): Report cost per account, buying group penetration depth (named roles reached versus total required roles), and executive engagement (C-suite or VP-level contacts touched). The board evaluates whether the investment in a single named account is justified by the depth of committee access. The rule: if a single closed-won deal cannot pay back the program cost several times over, it is not 1:1.
- Tier 2 (1:few): Report cost per engaged account, pipeline per target account, and win rate delta versus non-ABM accounts in the same segment. Here the board evaluates whether the cluster-level investment produces measurably better pipeline economics than the baseline.
- Tier 3 (1:many): Report coverage rate (percentage of the Tier 3 TAL reached), engagement lift versus a matched control cohort, and cost per opportunity. At this tier, the program functions as a coverage layer. Judge it on reach and lift rather than individual account depth.
Never blend Tier 1 and Tier 3 into a single ABM number because blending produces a figure that describes neither. A board that sees one blended ABM metric cannot evaluate whether the 1:1 investment earns its cost or whether the 1:many program reaches enough of the list to matter.
For internal links on ABM budget allocation by tier, see ABM Budget: How Much To Spend & How To Allocate It.
Step 4: Add The 30/60/90 Pipeline Velocity Framing
The 30/60/90 velocity view gives marketing leaders a defensible in-flight story during quarters when pipeline has not yet converted into closed revenue. It turns “nothing closed yet” into a concrete progress update.
Build a stage-velocity view that maps target account movement over structured time intervals, expressed as median days per stage against a pre-program baseline:
- TAL to MQA (Marketing Qualified Account): Measure how long it takes a target account to cross the engagement threshold from first program touch. Compare against the pre-program baseline for non-target accounts reaching the same threshold.
- MQA to SQA (Sales Qualified Account): Measure how long it takes sales to accept and qualify a marketing-qualified account. This is the handoff diagnostic. MQA-to-SQA conversion tracked monthly is the single most useful diagnostic for alignment health.
- SQA to opportunity: Measure how long it takes from sales acceptance to a formal opportunity being created. A long gap here indicates stage friction rather than a demand generation problem.
- Opportunity to close: Track median days to closed-won for ABM-sourced opportunities versus the non-ABM baseline.
The 30/60/90 framing presents these intervals as three snapshots: where accounts stood at 30 days into the program, at 60 days, and at 90 days. A marketing leader presenting at a quarterly board meeting with no closed revenue can still show that target accounts are moving through stages faster than the pre-program baseline. A 15% sales cycle reduction produces the same pipeline velocity gain as a 15% ACV increase, with none of the upmarket positioning work required.
For the operational mechanics behind this sequencing, see ABM Campaign Orchestration And Automation: A Build Guide.
Step 5: Disclose Your Attribution Methodology Up Front
Attribution methodology disclosure is the single practice that most reliably prevents the argument in the room. What destroys CFO trust is not a low attribution number but a model change: the quarter a company switches from last-touch to multi-touch and marketing’s number jumps from 22% to 47% is the quarter it becomes unbelievable.
Three rules govern attribution disclosure in executive ABM reporting:
- Report pipeline sourced and pipeline influenced together, explicitly labeled, and never blended into a single “marketing pipeline” figure. The two numbers overlap and are not additive. Combining them inflates impact and quickly erodes credibility with finance.
- Include a one-line definitions footer on every deck. The recommended copy: “Pipeline sourced: opportunity value where marketing generated the first touch leading to opportunity creation (first-touch attribution). Pipeline influenced: opportunity value where marketing engaged any buying group member during the cycle (multi-touch attribution, 90-day lookback, through close). These are different metrics answering different questions and are never blended.”
- Pick one model and hold it for at least four quarters. Forrester’s Marketing Survey, 2024, found that 64% of B2B marketing leaders say they do not trust their own organization’s marketing measurement for decision-making. Consistency is the fix.
Gartner research published in June 2025 found that 61% of B2B buyers prefer a buying experience without a sales representative, which means a material share of the buying journey happens in channels no pixel reaches. Acknowledge the dark funnel gap explicitly so the CFO sees the model’s limits as part of the design rather than as a hidden flaw.
Step 6: Pre-Empt The Three Executive Objections
Three objections recur in every board or QBR where ABM results appear. Prepare the answers before the meeting and deliver them without hesitation to signal command of the program.
Attribution disputes: “Pipeline sourced uses first-touch attribution and counts only opportunities where marketing generated the first touch. Pipeline influenced uses multi-touch over a 90-day lookback and counts any buying group engagement. These are different metrics answering different questions and are never blended. The model has not changed since we adopted it in [quarter].”
Lead-quality skepticism: “Here is the MQA-to-SQA acceptance rate and the buying group penetration by tier. The penetration data from Pillar 3 is the evidence here: high engagement with low penetration reflects attention, not a buying committee. Tier 1 accounts show [X] roles reached of [Y] required — that is the depth metric, not the engagement score.” Gartner also found that 69% of B2B buyers reported inconsistencies between a company’s website and its sellers, and buying group penetration data shows that marketing and sales are reaching the same committee.
Spend-efficiency questions: “Here is CAC payback by channel and LTV:CAC. LTV:CAC of 3:1 is generally considered healthy for SaaS, and CAC payback under 12 months is strong. Our current figures are [X] and [Y] respectively.” This answer matters more than it used to. Gartner’s 2025 CMO Spend Survey found that marketing budgets held at 7.7% of company revenue, so the board now evaluates every dollar on unit economics rather than activity volume.
Step 7: Leave Vanity Metrics Out Of The Executive View
Impressions, click-through rate, email open rate, total form fills, website sessions, and content downloads do not belong in the executive ABM report. They belong in the appendix or the working dashboard, available for follow-up questions but not in the room as headline numbers.
Raw email open rate has been structurally unreliable since Apple Mail Privacy Protection pre-loads pixels regardless of whether a recipient opened the message. Tomba’s ABM measurement guide reaches the same conclusion and advises cutting impressions, display reach, raw email open rate, total form fills, website sessions, and content downloads from the executive ABM deck. Presenting any of these as evidence of program health signals that the program cannot produce a pipeline story, which is the only story the board is there to hear.
The executive view contains program cost, closed-won revenue sourced, pipeline sourced, pipeline influenced, pipeline velocity trend, account coverage by tier, buying group penetration by tier, CAC payback, and LTV:CAC. Everything else functions as a diagnostic rather than a headline.
ABM Reporting Vs. Traditional Marketing Reporting
The structural difference between ABM reporting and traditional marketing reporting is the unit of measurement. Traditional reporting counts contacts, and ABM reporting counts accounts. Two MQLs from the same account are not two opportunities — they are one account with two engaged contacts. Counting them as two leads double-counts the pipeline and overstates program reach. The table below maps the four structural differences between the two reporting approaches so you can see where the executive view diverges from the traditional one.
| Reporting Element | Traditional Marketing Reporting | Executive ABM Reporting |
|---|---|---|
| Unit of measurement | Contact (lead) | Account |
| Headline metric | Leads, CPL, impression share | Pipeline, CAC payback, coverage |
| Attribution model | Last-touch default | Multi-touch, disclosed up front |
| Reporting cadence | Monthly platform metrics | Weekly operating, monthly leadership, quarterly board |
Traditional reporting leads with volume, and ABM reporting leads with pipeline, CAC, and payback period. A program that generates 400 MQLs from 400 different companies and a program that generates 400 MQLs from 50 target accounts look identical in a traditional report and completely different in an ABM report. The board evaluates the second program, not the first.
For the board-level metrics that CFOs and finance teams specifically evaluate, see ABM Board Reporting: Metrics CFOs And Finance Will Accept.
With the structure and the comparison in place, the remaining questions usually focus on setup, ownership, and cadence. The answers below address the ones that come up most often.
Frequently Asked Questions
How Long Does It Take To Set Up An Executive ABM Report?
A functional executive ABM report requires three prerequisites. First, a defined target account list with tier assignments. Second, CRM lifecycle stage definitions that marketing and sales have jointly agreed on. Third, a stated attribution model with a documented lookback window, typically 30 to 90 days.
With an ABM-specific platform in place, a working dashboard can be set up in two to four weeks. The longer timeline, typically 60 to 90 days, reflects the time needed to establish a pre-program baseline for velocity and win rate comparisons. Without a baseline, the report can show current-state numbers but cannot demonstrate improvement, which is the only story that survives a board meeting. Teams that skip the baseline phase produce dashboards that look complete but cannot answer the CFO’s first follow-up question: “Better than what?”
What Roles Are Required To Build And Maintain It?
Four roles are essential to build and maintain an executive ABM report: strategy lead, campaign manager, RevOps support, and a named sales partner. These must exist in some form, even if compressed into two people. A full ABM team often covers six roles, including content and reporting.
- Marketing operations or RevOps owner: controls CRM lifecycle stage definitions and configures the attribution model.
- Demand generation lead: owns the metric definitions and can explain them in the room.
- Sales operations counterpart: agrees on MQA and SQA thresholds in writing before the program launches. Without that agreement, the MQA-to-SQA handoff becomes a permanent argument.
- Finance or CFO-office contact: reviews the sourced-versus-influenced definitions before the first board presentation, not after.
The most common failure mode is building the report without finance’s input and then discovering in the meeting that the CFO’s definition of “marketing pipeline” differs from marketing’s. That conversation belongs in a working session, not a board meeting.
How Does The Report Adapt For Smaller Vs. Larger SaaS Teams?
The structure stays the same, and the data sources and tooling scale around it. A smaller marketing team of two to four people can run a three-part ABM dashboard — target account insights, funnel reporting, and campaign results — using HubSpot’s native ABM dashboards and Looker Studio, typically starting with manual data pulls in a spreadsheet before moving to automated reporting once CRM automation is in place.
The critical discipline is freezing cohort definitions before the program launches so that the baseline is comparable to in-program results. A larger team with a dedicated RevOps function and an ABM platform such as 6sense or Demandbase can automate the coverage and penetration metrics, but the executive report structure remains identical: sourced and influenced pipeline separately labeled, velocity trend versus baseline, coverage and penetration by tier, and attribution methodology disclosed on every page.
What Are The Common Risks In ABM Reporting?
Several risks recur:
- Blending sourced and influenced pipeline into a single “marketing pipeline” figure. This is the most common credibility failure and the one most likely to produce a CFO objection in the room.
- Reporting engagement scores as revenue claims. An account with a high engagement score has produced attention, which is a leading indicator, not an outcome.
- Changing the attribution model mid-year to improve a quarterly number. The credibility cost of a model change exceeds any insight the new model provides, so the “pick one model and hold it” rule from Step 5 applies here.
- Reporting coverage against the full TAL when real coverage is a fraction of it. The 500/120 example from Pillar 3 is the most common version of this.
- Omitting the pre-program baseline. Without it, velocity and win rate improvements cannot be demonstrated, and the report becomes a current-state snapshot rather than a program effectiveness argument.
How Often Should The Report Be Revisited?
Three cadences govern ABM reporting at different organizational levels. Weekly, the ABM and demand generation team reviews engagement score movement across the TAL, MQA and SQA counts, and coverage and penetration by tier. These are operational numbers that point at specific repairs.
Monthly, marketing and sales leadership reviews sourced and influenced pipeline separately labeled, MQA-to-SQA acceptance rate, and stage velocity versus baseline. Quarterly, the board or CFO review leads with sourced pipeline as the primary number, influenced as program context, velocity trends as the efficiency story, and the full program ROI calculation. Revenue metrics should be reported quarterly only because monthly revenue reporting on a nine-month ABM sales cycle creates noise that can get a program cancelled during a slow month that is actually working as designed.
Conclusion: Build The Report That Survives The Room
Most ABM reporting fails in the room, not in the data. The metrics exist, but the definitions are imprecise, the attribution is undisclosed, the tiers are blended, and the velocity story is absent. The CFO pushes back because the report cannot answer follow-up questions with clarity.
The report that survives the room has a specific structure: a one-page executive summary that leads with program cost versus financial impact, a three-pillar dashboard with rigorously defined metrics, tiered reporting that changes by account tier rather than aggregating across them, a 30/60/90 velocity view that shows momentum before deals close, and attribution methodology disclosed on every page in a one-line footer.
SaaSHero builds and owns this reporting layer for B2B SaaS companies, CRM-connected in HubSpot, Salesforce, or any other CRM, with Looker Studio dashboards that connect ad spend to pipeline and revenue in the vocabulary the CFO already uses. The measurement architecture separates primary from secondary conversions, pushes lifecycle stage events back into the ad platforms so bidding learns from qualified outcomes rather than form fills, and produces the board-ready view without requiring the marketing leader to rebuild it from three systems that do not agree.

SaaSHero manages roughly $16M in annual ad spend and has managed over $60M lifetime for 100+ B2B companies. It is a Google Premier Partner, a designation held by the top 3% of agencies, and has been a G2 High Performer in digital marketing for over two years, currently ranked #20 of approximately 6,000 agencies. The reporting layer is the foundation the entire program is built on, not an add-on at the end of the engagement.