




Written by: Aaron Rovner, Founder, Saas Hero
Key Takeaways
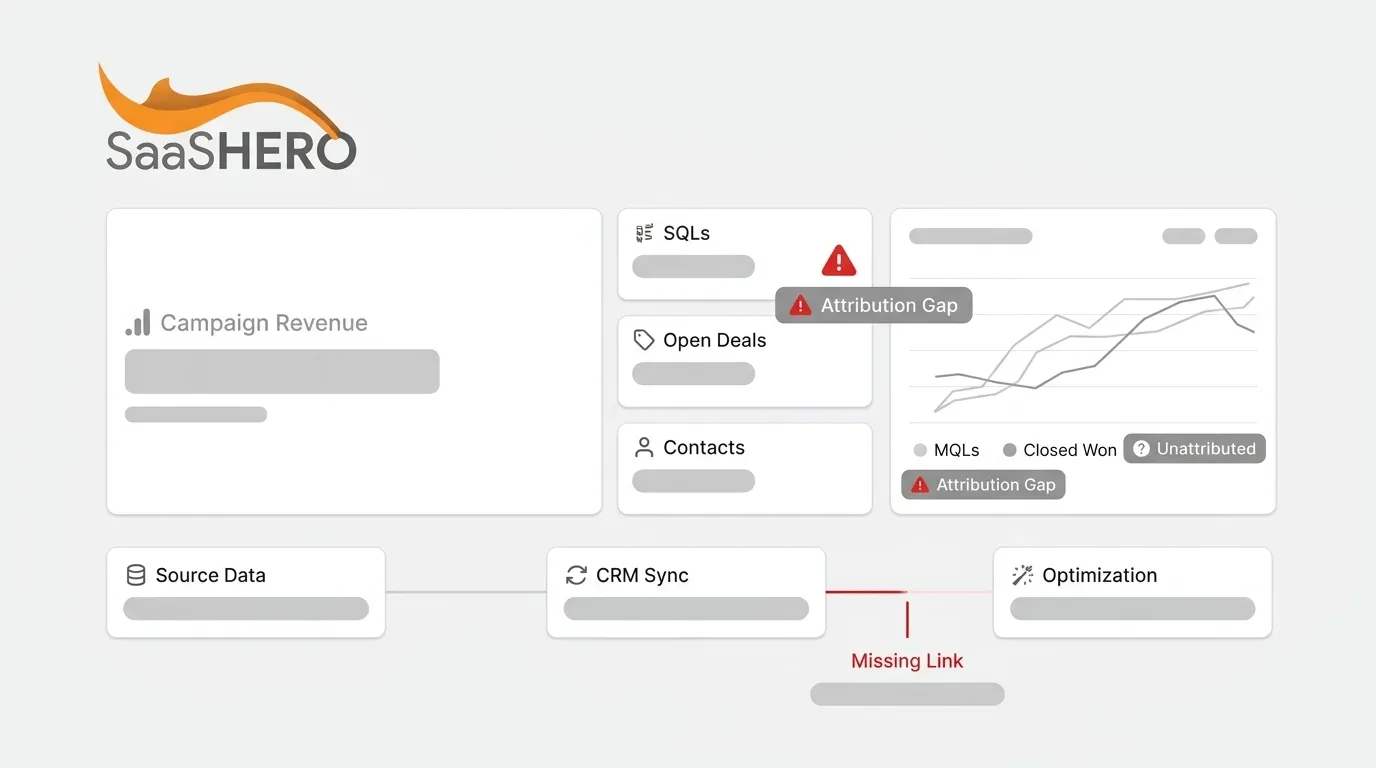
- Agency dashboards often show platform-reported conversions while CRM records show actual pipeline, so a visible gap appears during board or CFO reviews.
- Ad platforms and CRMs will always disagree without deliberate CRM attribution because they measure different events, browser activity versus sales outcomes.
- A three-layer report that separates platform metrics, CRM-verified outcomes, and an unattributed-lead-percentage KPI makes the gap visible and defensible.
- A 30/60/90 remediation plan that captures UTMs and click IDs, preserves first-touch data, and shifts bidding to qualified outcomes narrows the gap on a clear schedule.
- SaaSHero owns the full measurement chain from impression to CRM record so B2B teams can report pipeline, CAC, and payback instead of impressions and clicks.
See How SaaSHero Closes The Attribution Gap
What Attribution Reporting Means In A B2B CRM
CRM attribution connects marketing activity to CRM records so spend can be evaluated against pipeline and revenue instead of platform-reported conversions. Platform-reported conversions are events the ad platform observed in the browser. CRM-verified conversions are outcomes a human being confirmed inside the system of record, such as qualified leads, opportunities, and closed-won deals.
The distinction matters because ad platform conversion counts frequently exceed actual CRM-recorded leads. Each platform tracks conversions using its own attribution window and counting methodology. The same deal can be claimed by multiple platforms at the same time. A report that blends the two layers produces a number that is neither platform-reported nor CRM-verified. That number cannot be defended.
Talk With SaaSHero About CRM Attribution
The Three Risks Of Reporting Without CRM Attribution
- Vanity Metrics: The report leads with clicks, impressions, and cost per lead while the pipeline number is missed. Your CFO or board concludes that marketing is reporting activity, not outcomes. Raw lead counts by source are a vanity metric. The report that matters shows pipeline and closed revenue by source.
- Misallocated Budget: Last-click credits the branded search that happened after the decision, so demand creation gets defunded and the bottom of the funnel starves two quarters later. Your PE operating partner concludes that the channel mix is unmanaged. Last-click attribution systematically over-rewards bottom-funnel channels like branded search and retargeting while under-crediting awareness and nurture channels. Teams then cut awareness spend, and branded search volume drops.
- ROI Proof Gap: Revenue attribution without CRM linkage is an estimate. Say that clearly instead of letting a platform ROAS number stand in for observed revenue. Summing all platform-reported conversions routinely produces 150–250% of actual closed customers because overlapping attribution windows cause multiple platforms to claim credit for the same deal.
Review Your Reporting Risk With SaaSHero
How To Report Marketing Performance When CRM Attribution Is Incomplete
A three-layer report separates what can be stated confidently from what must be flagged. The table below shows how each layer maps to a source system and how it should be presented, so platform metrics and CRM outcomes never blend into one undefendable number. Build this in Looker Studio, HubSpot, or Salesforce this week.
| Report Layer | What It Contains | Source System | How To Present |
|---|---|---|---|
| Platform-reported | Spend, impressions, clicks, CTR, landing-page conversions | Google Ads, LinkedIn, Meta | Report confidently, and label as platform-reported |
| CRM-verified | Qualified leads, opportunities, closed-won | HubSpot, Salesforce | Report separately, and never blend with platform numbers |
| Data-quality flag | Unattributed lead count and percentage | CRM | Track as a KPI, and report the trend line |
The third row is the most common missing piece in B2B marketing reports. Unattributed leads, contacts in the CRM whose source field is blank, “Web,” “Direct,” or “Unknown,” should be counted and expressed as a percentage of total new leads each reporting period. A 2024 survey by B2B Marketing Alliance found that 44% of B2B organizations report more than 30% of their CRM contacts are missing lead source data. Among those that do have source data, 38% acknowledge partial inaccuracy from inconsistent UTM tagging, manual overrides, or integration failures.
Tracking unattributed-lead percentage as a named data-quality KPI turns an argument about methodology into a trend line. When the number falls quarter over quarter, the remediation is working. When it rises, something broke. A report that separates the two layers can be defended. A blended report cannot.
See How To Structure Your Three-Layer Report
How To Fix Missing CRM Attribution
A sequenced 30/60/90 plan creates visible progress and narrows the gap on a schedule you can report against.
Month One: Capture Clean Source Data
- Capture UTM parameters and click IDs into the CRM. Every paid click from Google Ads, LinkedIn, Meta, Microsoft Ads, Reddit, and TikTok should carry a gclid, li_fat_id, or fbclid alongside utm_source, utm_medium, and utm_campaign. Create a separate custom CRM field for each ad platform’s click identifier. Because click IDs contain letters and special characters, store them in text fields, not number fields. Then use Google Tag Manager to fire the capture script on landing and persist values in a first-party cookie for at least 30 days, so multi-session journeys retain their source.
- Standardize campaign naming so records can be grouped. UTM naming errors become permanent in the CRM. A typo like “utm_source=LinkedIN-paid” on a closed-won deal sits in Salesforce for the life of the account and breaks every revenue-by-source report. Enforce lowercase, hyphen-separated values from a governed naming document before any new campaigns launch.
Month Two: Protect First Touch And Sync Back
- Preserve original source fields so the first touch survives. An overwritten source field is a silent data problem that affects nearly every unmanaged CRM. The original channel for the deal disappears. Store first-touch UTM fields as write-once properties. Populate them only when the field is empty, and never overwrite them with a later session or a rep’s manual entry. In HubSpot, use the native “Original Source” property alongside custom first-touch UTM fields. In Salesforce, build a record-triggered flow that guards the first-touch write behind an emptiness check.
- Connect lifecycle-stage events back to the ad platforms via offline conversion import. Google Ads accepts GCLID-based offline conversions for up to 90 days after the click. LinkedIn’s li_fat_id supports a similar window. When a lead becomes a sales-qualified lead or an opportunity is created, that event should fire back to the platform so Smart Bidding learns from qualified outcomes instead of form fills. Configure CRM workflow triggers that fire conversion syncs automatically on stage changes.
Month Three: Optimize For Qualified Outcomes
- Move optimization from form fills to qualified outcomes. Switch Google Ads campaign goals from form-fill conversions to an offline conversion action such as “Sales Qualified Lead” or “Closed Deal.” This change shifts what the account optimizes toward. The platform pursues qualified outcomes instead of the cheapest form fills. Lead volume may fall while lead quality rises, often raising cost per lead while lowering cost per customer. The ad platform’s algorithm now finds people most likely to become qualified pipeline.
- Separate primary from secondary conversions so bidding follows business value. Track content downloads, webinar registrations, and low-commitment form completions as secondary conversions. Keep them visible in reporting but exclude them from account-wide optimization. Use only primary conversions, such as MQL, SQL, opportunity created, and closed-won, to drive Smart Bidding.
The modern stack for this sequence is GA4, Google Tag Manager, HubSpot or Salesforce, and Looker Studio for the reporting layer. Cookie deprecation and consent mode increase the difficulty compared with five years ago. Safari’s WebKit Intelligent Tracking Prevention blocks third-party cookies by default and applies additional restrictions to cross-site tracking, and Firefox uses Total Cookie Protection by default. Server-side tracking via Meta’s Conversions API and Google’s Enhanced Conversions recovers signal lost to browser restrictions and should be implemented alongside the UTM and click ID capture work in month one.
Get Help Running The 30/60/90 Plan
What To Say While The Attribution Gap Is Still Open
The gap will not close overnight. The remediation sequence takes a full quarter to run, and a B2B sales cycle means the data from month one’s tracking changes will not appear in closed-won revenue for months. During that period, the board meeting still happens. Use language that presents the gap honestly and pairs it with a clear plan.
- For a board or sponsor review: “Platform-reported conversions and CRM-verified outcomes are reported separately this quarter. The unattributed-lead percentage is [X]%, down from [Y]% last quarter. We are fixing [specific item] by [specific date].”
- For a client or internal stakeholder: “The ad platform reports [X] conversions. The CRM shows [Y] qualified leads. The gap is a tracking issue we are remediating. Performance is being managed against CRM outcomes.”
- For a sales leader asking why lead quality moved: “We changed the conversion event driving bidding from form fills to qualified outcomes. Lead volume may shift. Pipeline quality should improve.”
Presenting a known gap with a remediation plan reads as competence. Presenting a blended number that cannot be defended reads as the opposite. The most common attribution mistake is building the report before agreeing on the definitions. The dispute usually starts with who built the report, not with the numbers.
Align Your Narrative With Your Data
What HubSpot And Salesforce Can And Cannot Do Natively
Knowing what to say is only half the problem. The other half is knowing what your CRM can actually do on its own. Both HubSpot and Salesforce hold the lifecycle-stage and opportunity data that makes CRM attribution possible, and both can receive offline conversion imports. HubSpot automatically captures UTM parameters as “Original Source” contact properties when a contact fills out a HubSpot form. HubSpot’s multi-touch revenue attribution is only available on the Marketing Hub Enterprise tier. Its attribution is contact-based, so anonymous website visits before identification may not be tied to the contact’s attribution history.
Salesforce does not parse UTM parameters out of a URL on its own. The CRM only stores what is explicitly sent to it. Teams must capture UTMs with a browser script, persist them across the journey, and inject them into hidden form fields that map to custom Salesforce fields. Salesforce’s native Lead Source field is a single coarse picklist that cannot express which specific campaign produced a lead.
Neither system joins ad platform spend to CRM revenue out of the box. The UTM and click ID capture, the source-field logic, the conversion hierarchy, and the reporting layer must be built on top. Most B2B attribution implementations fail at the step of propagating click IDs from lead to opportunity. In Salesforce this requires a custom field on the Opportunity object plus a workflow or flow to copy the value from the Contact. In HubSpot, deal properties must be mapped from contact properties.
Clarify What Your CRM Can Support
Why SaaSHero Solves Reporting Gaps In B2B CRM Attribution
SaaSHero is the outsourced inbound growth team for B2B companies that owns the measurement layer end to end, including the ad account and the CRM. When agency reporting lacks CRM attribution, the problem usually sits in ownership. No single party owns the chain from impression to CRM record. SaaSHero is built to own that chain.

Five capability areas run as one team on one accountability line:
- Paid media across Google Ads, Microsoft Ads, LinkedIn, Meta, Reddit, and TikTok, including strategy and management.
- Creative through concept, copy, and design produced in-house by full-time employees, developed continuously from campaign data.
- Landing pages and CRO designed in Figma, built and tested in Unbounce, and owned by the same team running the campaigns.
- Attribution and reporting inside the client’s CRM, including HubSpot, Salesforce, or any other CRM, with Looker Studio dashboards alongside so platform metrics and CRM outcomes sit in one view.
- Strategy as the standing job of identifying what to test, where to invest, and what needs to change, delivered proactively.
The core differentiator is the focus on CRM outcomes. SaaSHero optimizes against qualified pipeline, lifecycle stage, and closed revenue instead of the conversion counts the ad platforms report back. To make that possible, primary and secondary conversions are separated in every account, and lifecycle-stage events are pushed back into the ad platforms so bidding learns from qualified outcomes. Reporting then runs in the client’s own CRM, so the board sees pipeline, CAC, and payback period instead of impressions and clicks.

Capability alone is not enough if the commercial model punishes the work. The commercial structure removes the conflicts that hold most agencies back. The flat retainer is indexed to total monthly ad spend, not channel count. That structure means reallocating budget or testing a new channel does not raise the fee. The client owns all accounts, assets, and files throughout the engagement and at exit. Growth Team starts at $4,000 per month. Engagements are phased with a validation gate so budget does not double before the measurement architecture is confirmed.
Two published client outcomes show what this method produces when the measurement layer is owned end to end. TripMaster added $504,758 in net new ARR over one year, with a 650% return on ad spend and a 20% conversion rate from paid search. Playvox achieved a 10x reduction in cost per lead alongside a 163% increase in lead volume. These are observed outcomes from named clients.

See SaaSHero’s Measurement-First Growth Model
FAQ
How Is CRM Attribution Different From Platform Reporting?
CRM attribution connects marketing activity to CRM records so spend can be evaluated against pipeline and revenue instead of platform-reported conversions. Platform reporting measures events the ad platform observed in the browser. CRM attribution measures outcomes, such as qualified leads, opportunities, and closed-won deals, that are confirmed inside the system of record. The two layers will always produce different numbers, so effective reporting keeps them separate and explains the divergence.
Can HubSpot Be Used For Attribution Reporting?
HubSpot holds the lifecycle-stage and opportunity data that makes CRM attribution possible and can receive offline conversion imports, but it does not join ad platform spend to CRM revenue out of the box. As noted earlier, HubSpot captures UTM parameters as “Original Source” properties, but its attribution buckets follow HubSpot’s own taxonomy rather than the marketer’s UTM taxonomy, so explicit hidden fields mapped to contact properties are still needed to capture actual parameter values. Full multi-touch revenue attribution in HubSpot requires the Marketing Hub Enterprise tier. The UTM and click ID capture, source-field logic, and conversion hierarchy must be built on top of whatever HubSpot tier is in use.
How Long Does It Take To Close A CRM Attribution Gap?
The 30/60/90 sequence described above takes a full quarter to run. The leading indicator to watch during that period is unattributed-lead percentage, not closed-won attribution. A falling unattributed-lead percentage shows that the remediation is working while the sales cycle plays out.
What Is A Reasonable Unattributed-Lead Percentage To Report?
Unattributed-lead percentage works best as a trend line instead of a hard threshold. The key question is whether it falls quarter over quarter. A practical data-quality target for trusting lead source data in budget decisions is fewer than 10% of leads missing a source field entirely, with fewer than 20% classified as “Direct” or “Unknown.” Report the count and percentage, name what is being fixed, and give a date. A falling unattributed-lead percentage is the evidence that the remediation is working. A rising one signals a break in the capture chain.
Should We Pause Campaigns While The Tracking Is Rebuilt?
Pausing campaigns stops the data flow that shows what is working. A better approach reports the two layers separately while the remediation runs, so the gap stays visible and managed. Platform-reported metrics continue to inform optimization decisions within each channel. CRM-verified outcomes are reported separately and labeled as such. The unattributed-lead percentage is tracked as a KPI. This approach keeps the account learning while the measurement architecture is corrected and gives the board a defensible narrative with a visible trend line.
Discuss Your Attribution Timeline With SaaSHero
Conclusion And Next Steps
When agency reporting lacks CRM attribution, the gap is structural. Ad platforms measure browser events. CRMs measure sales outcomes. Without a deliberate connection between the two, they will always disagree. The fix is a measurement architecture that separates platform-reported acquisition metrics from CRM-verified outcomes, tracks unattributed leads as a named data-quality KPI, and runs a 30/60/90 remediation sequence that narrows the gap on a schedule the board can follow.
Three neutral next steps fit on this week’s agenda:
- Audit UTM and click ID capture. Pull a sample of last month’s new CRM leads and check what percentage have a populated utm_source field and a gclid or li_fat_id. That number is your current unattributed-lead percentage baseline.
- Check whether original source fields survive. Find a lead that submitted a form more than once and confirm the first-touch source was not overwritten by the second submission. If it was, the source-field logic needs a write-once guard.
- Confirm which conversion events are driving bidding. In Google Ads, open the conversion actions list and identify which events are marked “Primary” and therefore used for Smart Bidding optimization. If form fills or content downloads are primary, the account is training toward the wrong audience.
SaaSHero is the team that owns the chain from impression to CRM record, including paid media, creative, landing pages, attribution, and strategy on one accountability line, with optimization tied to qualified pipeline instead of form-fill counts. If the gap between your agency’s dashboard and your CRM is the problem, this engagement is built for that situation.
Talk To SaaSHero About Owning Your Measurement Chain