




Written by: Aaron Rovner, Founder, Saas Hero | Last updated: July 21, 2026
Key Takeaways for Your CAC Strategy
- Most B2B SaaS companies underestimate their true CAC by 2–3× when they count only ad spend and ignore salaries, tools, and overhead.
- Accurate CAC depends on clean CRM exports of net-new logos, full ad-platform spend, fully burdened payroll, tool costs, and a lag-adjusted window that matches your sales cycle.
- The fully loaded numerator sums paid media, prorated S&M salaries and commissions, tools, agencies, content, and allocated overhead, then divides by net-new customers to produce a board-ready figure.
- Channel-level CAC, payback period, and LTV:CAC benchmarks for 2026 show referral and SEO as the most efficient channels, while paid search and LinkedIn often require 14–24 months to recover costs.
- Book a discovery call with SaaSHero to receive the free fully-loaded CAC spreadsheet with pre-built formulas and 2026 benchmark tabs.
Prerequisites: Data You Need Before Calculating CAC
Accurate CAC calculation depends on data from several systems that all describe the same period and customer set.
- CRM export: A list of net-new customers (new logos only) closed in the measurement period. Renewals, expansions, and resurrected churned accounts must be excluded. Counting expansion ARR as new customers can under-report CAC.
- Ad platform exports: Total spend by channel (Google Ads, LinkedIn Ads, Meta, Microsoft Ads) for the measurement period, plus any agency retainer fees tied to those channels.
- Payroll data: Fully burdened compensation (base salary, variable comp, benefits, employer payroll taxes) for every sales and marketing team member. Fully burdened sales headcount can materially increase per-customer acquisition cost before any media spend is counted.
- Tool and software costs: CRM, marketing automation, SEO platforms, sales intelligence tools (ZoomInfo, Clay, 6sense), analytics suites, and outreach platforms.
- Attribution setup: UTM parameters on all paid campaigns, GCLID or LinkedIn Insight Tag passing through to CRM, and an attribution window set to at least 1.5× your average sales cycle length.
- Gross margin figure: Required for CAC payback period and LTV:CAC calculations. CAC payback period is calculated as CAC ÷ (ARPA × Gross Margin) in months. Omitting gross margin understates true payback.
- Overhead allocation rate: Shared overhead (facilities, IT, administrative support) can be allocated into the CAC calculation based on the proportion of S&M headcount.
The Fully-Loaded CAC Framework: Steps 1–5
Steps 1–2: Build Your Denominator and Numerator
Step 1: Define Your Measurement Period and Denominator
Purpose: Set a clean, consistent time window so the spend in your numerator matches the customers in your denominator.
Actions:
- Choose a quarterly window as the default. Monthly windows add noise, and annual windows hide seasonal patterns.
- Once you define your quarter, pull net-new closed-won customers from your CRM for that period. Count only new logos and keep renewals or expansions for a separate retention analysis.
- Because customers closed in one quarter often come from spend in the prior quarter, apply a lag adjustment equal to your average sales cycle to align spend with acquired customers.
Inputs: CRM closed-won report and average sales cycle length in days.
Output: A single integer that represents net-new customers acquired in the period.
Decision point: Use a lagged method when your sales cycle exceeds 90 days. A same-quarter window works when the cycle is under 30 days.
Example: A $5M ARR HR Tech SaaS with a 60-day average sales cycle closes 18 new logos in Q3. The team uses Q2 plus Q3 blended spend against Q3 customers.
Validation tip: Cross-check your customer count against invoicing records. Discrepancies between CRM and billing data are a common source of denominator inflation.
Step 2: Build the Fully-Loaded Numerator
Purpose: Capture every dollar spent on acquiring new customers, not just ad spend. Most companies underestimate their true CAC by 2–3× when calculating only ad spend instead of the full set of acquisition costs.
Actions:
- Start with all paid media spend for the period across every channel, since this is the most visible acquisition cost.
- Next, add the human cost of acquisition: fully burdened salaries for SDRs, AEs, and marketing team members, prorated by the percentage of time spent on new-customer acquisition.
- Include all sales commissions and bonuses paid on new logos closed in the period, because these incentives directly support acquisition.
- Add the full cost of your marketing and sales tool stack (CRM, outreach, enrichment, analytics, ABM platforms), which exists to support acquisition and pipeline.
- Add agency retainer fees and contractor costs tied to acquisition activities, along with content production costs for acquisition-focused assets such as copywriting, design, and video.
- Finally, add allocated overhead by applying your S&M headcount percentage to shared facility, IT, and administrative costs, since these indirect costs still support acquisition.
Important exclusions: Do not include customer success salaries, onboarding costs after first payment, product development, or post-acquisition support in your CAC numerator. These belong in cost-to-serve, not CAC.
Inputs: Payroll system, ad platform exports, accounts payable for tools and agencies, and overhead allocation rate.
Output: A single dollar figure that represents total fully loaded S&M spend for the period.
Decision point: Apply a simple growth test to any ambiguous cost. If the expense would not exist without the company trying to acquire new customers, include it. If it would exist anyway, exclude it.
Example: Including all S&M expenses rather than only advertising spend produces a more accurate CAC that aligns with board expectations.
Validation tip: Compare your numerator to your total S&M line on the P&L. When your CAC numerator is less than 60% of that line, you are likely undercounting.
Interactive CAC Calculator and Spreadsheet Companion
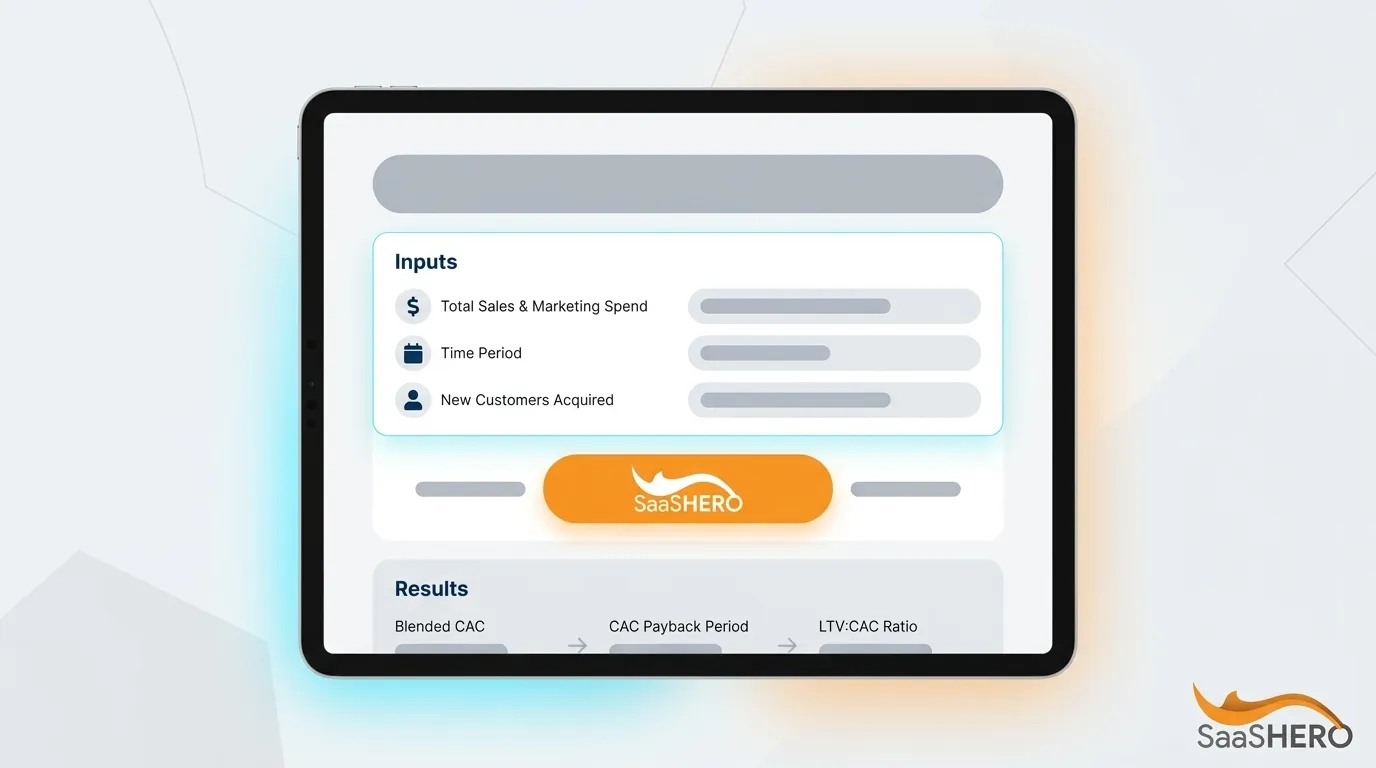
Use the inputs below to calculate your fully loaded CAC, CAC payback period, and LTV:CAC ratio in real time. This calculator shows whether your current acquisition spend is sustainable by revealing how quickly you recover costs and how much lifetime value each customer generates at your current burn rate. Enter figures for your most recent full quarter.
| Input | Your Figure | Notes |
|---|---|---|
| Total paid media spend ($) | [Enter] | All channels combined for the period |
| Fully burdened S&M salaries ($) | [Enter] | Prorated by % time on acquisition |
| Sales commissions & bonuses ($) | [Enter] | New logo deals only |
| Tools & software ($) | [Enter] | CRM, outreach, enrichment, analytics |
| Agency & contractor fees ($) | [Enter] | Paid media management, content, design |
| Allocated overhead ($) | [Enter] | S&M % × shared facility + IT costs |
| Net new customers acquired | [Enter] | New logos only, lag-adjusted |
| Average MRR per new customer ($) | [Enter] | New logo ACV ÷ 12 |
| Gross margin (%) | [Enter] | Typically 70–85% for B2B SaaS |
| Average customer lifespan (months) | [Enter] | Used for LTV only, calculated as 1 ÷ monthly churn rate |
Formulas applied by the calculator:
- Fully-Loaded CAC = Total S&M Spend ÷ Net New Customers
- CAC Payback Period (months) = CAC ÷ (Monthly ARPA × Gross Margin %)
- LTV = Monthly ARPA × Gross Margin % × Average Customer Lifespan (months)
- LTV:CAC Ratio = LTV ÷ CAC
Get the spreadsheet version with pre-built formulas, benchmark tabs, and board-ready charts by scheduling a discovery call with SaaSHero. The team will send the fully loaded CAC spreadsheet directly to your inbox.
Steps 3–5: Calculate and Segment Your CAC
Step 3: Calculate Blended and Channel-Level CAC
Purpose: Blended CAC alone hides whether acquisition is efficient or wasteful at the channel level. A 4:1 overall LTV:CAC ratio can mask a 1:1 paid channel and a 10:1 organic channel, which leads to misallocated budgets.
Actions:
- Divide your total fully loaded spend by net-new customers to get blended CAC.
- For each paid channel, divide channel-specific spend (media, prorated agency, prorated tool costs) by customers attributed to that channel in your CRM.
- Calculate organic CAC by dividing content, SEO tool, and prorated content-team salary costs by customers attributed to organic search and referral.
- Flag any channel where paid CAC exceeds three times blended CAC as a candidate for budget reallocation.
Decision point: Paid CAC usually runs higher than blended CAC because many customers arrive through unpaid channels. When paid CAC rises above three times blended CAC, organic channels are subsidizing paid performance and the mix needs review.
Example: A $10M ARR cybersecurity SaaS finds blended CAC of $3,200, Google Ads CAC of $6,800, and organic or referral CAC of $1,100. The paid channel consumes 55% of budget while delivering 30% of customers.
Validation tip: Connect ad-platform cost data to CRM opportunity records using UTM parameters, hidden form fields, and identity resolution so channel attribution reflects closed-won revenue instead of last-click leads.
Step 4: Calculate CAC Payback Period and LTV:CAC
Purpose: CAC only becomes useful when you compare it to how quickly you recover it and how much value each customer generates over time.
Actions:
- Calculate gross-margin-adjusted CAC payback using the formula defined in the prerequisites section. Express the result in months.
- Calculate LTV as Monthly ARPA × Gross Margin % × Average Customer Lifespan (months), where lifespan equals 1 ÷ monthly churn rate.
- Divide LTV by CAC to get your LTV:CAC ratio.
- Compare both outputs to the 2026 benchmarks in the table below.
Decision point: A healthy LTV:CAC range for B2B SaaS is 3:1 to 5:1. Ratios below 3:1 indicate overspending relative to customer value, while ratios above 5:1 usually signal underinvestment in growth.
Example: CAC = $4,750. Monthly ARPA = $600. Gross margin = 78%. Payback = $4,750 ÷ ($600 × 0.78) = 10.1 months. LTV with a 36-month lifespan equals $600 × 0.78 × 36 = $16,848. LTV:CAC equals 3.5:1, which falls within healthy 2026 ranges.
Validation tip: Ignoring gross margin understates true CAC payback. Use gross-margin-adjusted payback for board reporting.
Step 5: Segment CAC by Customer Cohort and GTM Motion
Purpose: Blended CAC across all segments hides which customer types and GTM motions actually create profit.
Actions:
- Separate new customers by segment (SMB, mid-market, enterprise) and recalculate CAC for each cohort using segment-specific spend and customer counts.
- Separate by GTM motion (self-serve or PLG, sales-assisted, field sales) when those motions exist.
- Calculate LTV:CAC and payback for each cohort independently.
- Identify which cohorts fall below a 3:1 LTV:CAC or above your stage-appropriate payback benchmark, and flag them for go-to-market review.
Decision point: When enterprise CAC payback exceeds 24 months without NRR above 110%, the motion requires structural review. CAC payback above 18 months also increases the risk of a down round or stalled growth at the next financing event.
Example: A $15M ARR MarTech SaaS finds SMB CAC payback of 9 months, which looks healthy, but enterprise CAC payback of 28 months, which looks concerning. The enterprise motion requires either ACV expansion or sales cycle compression before the team scales spend.
Validation tip: Break out CAC by ICP segment, paid channel, and campaign type at minimum. When data infrastructure allows, add placement and creative variant to identify subsidized combinations before they compound.
2026 B2B SaaS Channel-Efficiency Benchmarks and How to Use Them
The table below presents 2026 CAC ranges by acquisition channel for B2B SaaS companies using blended fully loaded cost methodology. All figures include prorated salaries, tools, and overhead in addition to direct media spend. Figures are expressed in USD and represent blended medians across SMB-to-mid-market motions unless noted. Use these benchmarks to spot channels that perform within expected ranges and those that need budget reallocation. Any channel where your CAC exceeds the upper bound by more than 20% should trigger a budget review.
Note: Enterprise-motion CAC figures run substantially higher across all channels. Sales-led enterprise CAC reached a median of $11,400 in 2026, driven by longer cycles, larger buying committees, and rising SDR compensation. These figures are not directly comparable to the SMB and mid-market ranges above and should be evaluated against enterprise-specific payback benchmarks of 18–24 months.
Common CAC Calculation Mistakes to Avoid
Several recurring errors systematically distort CAC and lead to poor unit-economics decisions, especially when teams move fast.
- Last-click attribution: Last-touch attribution understates true CAC compared to multi-touch models. Use position-based or time-decay models for B2B sales cycles exceeding 60 days.
- Excluding salaries: Excluding salaries understates true acquisition cost by 30–60%. Every SDR, AE, and marketing team member whose time touches new-customer acquisition must be included, prorated by time allocation.
- Counting only ad spend: Counting only ad spend, the 2–3× underestimation mentioned earlier, is one of the most common errors and hides the real cost of growth.
- Mismatched time windows: Matching January spend against January customers when the sales cycle is 90 days produces a distorted CAC. Apply the lag adjustment described in Step 1.
- Counting trial signups or MQLs as customers: Only paying customers belong in the denominator. Only customers who paid should be counted in the CAC denominator, not trial signups.
- Ignoring onboarding costs that precede first payment: Pre-revenue onboarding salaries and incentives paid before a customer becomes profitable are acquisition costs, not retention costs.
- Omitting overhead allocation: Teams counting only media spend overstate efficiency by 30–50% compared to fully loaded figures that include tool costs and sales overhead.
- Using a blended CAC to make channel decisions: CAC swings more than 100× by channel in B2B SaaS: $200–$800 on brand search versus $5,000–$35,000 on LinkedIn or ABM. Blended figures hide this variance and lead to misaligned budgets.
How to Validate and Measure Your CAC
After you calculate fully loaded CAC, validate the figure across three systems before presenting it to the board or using it for budget decisions.
Ad platform reconciliation: Sum total spend across Google Ads, LinkedIn Campaign Manager, and any other active platforms. This figure should match your paid media line in the CAC numerator. Discrepancies above 5% indicate missing channel spend or double-counting.
CRM pipeline audit: Pull the closed-won report filtered to new logos only. Verify that the customer count matches your denominator and that no expansion deals, reactivations, or internal test accounts are included.
Finance reconciliation: Compare your CAC numerator to the S&M lines on the P&L for the same period. A rolling 90-day or two-quarter window is recommended instead of a single-month snapshot to reduce timing noise.
Handling long sales cycles: For companies with cycles exceeding 90 days, use cohort-based CAC. Group customers by the quarter in which they first entered the pipeline, then attribute the S&M spend from that quarter and the subsequent quarter to that cohort. This method prevents distortion when a growth quarter inflates the denominator while the associated spend sits in prior periods.
Attribution loss adjustment: Privacy changes from Apple’s iOS 14.5, GDPR enforcement, and third-party cookie deprecation have degraded audience targeting precision, and attribution loss from cookie deprecation can inflate reported CAC. Apply a 20–30% upward adjustment to reported paid CAC figures when server-side tracking is not in place to account for untracked conversions that are being credited to direct or organic.
Advanced Variations for Multi-Channel and Mature Attribution Setups
Teams with sophisticated tracking infrastructure can extend this framework to capture more nuanced channel performance and account behavior.
Multi-touch attribution models: Match attribution models to sales cycle length. Use U-shaped models with 40% credit to first touch, 40% to lead creation, and 20% distributed for 3–6 month cycles. Use W-shaped models with 30% credit to first touch, 30% to lead creation, and 30% to opportunity creation for 6–9 month cycles, and full-path models for 9–12+ month cycles. These approaches distribute conversion credit across all contributing touchpoints instead of awarding it entirely to the last click.
Account-based CAC: For companies selling to buying committees, aggregate all touchpoints across multiple contacts within a single account before calculating channel CAC. Account-based attribution in HubSpot aggregates touchpoints across multiple contacts, such as a CMO via LinkedIn ad and a director via whitepaper, to produce accurate channel influence data.
Dark funnel estimation: An estimated 60–70% of B2B SaaS pipeline attributed to “direct” or “unknown” traffic is actually unattributable dark social from Slack DMs, podcast mentions, and LinkedIn comments. Supplement platform attribution with pipeline surveys that ask new customers how they first heard of the product. Allocate a portion of “direct” spend back to the channels most frequently cited.