




Written by: Aaron Rovner, Founder, Saas Hero | Last updated: July 27, 2026
Key Takeaways
- Traditional analytics stacks focused on vanity metrics like impressions and clicks fail to answer board-level questions about Net New ARR, CAC payback, and churn.
- A four-layer architecture with traffic, product behavior, revenue analytics, and BI, all connected through a shared CRM customer identifier, is required to close the gap between ad spend and closed-won revenue.
- Privacy changes and consent rejection create 30–55% data gaps in traditional tools, which makes privacy-first alternatives like Plausible, Fathom, and PostHog essential for complete attribution.
- Stage-specific stack recommendations range from under $100 per month for early-stage teams to $3,000–$8,000 per month for scale-stage companies, with clear tool pairings at each ARR level.
- SaaSHero builds GCLID-to-closed-won attribution architectures that connect ad clicks to revenue. Book a discovery call to audit your current analytics stack.
SaaS Analytics in 2026: From Siloed Tools to Revenue Stacks
Most SaaS companies now run several analytics and reporting platforms, yet many still operate with disconnected data. Traffic lives in GA4, product events in Mixpanel, revenue in ChartMogul, and pipeline in HubSpot, but no shared customer identifier ties these views together.
SegmentStream’s 2024 measurement landscape report identified CRM-anchored attribution as the dominant pattern among B2B teams reporting to finance, citing reconciliation requirements as the primary driver. At the same time, Snowflake and BigQuery emerged as the fastest-growing storage layers for marketing attribution data, with warehouse-modeled measurement gaining share against suite-native reporting.
Privacy regulation is increasing the pressure on these stacks. Google’s Consent Mode v2 enforcement took effect in March 2024 alongside EU Digital Markets Act requirements, which moved consent-aware measurement from optional to mandatory for any B2B brand running paid media into European markets. Traditional analytics tools miss 30–40% of users due to ad blockers and consent rejection, so any revenue attribution built only on those tools remains structurally incomplete.
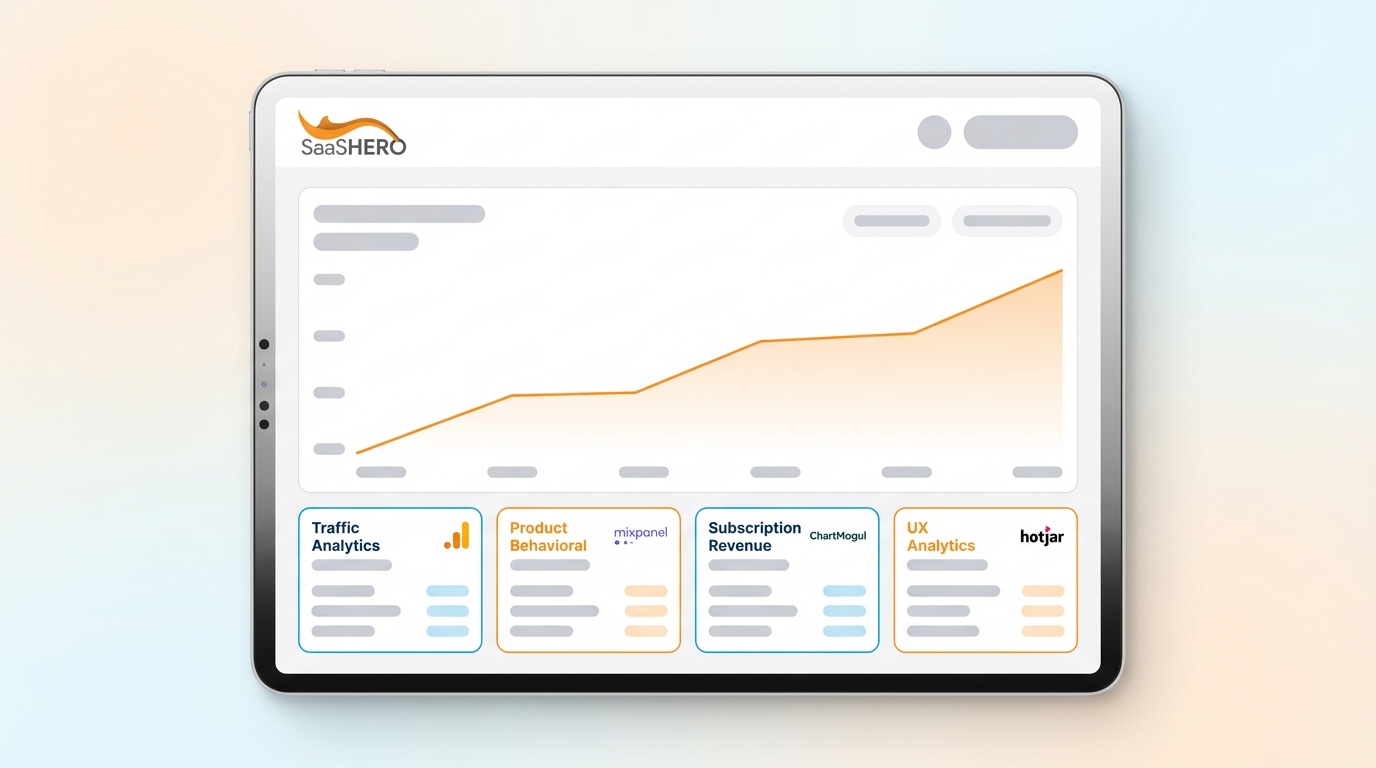
The 2026 architecture that addresses these pressures uses a four-layer stack. The traffic layer, product behavior layer, revenue analytics layer, and BI layer all connect at the warehouse level, with the CRM serving as the canonical customer record. The following table maps the leading tools across each layer and highlights privacy-first alternatives.
Master Comparison Table: Every Recommended Tool at a Glance
| Category | Leading Options | Privacy-First / Open-Source Alternative | Primary Metric Tracked |
|---|---|---|---|
| Traffic & Acquisition | GA4, Google Search Console | Plausible, Fathom | Sessions, channel, organic visibility |
| Product Behavior | Amplitude, Mixpanel | PostHog (self-hostable) | Activation, retention, feature adoption |
| Revenue Analytics | ChartMogul, Baremetrics | ProfitWell (free tier) | MRR, ARR, churn, LTV, payback |
| UX & Session Replay | FullStory, LogRocket | PostHog (session replay module) | Friction points, drop-off flows |
| Attribution & CRM | HubSpot, Salesforce | HubSpot free tier (limited) | Pipeline, closed-won ARR, GCLID linkage |
| Error Monitoring | Sentry | Sentry (open-source self-hosted) | Error rate, performance degradation |
| BI & Dashboards | Looker, Looker Studio | Metabase (open-source) | Cross-functional ARR, CAC, LTV views |
Traffic & Acquisition Analytics for B2B SaaS
GA4 and Google Search Console still form the default traffic layer for most B2B SaaS teams. GA4 provides session-level behavioral data and connects with Google Ads for GCLID-based conversion import. Search Console surfaces organic keyword performance and click-through rates that guide SEO priorities.
The main limitation is data completeness. Requiring cookie consent for traditional analytics causes 30–55% of visitors to decline or withhold consent, which results in undercounted traffic and broken conversion attribution. For teams running paid media into EU markets, this previously mentioned data gap directly distorts CAC calculations.
Plausible and Fathom are recommended privacy-focused alternatives to GA4 for traffic analytics when teams want simpler dashboards and lighter scripts. Plausible’s script weighs 2.5 KB gzipped versus GA4’s 135 KB gzipped (or more when including Tag Manager), which improves Core Web Vitals. Fathom’s architecture is designed to achieve GDPR compliance by processing data anonymously in aggregate without cookies.
The practical path for most teams is a hybrid approach. Use Plausible or Fathom for complete traffic visibility and keep GA4 for Google Ads conversion import and GCLID passthrough to the CRM.
Product Behavior Analytics: Choosing PostHog, Mixpanel, or Amplitude
B2B SaaS companies at the $500k–$10M ARR stage primarily rely on Amplitude, Mixpanel, and PostHog because these platforms support multi-user account tracking, cohort retention analysis, and expansion revenue metrics that connect directly to Net New ARR visibility.
Amplitude leads product analytics at scale with behavioral cohort analysis, AI-powered predictive segmentation for churn and activation, and built-in A/B testing. Amplitude also offers AI-powered anomaly detection and automated insight generation for larger teams.
PostHog serves as the open-source alternative. PostHog is recommended as the default product analytics tool for founder-led technical teams because it combines events, funnels, cohorts, feature flags, and session replay in one platform with a generous free tier. Self-hosting PostHog removes third-party data transfer concerns and satisfies GDPR requirements without consent banners for product telemetry.
The trade-off centers on implementation depth. Mixpanel and Amplitude ship with richer out-of-the-box B2B account grouping and enterprise SSO. PostHog demands more engineering effort to configure account-level tracking but returns full data ownership and avoids per-event pricing at scale.
Revenue Analytics Platforms for Subscription Metrics
ChartMogul offers a free tier for companies under $120K ARR with native MRR, ARR, churn, LTV, and ARPU tracking plus segmentation by plan, geography, and acquisition channel, plus benchmarking against 30,000+ SaaS companies. Baremetrics provides real-time MRR, ARR, churn, and LTV tracking via native Stripe webhooks and 12-month forecasting, and its Recover feature achieves a median attempted recovery rate of 12.7% across sampled companies.
ProfitWell delivers completely free MRR, ARR, churn, LTV, and ARPU tracking with industry benchmarking and no usage limits, which makes it suitable for pre-revenue through Series A SaaS companies. For teams not yet ready to invest in ChartMogul’s paid tiers, ProfitWell provides a solid revenue visibility foundation at zero cost.
These platforms do not natively connect to ad channel spend. Teams that want CAC payback visibility must pass acquisition channel data from the CRM into the revenue analytics tool at the customer level. The integration playbook below outlines that process.
Supporting Tools: UX, CRM Attribution, Errors, and BI
UX and Session Replay. FullStory and LogRocket provide individual session recordings and rage-click heatmaps that highlight friction in onboarding and conversion flows. LogRocket or FullStory for session replay on key journeys is recommended for post-PMF teams. Teams already using PostHog for product analytics can rely on its session replay module and avoid a separate vendor.
Attribution and CRM. Many companies now use native reporting features inside HubSpot or Salesforce for attribution. HubSpot’s native multi-touch attribution and deal pipeline reporting cover the needs of most $500k–$5M ARR teams without extra attribution tools.
Error Monitoring. Sentry is recommended for error monitoring from the earliest stage, and its open-source self-hosted edition supports teams that require data sovereignty. Unresolved errors in onboarding flows directly suppress activation rates and therefore Net New ARR.
BI and Dashboards. Looker works well for data teams that want to standardize metrics across departments with a governed semantic layer. Databox aggregates data from 100+ sources including Stripe, HubSpot, and Google Analytics into pre-built SaaS MRR templates with 15-minute sync intervals. Metabase offers an open-source option for teams with a data warehouse and a limited BI budget.
Recommended Analytics Stack by Company Stage
| Stage | Core Tools | Est. Monthly Tool Cost |
|---|---|---|
| Early ($500k ARR) | GA4 + Plausible, PostHog (free), ProfitWell (free), Sentry (free tier), HubSpot (Starter), Looker Studio (free) | $20–$100/mo |
| Growth ($2–5M ARR) | GA4 + Fathom, Mixpanel or PostHog (paid), ChartMogul (paid), Sentry (Team), HubSpot (Professional), Metabase or Looker Studio | $500–$1,500/mo |
| Scale ($10M+ ARR) | GA4 + server-side tagging, Amplitude, ChartMogul (Scale), FullStory, Salesforce, Sentry (Business), Looker or Snowflake + dbt | $3,000–$8,000/mo |
Integration Playbook: Connecting GCLID to Closed-Won Revenue
In B2B SaaS, the same customer record exists across five systems, including Product, CRM, Billing, Support, and Marketing, and each system uses different identifiers, schemas, and event models that must be reconciled to answer questions such as lifetime value by marketing channel or features that predict churn. The following flow resolves that reconciliation problem by creating a single chain from ad click to revenue.
- Capture GCLID at the landing page. Pass the Google Click ID as a hidden field on every form and store it as a contact property in HubSpot or Salesforce at the moment of form submission. This GCLID becomes the durable link between the ad click and the contact record.
- Tag the lead source on the CRM contact. Use UTM parameters (utm_source, utm_medium, utm_campaign) alongside GCLID to populate a First Touch Channel field on the contact record. This channel label then supports cohort analysis by acquisition source.
- Fire product events with the CRM contact ID. When a trial user activates, pass the CRM contact ID as a user property in PostHog or Mixpanel. This step connects product behavior to the originating ad click and enables activation analysis by channel.
- Sync deal stage to the revenue analytics platform. When a deal moves to Closed-Won in HubSpot, trigger a webhook to ChartMogul or Baremetrics that stamps the new customer record with the acquisition channel from the CRM. This sync allows revenue metrics to be sliced by channel.
- Build the payback dashboard in Looker Studio or Metabase. Join channel-level ad spend imported from Google Ads with channel-stamped MRR cohorts from the revenue analytics platform. The recommended CAC payback calculation tracks cumulative gross margin contribution by cohort month and identifies the first month when cumulative margin exceeds CAC.
- Import offline conversions back to Google Ads. Upload the Closed-Won GCLID list to Google Ads as an offline conversion action. This feedback loop trains Smart Bidding on revenue signals rather than form fills and reduces CAC over time.
Common Pitfalls and Diagnostic Questions
Three failure patterns account for the majority of broken analytics stacks at the $500k–$10M ARR stage. Each pattern stems from treating analytics tools as isolated reporting surfaces instead of parts of a single revenue measurement system.
Last-click attribution hiding true channel performance. B2B marketing teams are treating GA4 as a traffic and engagement tool rather than a revenue attribution source, citing sampling and CRM integration limits. Last-click models systematically over-credit brand search and under-credit top-of-funnel paid channels. Diagnostic question: Can you report pipeline value by first-touch channel from your CRM today?
Free-tier over-reliance creating data gaps. Free tiers of GA4, HubSpot, and PostHog impose sampling thresholds, event limits, and data retention windows that corrupt cohort analysis at growth stage. Diagnostic question: Are your product analytics cohorts based on complete event data or sampled exports?
Negative-keyword gaps inflating CPL. Navigational search traffic, such as users searching a competitor’s brand name to find the login page, converts at near-zero rates but still consumes budget. Median blended CAC payback for B2B SaaS companies reached 18 months in 2026. Wasted spend on navigational queries directly contributes to that stretch. Diagnostic question: Does your Google Ads account have negative keywords excluding competitor brand-only terms?
Three Team Archetypes: How Real B2B SaaS Teams Choose Their Stack
These pitfalls show up differently depending on team maturity and resources. The following three archetypes illustrate how real B2B SaaS companies at different stages should prioritize analytics investments to avoid the failure patterns above.
The Overwhelmed Founder ($500k ARR, team of five). This founder runs Google Ads on weekends and has GA4 installed but has never connected it to HubSpot. Revenue attribution does not exist yet. The right stack uses PostHog free tier for product analytics, ProfitWell for revenue metrics, GA4 plus Plausible for traffic, and HubSpot Starter for CRM. Total tool cost stays under $100 per month. The first integration priority is GCLID capture on the demo request form so that the first closed-won deal can be traced to a channel.
The Frustrated VP of Marketing ($5M ARR, Series A). This VP runs Mixpanel, GA4, HubSpot Professional, and ChartMogul, but none of these tools share a customer identifier. The board asks about CAC payback, and the VP can only report CPL. The fix is not more tools. The fix is a warehouse join in Looker Studio or Metabase that connects HubSpot deal data to ChartMogul MRR cohorts using the contact ID as the shared key, then imports offline conversions to Google Ads.
The Post-Funding Scaler ($10M ARR, freshly raised Series B). This team needs to deploy $50k per month in paid media efficiently and prove 80-day payback to investors. A 24-month analysis of 47 B2B SaaS companies found that referral and organic search channels deliver median payback of 6 months versus 18 months for paid social and conference channels. This team therefore needs channel-level payback visibility before scaling any single channel. The stack adds Amplitude for predictive churn scoring, Salesforce for enterprise deal tracking, and a Snowflake warehouse to join all sources at the account level.
Frequently Asked Questions
How much should a B2B SaaS company at $1M ARR budget for its analytics stack?
Tool fees for a functional revenue-first analytics stack at the $1M ARR stage usually remain modest. ProfitWell covers revenue metrics at no cost. PostHog’s free tier handles product analytics up to 1 million events per month. GA4 is free. HubSpot Starter covers CRM and basic attribution at around $50 per month. Sentry’s developer tier is free for low event volumes. The main investment at this stage is engineering time to instrument events correctly and connect the GCLID-to-CRM flow, not tool licensing.
Who should own the analytics stack, marketing, product, or engineering?
Ownership should be split by layer instead of consolidated under one function. Marketing owns the traffic and attribution layer with GA4, Google Ads, and HubSpot. Product owns the product behavior layer with PostHog or Mixpanel. Engineering owns the error monitoring and data pipeline layer with Sentry and tools like Segment or RudderStack. Finance or a dedicated revenue operations function owns the revenue analytics layer with ChartMogul or Baremetrics. A BI tool such as Looker Studio or Metabase serves as the shared reporting surface that all functions read from. Without this split, the most politically powerful team tends to own everything and optimize for its own metrics instead of Net New ARR.
How long does it take to get CAC payback visibility after implementing this stack?
The GCLID-to-CRM integration can be completed quickly for teams already using HubSpot and Google Ads. Meaningful payback data requires at least one full sales cycle of closed-won deals tagged with acquisition channel, the 14 to 45 day window typical for SMB-focused SaaS, longer for mid-market deals. The first actionable payback report by channel depends on having enough closed-won data after implementation. Teams that have never captured GCLID at the form level will have no historical data and must start the clock from implementation date.
Is PostHog a viable replacement for Mixpanel or Amplitude at growth stage?
PostHog works as a viable replacement for Mixpanel at the growth stage for teams with engineering resources to manage self-hosting and event instrumentation. It covers events, funnels, cohorts, feature flags, session replay, and A/B testing in a single platform with no per-event pricing at scale. The main gap versus Amplitude appears in AI-powered predictive segmentation and enterprise account management features. Teams that need churn prediction models and automated anomaly detection without building them in-house will find Amplitude’s paid tiers more productive. Teams that prioritize data ownership, GDPR compliance without consent banners, and cost control at high event volumes will often find PostHog superior.
What is the biggest mistake B2B SaaS teams make when building their analytics stack?
The most common mistake is instrumenting tools before defining the questions those tools must answer. Teams install GA4, Mixpanel, and ChartMogul, then attempt to reverse-engineer revenue attribution from whatever data happens to be available. The correct sequence starts with the board-level metrics, including Net New ARR, CAC payback by channel, activation rate, and net revenue retention, then works backward to identify which events, identifiers, and integrations are required to produce those numbers. Every tool decision and every tracking implementation should be evaluated against whether it moves one of those metrics from unknown to known.
Conclusion: Run Your Internal Analytics Stack Audit
The 2026 analytics landscape offers many tools, but architecture remains the real constraint. Teams must connect traffic data, product events, and billing records through a shared customer identifier anchored in the CRM, then surface the output as CAC payback by channel and Net New ARR by cohort.
The four-layer framework of traffic, product behavior, revenue analytics, and BI applies at every ARR stage. The tools change over time, but the architecture does not. Early-stage teams build it lean with PostHog, ProfitWell, and Looker Studio. Growth-stage teams add Mixpanel or Amplitude, ChartMogul, and a warehouse join. Scale-stage teams move to Snowflake, Amplitude, and Salesforce with server-side tagging and survival-analysis payback models.
The integration playbook in this guide, including GCLID capture, CRM channel stamping, product event linkage, and offline conversion import, provides the mechanism that turns ad spend into measurable closed-won revenue. Without this chain, every analytics tool in the stack reports in isolation and the board question about payback period stays unanswered.