




Written by: Aaron Rovner, Founder, Saas Hero
Key Takeaways
- Enterprise B2B marketing leaders own revenue targets but often must justify spend through last-click attribution that undervalues upper-funnel channels.
- The Revenue-First Allocation Model works backward from revenue targets to required pipeline, marketing-sourced pipeline, and investment using historical win rates and CAC ratios.
- Brand investment in B2B can follow the 46/54 brand-to-activation benchmark from LinkedIn/IPA research, supported by proxy metrics like branded search volume and pipeline velocity.
- Mid-year reallocation works best with a 5–20% contingency pool and a quarterly review cadence that shifts budget toward higher marginal ROI channels without contract complications.
- SaaSHero provides flat-retainer pricing based on total ad spend that enables strategic budget reallocation without additional fees or contract negotiations.
See How SaaSHero Builds Revenue-First Budgets
Executive Summary and Core Concepts
The Revenue-First Allocation Model gives you a simple, repeatable way to turn a revenue target into a channel-level budget.
The model runs in five steps:
- Start with the revenue target
- Work backward to required pipeline using historical win rates and average deal size
- Work backward to required marketing-sourced pipeline using historical marketing contribution percentage
- Work backward to required marketing investment using historical CAC or pipeline-to-spend ratio
- Allocate across channels based on marginal ROI, not historical averages
These definitions keep the rest of the guide concrete:
- Revenue-First Allocation: Building budget from a revenue target rather than from last year's spend plus an increment
- Marginal ROI: The return on the next dollar invested in a channel, not the average return on all dollars already invested
- Pipeline Coverage Ratio: Required pipeline divided by revenue target, typically 3–4x for enterprise B2B
- CAC Payback: Months required to recover customer acquisition cost from gross margin
Review Your Allocation Model With SaaSHero
How the 70/20/10 Rule Fits a Revenue-First Model
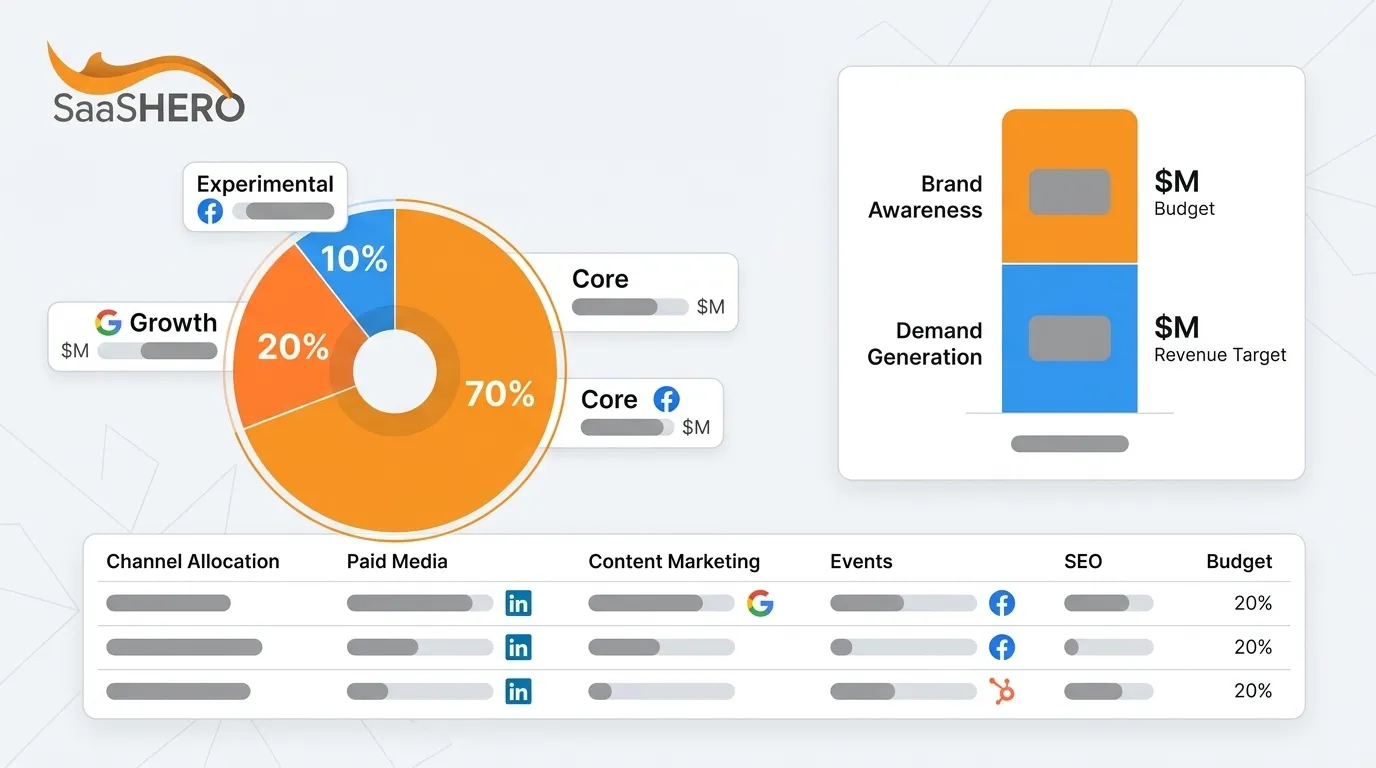
The 70/20/10 rule offers a simple way to categorize spend inside a revenue-first plan.
The rule allocates 70% of budget to proven, high-performing channels, 20% to emerging channels with strong but unproven potential, and 10% to experimental or high-risk initiatives. It works best in stable markets with established product-market fit and predictable channel performance.
The rule breaks down when a channel hits saturation and marginal ROI turns negative, or when market disruption invalidates the historical performance data that justified the 70% allocation. A revenue-first approach uses 70/20/10 as a starting structure, then adjusts each bucket based on marginal ROI and pipeline impact.
Applying 70/20/10 in enterprise B2B usually follows four steps:
- Identify proven channels, typically paid search and LinkedIn for B2B
- Define what “emerging” means for your category, such as a new platform, format, or audience segment
- Protect the 10% experimental budget from being reabsorbed into proven channels mid-year
- Review allocation quarterly, not annually
Other allocation frameworks you may need to reconcile with a revenue-first plan include:
- 60/40 Rule (Binet & Field): 60% brand building, 40% sales activation, derived primarily from consumer campaigns analyzed in the IPA Databank
- 70/30 Rule: A starting-point paid media split that allocates 70% to demand capture and 30% to demand creation (awareness), typically for mid-market and growth-stage companies, adjusted for brand maturity and competitive position
- 46/54 Rule (LinkedIn/IPA Benchmark): 46% brand, 54% activation, the B2B-specific ratio from Binet & Field's work with the LinkedIn B2B Institute
How to Build a Marketing Budget From a Revenue Target
This worked example shows how to turn a revenue goal into a channel-level plan using your own numbers.
The example uses a $5M ARR B2B SaaS company (growth-stage, bootstrapped) targeting 30% year-over-year growth, with a total marketing budget of 12% of ARR ($600K annually).
Step 1: Start With the Revenue Target
- Current ARR: $5M
- Target ARR: $6.5M
- Net new revenue required: $1.5M
Step 2: Work Backward to Required Pipeline
- Historical win rate: 25%
- Average deal size: $50,000
- Required closed deals: $1.5M ÷ $50,000 = 30 deals
- Required pipeline: 30 ÷ 0.25 = $6M in qualified opportunities
- Pipeline coverage ratio: $6M ÷ $1.5M = 4x
Step 3: Work Backward to Required Marketing-Sourced Pipeline
- Historical marketing contribution: 40% of pipeline
- Required marketing-sourced pipeline: $6M × 0.40 = $2.4M
Step 4: Work Backward to Required Marketing Investment
- Historical pipeline-to-spend ratio: $4 of pipeline per $1 of marketing spend
- Required marketing investment: $2.4M ÷ $4 = $600K
- As a percentage of revenue: $600K ÷ $6.5M = 9.2%
Step 5: Allocate Across Channels Based on Marginal ROI
Allocate based on where the next dollar produces the highest return, not on historical averages. Use channel-level CAC and payback period to identify where marginal ROI is highest.
Gartner's 2026 CMO Spend Survey found marketing budgets averaged 7.8% of company revenue. Paid media reached a five-year high of 31.4% of marketing budget, and digital channels accounted for 67.5% of marketing expenses.
Use these benchmarks as guardrails, not as a substitute for your own economics:
- Gartner 2026 CMO Spend Survey: 7.8% of revenue average
- The CMO Survey (Deloitte/Duke): 9.0% of revenue
- B2B product companies average 7.0% while B2B services average 10.1%
The gap between these figures is structural. Gartner samples large enterprises, while The CMO Survey includes smaller firms that spend a higher share of revenue on marketing. For planning, use a range of 7–10% of revenue and adjust for your business model.
For more detail on connecting spend to pipeline outcomes, see B2B SaaS Marketing Budget Allocation: A Revenue-First Guide and How to Allocate B2B SaaS Marketing Budget Efficiently.
See a Revenue-First Budget Built Live
Brand vs. Demand: How to Split Your Enterprise Marketing Budget
A revenue-first budget still needs a clear split between brand building and demand capture.
Binet and Field's IPA research found the optimal B2C split is approximately 60% brand and 40% activation. Their B2B-specific work with the LinkedIn B2B Institute puts the optimum closer to 46% brand and 54% activation. The report notes this was their first foray into B2B effectiveness and that sample sizes are small, but the direction of travel is clear.
The Ehrenberg-Bass Institute's 95:5 rule holds that only about 5% of B2B buyers are in-market at any given time. Spending the majority of budget chasing that 5% while ignoring the 95% who will buy later is impatience with a budget line attached, not a strategy. IPA data shows combining brand-building and demand-generation delivers approximately six times more effectiveness than demand-only campaigns.
The table below shows the gap you are defending against. Typical B2B practice puts only 25–33% of budget into brand, roughly half the 46/54 benchmark. The CFO script that follows is designed to justify reversing that underinvestment.
| Framework | Brand % | Activation % | Typical Use Case |
|---|---|---|---|
| Binet & Field 60/40 | 60% | 40% | B2C campaigns with broad reach |
| LinkedIn/IPA 46/54 | 46% | 54% | B2B companies with long sales cycles |
| Typical B2B Practice | 25–33% | 67–75% | Demand capture-heavy budgets that underinvest in brand |
The CFO Defense Script:
“Brand spend does not show up cleanly in the pipeline report because attribution cannot capture it. When a buyer searches for our category six months from now, they will already know our name, and that is why branded search typically converts at roughly 2 to 3 times the rate of non-branded search, with branded conversion rates around 4–8% versus 1–2.5% for non-branded. The 46/54 split reflects what the IPA's effectiveness data shows works for B2B companies with our sales cycle length.”
When last-click attribution fails to capture brand impact, use these proxy metrics instead:
- Branded search volume via Google Search Console
- Direct traffic volume and conversion quality
- Share of voice against competitors
- Pipeline velocity from opportunity creation to closed-won
For a deeper treatment of attribution mechanics, see Marketing Attribution Models for Budget Optimization.
Align Your Brand and Demand Split With SaaSHero
How to Reallocate Marketing Budget Mid-Year Without a Contract Fight
A revenue-first plan needs a way to move money as channel performance shifts during the year.
McKinsey's May 2026 budgeting research found that leading companies shift 10 to 20 percent of capital year over year, and increasingly in-year, toward higher-return opportunities. Teams that conduct a formal mid-year reallocation achieve 2.6x higher H2 performance versus H1 compared with teams that continue executing the original annual plan unchanged.
The Governance Model:
Three elements make mid-year reallocation work as a system.
- Reserve 5–20% of total budget as a contingency pool at the start of the year. High-performing teams allocate 18% of their budget to reserve funds for mid-year reallocation, while bottom-quartile teams allocate just 3%. Without a reserve, any mid-year shift feels like a cut, not a reallocation.
- Define decision criteria that release that pool, such as channel saturation, marginal ROI decline, or a new channel opportunity with better economics. These triggers keep decisions tied to data instead of opinion.
- Establish a quarterly review cadence with pre-defined triggers so reallocation happens on a schedule, using agreed rules, rather than during ad hoc budget fights.
Decision Criteria for Mid-Year Shifts:
- Channel saturation, where marginal ROI has turned negative
- A measured marginal CAC exceeding 1.3x the planned marginal CAC, sustained for 2 weeks, which signals a cut to floor and reallocation to the next-best marginal return channel
- Payback period extending past 18 months on a channel that previously sat under 12
- New channel opportunity with demonstrated lower CAC
The Contract Structure Problem: Per-channel agency pricing makes reallocation expensive. Testing a new channel raises fees before it has returned anything. Moving budget off one channel reduces what the agency bills, so pricing makes reallocation the hardest recommendation to give.
SaaSHero's flat retainer is based on total ad spend, not channel count. When the fee does not change with channel mix, reallocation becomes a strategic decision rather than a contract negotiation. Reallocation costs the client nothing in fees and earns SaaSHero nothing extra, whether that means moving budget from LinkedIn to Google, testing Meta alongside an existing search program, or shutting down a channel that is not returning.
Enterprise B2B Specifics: Why B2C Allocation Models Fail
Enterprise B2B marketing behaves differently from B2C, so B2C allocation models often mislead budget decisions.
Three structural differences matter most.
Long Sales Cycles: Dreamdata's 2026 benchmarks put the average tracked B2B buying journey at 272 days across 88 touchpoints and four channels. B2C attribution windows of 7–30 days often fail to capture B2B conversion patterns, which typically require longer windows of 30–90 days for B2B SaaS and mid-market deals and 90–365 days for enterprise and complex B2B sales cycles. Last-click attribution in a six-to-nine-month cycle credits the branded search that happened after the decision was made.
Buying Committees: Gartner research puts the median B2B buying group at six to ten decision makers. B2C models assume single-buyer decisions. A campaign optimized for one decision-maker's conversion behavior will systematically underperform in a committee-driven purchase.
CRM-Based Measurement: The click is recorded in Google Ads, and the opportunity appears in Salesforce months later. Nothing joins them unless somebody builds and maintains the join. Without that connection, the default report is last-touch, which understates every upper-funnel channel and produces allocation decisions that defund demand creation in favor of demand capture until the demand capture pipeline runs dry.
Board-Ready Reporting: How to Present Your Allocation to a CFO
Board and CFO reviews are where a revenue-first allocation either holds or collapses.
The metrics that survive that scrutiny are the unit economics a CFO uses to evaluate any capital allocation decision. Impressions and clicks rarely make the cut.
Metrics to Lead With:
- Pipeline created by channel, which ties spend directly to revenue opportunity
- CAC and CAC payback period, which show how quickly marketing dollars return as margin
- LTV:CAC ratio, where a 3:1 ratio is generally considered healthy for SaaS
- Pipeline coverage ratio against revenue target, which shows whether the plan can support the goal
How to Connect Marketing Spend to Revenue Outcomes:
- Report pipeline, not leads, so quality and value stay visible
- Show cost per sales-qualified lead, not cost per lead, to avoid rewarding low-intent volume
- Connect ad spend to CRM outcomes through lifecycle stage events, so every channel can be evaluated on revenue impact
SaaSHero's reporting runs on Looker Studio and HubSpot dashboards built to show pipeline, CAC, and payback period rather than impressions and clicks. With CRM data connected properly, board reporting becomes a view of the same dashboard the team works from instead of a separate exercise assembled the week before.
Get a Board-Ready Marketing Dashboard
Frequently Asked Questions
What Is the Average Marketing Budget as a Percentage of Revenue?
As noted in the benchmark context above, the 7.8% Gartner figure and the 9.0% CMO Survey figure reflect different sample compositions. For planning, use the 7–10% range already established and adjust for your model, with B2B product companies near 7% and B2B services closer to 10.1%. Faster-growing companies should expect to sit at the high end of that range or above it.
How Do I Decide Between Percentage-of-Revenue and Zero-Based Budgeting?
Percentage-of-revenue budgeting is faster and provides a defensible starting point, but it preserves whatever inefficiencies the previous budget contained. Zero-based budgeting forces every dollar to justify itself but requires significant process overhead.
For enterprise B2B, a practical approach uses percentage-of-revenue as a baseline, with zero-based review every 24–36 months or when channel economics shift materially. Examples include a primary channel's CAC payback extending past 18 months or a new channel demonstrating materially lower CAC than the existing mix. Running zero-based budgeting annually usually creates process overhead that exceeds the benefit.
What Percentage of Marketing Budget Should Go to Paid Media?
Gartner's 2026 CMO Spend Survey found paid media reached a five-year high of 31.4% of marketing budgets. Digital channels overall accounted for 67.5% of marketing expenses. These figures vary by company size, growth stage, and business model.
The Revenue-First Allocation Model produces a more defensible answer than benchmark averages. Allocate based on where your marginal ROI is highest, using channel-level CAC and payback period as the decision criteria. A channel that produces pipeline at a known cost makes the case for more budget on its own evidence.
How Do I Measure Brand Spend When Attribution Cannot Prove It?
Use proxy metrics that correlate with brand health rather than forcing brand investment through the same attribution model as demand capture. The proxy metrics listed earlier, including branded search volume, direct traffic quality, share of voice, and pipeline velocity, provide the most reliable directional evidence that brand investment is working.
The CFO defense frames brand spend as future pipeline optimization and customer acquisition cost reduction. Lower CAC, shorter sales cycles, and pricing power create the economic logic, even when last-click attribution cannot show the full path.
Conclusion: Making Your Allocation Process Defensible and Repeatable
The Revenue-First Allocation Model gives enterprise B2B marketing leaders a step-by-step process that starts with the revenue target and ends with a channel-level plan.
Working backward from that target to required pipeline, to required marketing-sourced pipeline, to required marketing investment, and then to channel split produces a budget that traces every number back to a business outcome. The model complements brand benchmarks like the 46/54 split and supports mid-year reallocation, while board-ready reporting keeps the plan defensible.
To use this guide in an internal planning session, run the worked example with your own numbers, identify where your current allocation diverges from the model, and build your CFO defense script around pipeline, CAC, and payback period. Those are the same metrics your finance team already uses to evaluate capital allocation decisions.
Build Your Revenue-First Allocation With SaaSHero