




Written by: Aaron Rovner, Founder, Saas Hero
Key Takeaways
- A board-ready marketing report is a concise, CRM-connected document that explains spend, pipeline produced, metric definitions, and the specific decision the board must make.
- Boards evaluate marketing in finance and operations language, so reports must connect channel performance directly to revenue outcomes rather than impressions or clicks.
- Every KPI requires a one-sentence definition and named calculation method so numbers are traceable and defensible during CFO questioning.
- Reports must include at least one miss with root-cause diagnosis and corrective action to maintain credibility instead of presenting only green metrics.
- SaaSHero builds CRM-connected reporting and attribution systems that keep board-ready marketing reports accurate and defensible for B2B SaaS companies.
Talk With SaaSHero About Board Reporting
What Makes A Marketing Report Board-Ready For The Board
A board-ready marketing report states what marketing spent, what pipeline it produced, how each number is defined, and what decision the board must make. A dashboard shows what is happening now. A board-ready report explains what happened, why it happened, and what should change next.
Dashboards are live views for operators. Board-ready reports are point-in-time documents with analysis, context, and recommendations. The board wants to know whether the revenue engine is healthy, efficient, and pointed at the right growth levers. Presenting channel performance without tying it to revenue outcomes creates a gap in the story. A business insight connects channel performance to revenue: LinkedIn generated three times more pipeline per dollar spent than Google. Board conversations about marketing consistently center on three points: how much was spent, what it generated, and what to do next.
The Northwind Board-Ready Marketing Report Example
The fictional company is Northwind Analytics, a B2B SaaS company at $28M ARR, sales-led motion, mid-market and enterprise segments, Q3 FY2026. All figures are illustrative.
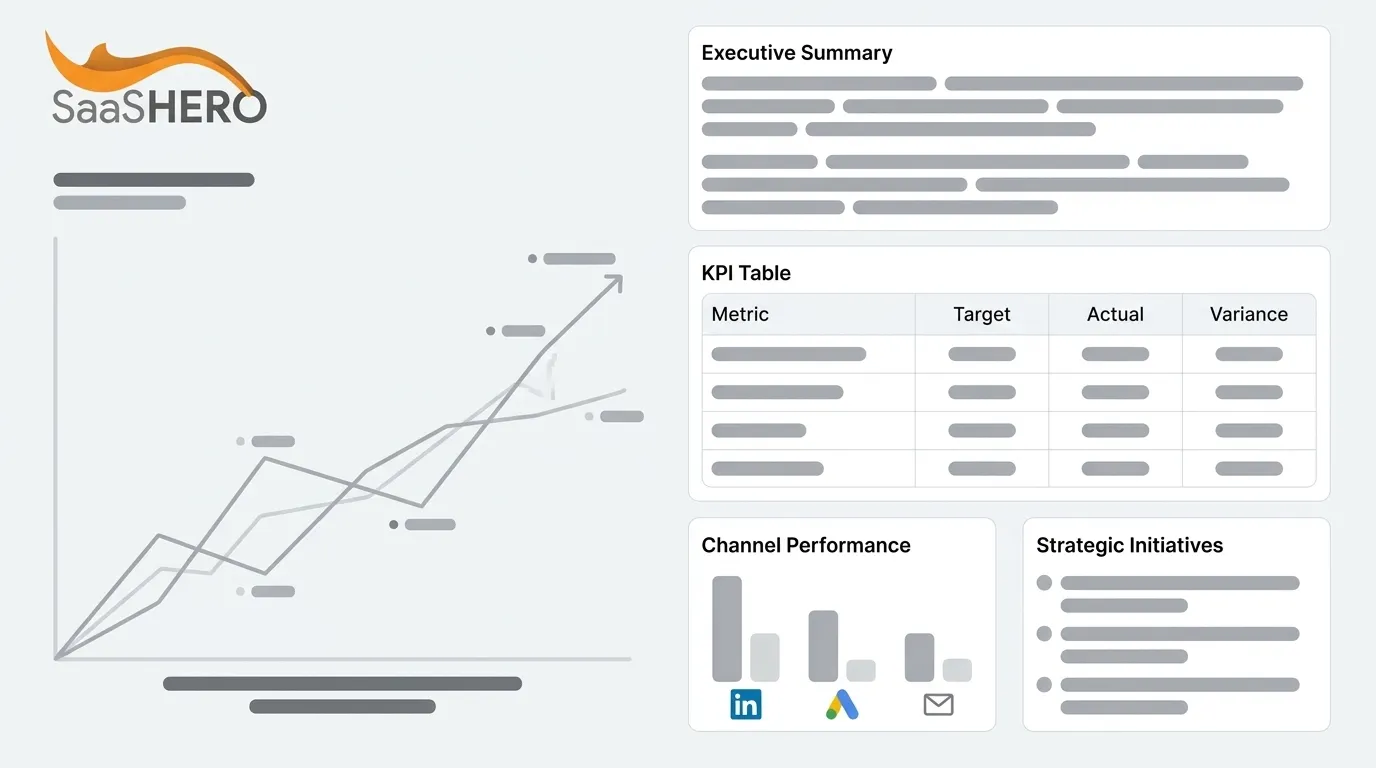
Executive Summary
Northwind’s marketing spend in Q3 FY25 was $510k, per its Q3 financial report. Marketing-sourced pipeline and marketing-influenced pipeline both landed below target, and blended CAC rose quarter over quarter, driven by competitive bid pressure on paid search. The board is asked to weigh in on how marketing should reallocate budget and whether to add demand gen execution capacity.

Why It Is In The Report: The executive summary answers the board’s first question in under five sentences: did marketing contribute to revenue growth. The executive summary of a board marketing report should contain three points: the biggest win with the number that proves it, the biggest miss with the number that proves it, and the single most important focus for next quarter. The summary above follows that logic in prose form.
KPI Table
The KPI table shows whether marketing is acquiring customers efficiently and hitting the plan. For Northwind, it highlights a pipeline shortfall and rising acquisition costs.
| KPI | Target | Actual | Variance |
|---|---|---|---|
| Marketing-sourced pipeline | $4.2M | $3.6M | −14% |
| Marketing-influenced pipeline | $9.0M | $7.8M | −13% |
| Blended CAC | $11,500 | $13,200 | +15% |
| CAC payback period | 16 months | 19 months | +3 months |
| LTV:CAC | 3.0x | 2.4x | −0.6x |
| MQL-to-opportunity conversion | 22% | 18% | −4 pts |
| Pipeline coverage ratio | 3.5x | 2.9x | −0.6x |
Why It Is In The Report: The KPI table answers whether marketing is acquiring customers efficiently. Boards want each metric presented with the current quarter value, prior quarter value, trailing four-quarter trend, and target, with every number color-coded against target. The example uses seven KPIs, which sits at the upper end of the recommended range. Seven metrics keep the focus on pattern recognition without forcing the board to do the analysis in the room. A board deck for funded B2B SaaS companies should contain a small set of headline metrics, not dozens.
Marketing-Sourced Vs. Marketing-Influenced Pipeline
Marketing-sourced pipeline uses first-touch attribution from the CRM lead source field. Marketing-influenced pipeline uses any marketing touch before opportunity creation, within a documented 90-day window. The report keeps these figures separate.

Why It Is In The Report: This section answers how the team knows marketing caused the pipeline. Marketing-sourced pipeline is the value of opportunities where marketing created the first qualified touch; marketing-influenced pipeline is opportunities where marketing touched the account at any stage even if it did not create the opportunity.
Channel Performance
Channel performance shows where the next dollar should go. In the Northwind example, paid search produces pipeline at a lower cost per opportunity than paid social.
| Channel | Spend | Pipeline Created | Cost per Opportunity |
|---|---|---|---|
| Paid search | $180k | $2.1M | $8,600 |
| Paid social | $140k | $1.0M | $14,200 |
| Events | $90k | $1.4M | $9,800 |
Why It Is In The Report: Channel performance answers where the board should invest. The channel mix slide should show, per channel, spend, contribution to pipeline, contribution to closed-won, CAC, and payback period, ordered by contribution to closed-won descending.
Strategic Initiatives
- The ABM pilot targeted 130 named enterprise accounts, engaging 35 accounts (26% of the target list) in multiple meetings over six months.
- Rebuilt paid search conversion tracking to feed lifecycle-stage events back to Google Ads.
- Testing a LinkedIn thought-leadership sequence against a cold ICP audience.
Risks And Dependencies In The Quarter
- Paid social cost per opportunity is running above target; corrective action is in progress.
- CRM lead source field has a meaningful blank rate; an attribution audit is scheduled for Q4.
- Enterprise sales cycle is lengthening. Pipeline coverage’s 3x benchmark assumes a 33% win rate, and enterprise segments with historical win rates near 14% require roughly 7x coverage.
Decisions Needed From The Board
- Approve a budget shift from paid social to paid search.
- Approve contractor headcount for demand gen execution.
- Confirm the Q4 pipeline target given enterprise cycle lengthening. A $500K Q4 quota requires a $3.35M pipeline at a 15% win rate, given that the median B2B SaaS sales cycle has stretched to about 84 days, with enterprise deals running 90–180 days.
Why It Is In The Report: Every board-ready marketing report must end with explicit asks. Every board presentation should end with at least one explicit ask or decision point; closing with “we will continue executing the plan” leaves the decision unspoken.
The 7 KPIs In The Example, Defined And Sourced
Every KPI in a board-ready marketing report needs a one-sentence definition and a named calculation method so the number is checkable rather than asserted. If the definition moves, the KPI loses meaning, which is why governance matters as much as math.
- Marketing-sourced pipeline: Sum of closed-won and open opportunities where the first-touch or lead-source field is a marketing campaign, per the CRM’s attribution model. The canonical formula is: MSP ($) = sum of qualified opportunity value where Original_Source = Marketing AND Opportunity Created Date falls within the reporting period.
- Marketing-influenced pipeline: Opportunities where marketing touched the account at any point before creation or during the cycle, within a documented 90-day window. A 90-day attribution window is the recommended standard for influenced pipeline metrics, documented and applied consistently, and never changed mid-quarter.
- Blended CAC: Total sales and marketing spend divided by new customers in the period. This includes media spend, agency fees, creative production, and allocated marketing headcount. CAC should be fully loaded; ad-spend-only CAC often understates the real number by 20 to 40%.
- CAC payback period: Blended CAC divided by gross margin per customer per month. CAC payback period is defined as CAC divided by monthly gross profit per customer, expressed as CAC ÷ (Monthly ARPU × Gross Margin %).
- LTV:CAC: Customer lifetime value divided by blended CAC. A 3:1 ratio is an industry convention for sustainable B2B SaaS growth. Strong SaaS businesses typically achieve an LTV:CAC ratio of 3:1 or higher and that benchmark is not a SaaSHero result.
- MQL-to-opportunity conversion rate: Opportunities created divided by MQLs in the period. The median B2B MQL-to-SQL conversion rate is 13%, with top-quartile organizations converting at 25% or higher.
- Pipeline coverage ratio: Open pipeline divided by the period’s revenue target. A healthy pipeline coverage range is 3.0x–4.0x for new business in mid-market B2B SaaS.
Review Your KPIs With SaaSHero
How The Northwind Example Uses Sourced And Influenced Pipeline
The sourced and influenced definitions matter because they change the story the numbers tell. In the Northwind Cloud example, partner-sourced pipeline was $3.61M across 61 open deals, and partner-influenced pipeline was $1.14M across 22 closed-won deals. The gap between marketing-sourced and marketing-influenced pipeline represents sales-originated deals where marketing built awareness, educated prospects, or warmed the account before the first sales touchpoint, excluding deals that marketing itself sourced.
A VP of Marketing at a Series B SaaS company might report $2M in sourced pipeline and $8M in influenced pipeline, where the gap represents deals sales created where marketing built awareness, educated prospects, and warmed them up before the first sales touchpoint. In practice, sourced pipeline serves as the accountability number. Influenced pipeline serves as the diagnostic number that shows broader contribution. Boards should see sourced pipeline as the primary accountability figure and influenced pipeline as a supporting diagnostic, and no single slide should show only the influenced figure.
How To Explain Variance When A Metric Misses Target
A report that shows only green metrics fails in the room. A report that shows a miss with a diagnosis and a corrective action earns more credibility.
The structure is simple: what happened, why it happened, and what the team is doing. Handling bad news in a board marketing report requires stating the miss specifically, providing a root cause diagnosis, and describing a specific remediation action with a timeline. Worked example for paid social cost per opportunity in the Northwind report:
- What happened: Paid social cost per opportunity came in above target, a meaningful overage against plan.
- Why: Two of three creative concepts underperformed on cold audiences; the conversion campaign was running against a broader audience than the consideration stage had warmed.
- What we are doing: Pausing the two underperforming concepts, rebuilding the conversion campaign to run against consideration-stage retargeting pools only, and reallocating budget to paid search for Q4. The team expects cost per opportunity to improve over the coming weeks.
What The Board Will Ask Next And How To Answer
Each KPI in the example maps to a likely CFO or CRO follow-up. Anticipating those questions and preparing concise answers separates a board-ready report from a template.
- Blended CAC — “What is it excluding?” Blended CAC includes media spend, agency fees, creative production, and allocated marketing headcount. Definitions diverge on sales salaries: Vareto’s definition excludes them, while most fully loaded definitions include sales salaries and commissions. Before approving any budget, a CFO asks three questions: what it costs in full, what comes back, and when it pays back.
- Sourced vs. influenced pipeline — “How do you know marketing caused it?” Sourced pipeline uses first-touch attribution with a locked lead-source field. Influenced pipeline uses a 90-day multi-touch window. The report presents both separately and keeps the definitions stable.
- Pipeline coverage — “What is the conversion rate assumption?” Using a 22% qualified-stage win rate measured over the trailing four quarters, required pipeline coverage is 1 / 0.22 = 4.5x. A lower win rate of 18% implies coverage of about 5.6x.
- CAC payback — “What happens if we cut marketing 20%?” When marketing spend is cut, pipeline additions slow by the following quarter, and net pipeline turns negative the quarter after that. Closing inventory then starves, and revenue misses plan six to ten months later. If pipeline coverage drops below 3x within 90 days of the cut, the savings create a revenue problem that cash savings cannot solve. Marketing leaders should prepare one-line answers and one supporting number for likely board questions, including “What happens if we cut marketing 20%?”
Adapting The Example For Slides, Memos, And Cadence
The Northwind template adapts to format and cadence without changing the underlying numbers.
For PowerPoint, use 4–6 slides, one chart per insight, and a headline that states the point. The CMO board slot should total 30–35 minutes: 15–20 minutes for the walkthrough and 10–15 minutes for questions and discussion, with the deck capped at 8 slides and sent to the board 24–48 hours in advance. For Word or a written memo, send a one-page executive summary plus supporting sections 48–72 hours in advance so board members read before the meeting.
For monthly vs. quarterly cadence, the monthly marketing report serves as an internal management tool with the full KPI dashboard, campaign-level performance data, funnel conversion rate trends, and weekly action items. The quarterly board review serves as a governance document of no more than eight to ten slides.
The Measurement Architecture Behind Credible Numbers
The example report relies on a measurement layer underneath it: CRM-connected reporting, sourced and influenced attribution, and primary and secondary conversions. This structure keeps numbers traceable instead of assembled by hand the week before the board meeting.
This measurement layer quickly becomes an operational requirement. In B2B SaaS the gap between ad platform data and CRM data is where attribution breaks down most often; an ad platform might show 50 conversions in a month while the CRM shows only 30 leads from the same source, and that discrepancy must be explained before a board meeting. A 2025 Perion / Advertiser Perceptions study found that 97% of marketers using a single integrated system were aligned with their CFO on budgets and metrics, compared with 66% of those working from fragmented data.
SaaSHero is the outsourced inbound growth team for B2B companies, owning strategy and execution across paid media, creative, landing pages, and CRM-connected attribution and reporting, and focusing on CRM outcomes such as qualified pipeline, lifecycle stage, and closed revenue. Founded in 2018, SaaSHero has served more than 100 B2B companies and manages roughly $16 million in annual advertising spend, with more than $60 million over its lifetime. The team includes about 20 full-time specialists, including in-house designers and copywriters. SaaSHero is a Google Premier Partner (top 3% of partners) and has been a G2 High Performer in digital marketing for over two consecutive years, currently ranked #20 of approximately 6,000 agencies.

SaaSHero builds reporting in the client’s own CRM, such as HubSpot or Salesforce, with Looker Studio dashboards, so the board-ready marketing report becomes a view of the same dashboard the team works from daily. The numbers in the board deck come from a point-in-time export of a live, CRM-connected system. That measurement architecture underpins the Northwind example and separates a defensible board report from a spreadsheet reconciled by hand.
See How SaaSHero Connects CRM To Board Reports
FAQ
Example Of A Board-Ready Marketing Report
The Northwind Analytics example above is a board-ready marketing report template with an executive summary, KPI table, sourced and influenced pipeline, channel performance, variance explanation, risks, and decisions needed. It covers a fictional B2B SaaS company, with all figures illustrative. Every metric is defined with a named calculation method so the number is checkable rather than asserted. The structure follows the sections boards consistently ask about: what was spent, what pipeline it produced, how efficient the spend was, what went wrong and why, and what decisions the board must make.
How To Create A Board-Ready Marketing Report
Start with the decision the board is being asked to make, then work backward to the numbers that support or complicate it. Because the CRM is the system of record for pipeline and revenue, pull figures from there instead of the ad platforms, since the two will not match. That mismatch is also why every metric needs a named calculation method defined before the meeting, not during it. Credibility depends on showing at least one miss with a diagnosis and corrective action, since a report that only shows green metrics invites suspicion. End with explicit asks such as budget approvals, headcount decisions, or target confirmations. The measurement architecture underneath the report, including CRM-connected attribution, locked lead source fields, and a primary and secondary conversion hierarchy, determines whether the numbers survive CFO questioning.
Choosing Between PowerPoint And Word For The Board
For a board-ready marketing PowerPoint, cap the main presentation at 4–6 slides (one slide per section: recommendation, context, evidence, ask), with each evidence slide carrying one chart whose headline states the point. Word or a written memo for the pre-read should be sent 48–72 hours in advance so board members arrive having already processed the numbers and are ready to discuss. Most boards in 2026 read the deck before the meeting and use the meeting for discussion. A pre-read memo with an executive summary, the KPI table, and the decisions needed section often proves more useful than the full slide deck as a standalone document.
Monthly Vs. Quarterly Board-Ready Marketing Reports
Monthly reports serve as internal management tools with the full KPI dashboard, campaign-level performance, funnel conversion rate trends, and weekly action items for the marketing team and immediate leadership. Quarterly board reports serve as governance documents that typically include six to ten headline metrics (each with current value, prior period, plan, and variance), a forward-looking view, and explicit numbered asks and decisions. The two serve different audiences and different decisions. For most B2B SaaS companies at the $10M–$100M ARR range, the right board reporting cadence is a one-page monthly flash (cash or runway and ARR vs. forecast, sent by the fifth business day with no meeting) combined with a full quarterly board deck sent 72 hours in advance.
Difference Between Marketing-Sourced And Marketing-Influenced Pipeline
Marketing-sourced pipeline credits marketing for deals it originated; the first-touch or lead-source field in the CRM points to a marketing channel, and without that first marketing touch the contact would not be in the pipeline. Marketing-influenced pipeline credits marketing for deals it touched at any point during the buying journey, including deals sales originated where marketing later ran retargeting, sent nurture emails, or hosted a webinar the prospect attended. Sourced serves as the accountability number because it is binary, defensible, and directly tied to marketing’s demand generation activity. Influenced serves as the diagnostic number because it shows marketing’s broader contribution to the revenue engine, including deals it did not start. Report both separately and keep influenced pipeline as a supporting view rather than the primary accountability metric.
How Many KPIs A Board-Ready Marketing Report Should Include
Five to seven KPIs is the recommended range. More than that and the board does the pattern-matching the marketing leader should have done before the meeting. Common metrics that tend to hold up under CFO scrutiny include marketing-sourced pipeline, pipeline coverage ratio, blended CAC, CAC payback period, LTV:CAC, MQL-to-opportunity conversion rate, and marketing-influenced pipeline. Each must have a one-sentence definition and a named calculation method. Impressions, follower counts, email open rates, raw MQL volume, and individual campaign performance belong in an appendix or an internal management report, not in the board deck.
Next Steps For Your Board-Ready Marketing Report
A board-ready marketing report starts as a measurement challenge, not a design exercise. The template is the easy part. The metric definitions, attribution logic, and variance explanations determine whether the report holds up in the room. If the CRM and ad platforms do not agree, the report will not hold and slide design will not fix a sourced pipeline number the CFO can dispute in the first five minutes.
The Northwind Analytics example above is only as credible as the measurement layer underneath it: locked lead source fields, a documented 90-day influence window, primary and secondary conversion architecture, and CRM-connected dashboards the team works from daily. That measurement layer is what SaaSHero builds and maintains for B2B companies that need their board-ready marketing report to hold up under CFO and CRO follow-up questioning.
Schedule A Working Session With SaaSHero