




Written by: Aaron Rovner, Founder, Saas Hero
Key Takeaways
- CAC payback period and LTV:CAC measure different realities: cash timing versus lifetime value. They often disagree in B2B SaaS because of long sales cycles and attribution gaps.
- LTV:CAC is highly sensitive to churn assumptions. A 1 percentage point increase in monthly churn can destroy 20% to 40% of calculated LTV while payback period stays the same.
- When the metrics conflict, the binding constraint decides. Payback period governs when cash is tight. LTV:CAC governs when durability and long-term value matter most.
- Payback period is the more trustworthy operational metric because its inputs are observable today. LTV:CAC depends on churn and gross margin forecasts that often lag reality.
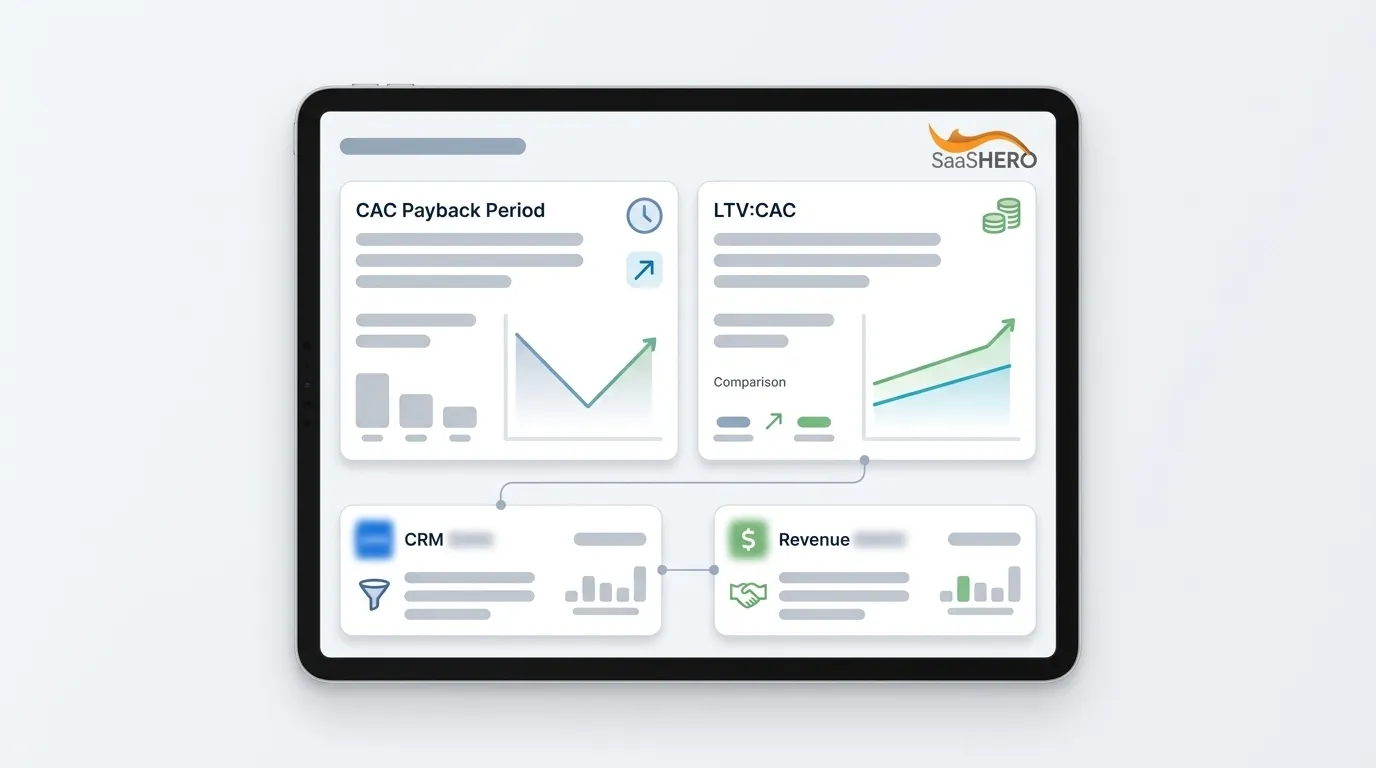
- SaaSHero ties paid acquisition to CRM revenue data rather than form fills, so both CAC payback period and LTV:CAC come from qualified pipeline outcomes that CFOs and boards can trust.
Talk With SaaSHero About Your Payback Reporting
Why CAC Payback Period and LTV:CAC Disagree in B2B SaaS
CAC payback period and LTV:CAC answer different questions. CAC payback period measures how fast acquisition spend returns cash. LTV:CAC measures whether the lifetime value of a customer justifies the cost of acquiring that customer. They share inputs such as CAC and gross margin, but they process those inputs in different ways.
In B2B SaaS, this gap widens because of long sales cycles, multi-touch buying journeys, buying committees, and fragmented attribution. A common pattern appears: a healthy 4:1 LTV:CAC sitting on a 24-month payback, or a sub-12-month payback attached to thin lifetime value because churn is high or gross margin is low.
Both metrics hinge on gross margin, and this dependency drives many errors. Gross margin appears in the denominator of the CAC payback period formula and in the numerator of the LTV formula used to compute the LTV:CAC ratio. A company with significant services revenue or high infrastructure costs that uses blended gross margin instead of subscription-only gross margin will overstate efficiency on both metrics at the same time. This mistake affects many founder-built payback models.
LTV:CAC also reacts far more to churn assumptions than CAC payback period. Because churn sits in the denominator of the LTV formula, a 1 percentage point increase in monthly churn typically destroys 20% to 40% of calculated LTV, while the same churn change leaves the payback period unchanged. This asymmetry sits at the center of most disagreements between the two metrics.
Common thresholds help frame the numbers. Sub-12-month CAC payback is generally considered strong for B2B SaaS, and a 3:1 LTV:CAC ratio is generally considered healthy for SaaS. These are heuristics rather than universal rules.
Head-to-Head Comparison: CAC Payback Period vs LTV:CAC
The table below places the two metrics side by side across definition, formula, unit of measure, sensitivity, and best use. The differences in sensitivity and use case explain most real-world disagreements.
| Attribute | CAC Payback Period | LTV:CAC Ratio |
|---|---|---|
| Definition | Months to recover acquisition cost from gross margin | Lifetime gross profit divided by acquisition cost |
| Formula | CAC ÷ (Monthly ARPA × Gross Margin %) | LTV ÷ CAC, where LTV = (ARPA × Gross Margin %) ÷ Monthly Churn |
| Unit of Measure | Months | Ratio (e.g., 3:1) |
| Primary Sensitivity | CAC, ARPA, gross margin | Churn, gross margin, expansion revenue |
| Best Used For | Cash timing, operational decisions, runway planning | Long-term value, investor conversations, strategic planning |
CAC payback period focuses on how fast acquisition spend returns cash and uses inputs you can observe in the current period. LTV:CAC focuses on whether the lifetime value of a customer justifies the acquisition cost and depends on churn and gross margin assumptions that often lag reality.
In SaaS, CAC payback period functions as a cash-timing construct rather than an IRR or discounted-cash-flow calculation. It measures months to gross-margin breakeven on a customer. It does not measure the internal rate of return on the acquisition investment.
For the full calculation methodology, see CAC Payback Period Calculation Methodology: A SaaS Guide. For benchmark context by company stage and segment, see CAC Payback Period Benchmarks for SaaS: Is It Normal?
See How SaaSHero Benchmarks Your Payback
The Conflict Scenario: When CAC Payback Period and LTV:CAC Disagree
Most guidance says to use both metrics, yet few explanations show how to resolve conflicts between them. The scenarios below use simple arithmetic to show where the numbers diverge and how to interpret the gap.
Scenario A: The Churn Assumption Problem
Inputs: CAC = $2,000, Monthly ARPA = $200, Gross Margin = 80%, Monthly Churn = 1.5%
- Monthly gross profit per customer: $200 × 80% = $160
- CAC payback period: $2,000 ÷ $160 = 12.5 months
- LTV: $160 ÷ 1.5% = $10,667
- LTV:CAC: $10,667 ÷ $2,000 = 5.3:1
Now adjust monthly churn to 4%, a common assumption for SMB SaaS:
- LTV: $160 ÷ 4% = $4,000
- LTV:CAC: $4,000 ÷ $2,000 = 2:1
- CAC payback period: still 12.5 months
The payback period stays fixed. The LTV:CAC ratio falls from 5.3:1 to 2:1 because of a single churn assumption change. This illustrates how churn sensitivity makes LTV:CAC far more volatile than CAC payback period when churn is uncertain.
Scenario B: Fast Payback, Thin LTV:CAC
Inputs: CAC = $600, Monthly ARPA = $100, Gross Margin = 80%, Monthly Churn = 5%
- Monthly gross profit per customer: $100 × 80% = $80
- CAC payback period: $600 ÷ $80 = 7.5 months
- LTV: $80 ÷ 5% = $1,600
- LTV:CAC: $1,600 ÷ $600 = 2.67:1
Payback is fast at 7.5 months, while LTV:CAC sits below the 3:1 threshold. LTV:CAC governs long-term value in this case. A company with a strong cash position should investigate whether acquisition is bringing in the wrong customers, because the churn rate drives the weakness rather than the payback period.
The Decision Rule
Payback wins when cash is the constraint, and LTV:CAC wins when durability is the constraint. Runway, funding stage, churn trajectory, and gross margin stability determine which constraint binds at any moment. A company with 9 months of runway and a 14-month payback has a cash problem regardless of the LTV:CAC ratio. A company with strong cash reserves and a 2.5:1 LTV:CAC has a retention problem that more acquisition spend will not solve.
Apply This Decision Rule to Your Funnel
Which Metric to Lead With by Funding Stage
Funding stage shapes which metric leads and which one supports the story. The table below summarizes the typical pattern.
| Funding Stage | Primary Metric | Secondary Metric | Question Each Answers |
|---|---|---|---|
| Bootstrapped | CAC Payback Period | LTV:CAC | Can we keep spending? Is the motion durable? |
| VC-Backed | LTV:CAC | CAC Payback Period | Is lifetime value justified? How much can we spend before the next raise? |
| PE-Backed | CAC Payback Period | LTV:CAC | Are we cash-efficient within the hold period? What is the exit narrative? |
Bootstrapped
Cash timing determines whether the company can keep spending. CAC payback period serves as the operational metric because it answers a direct question: when does this customer start returning cash? LTV:CAC acts as a secondary check on whether the acquisition motion remains durable enough to justify continued investment.
VC-Backed
VC investors underwrite long-term value and market share, so LTV:CAC often becomes the headline metric. Series A investors typically want a 3:1 minimum LTV:CAC, often 3.5:1 or above in competitive rounds, with payback under 12 months preferred. Payback period still governs how much can be spent before the next raise, because runway turns it into a hard constraint even when LTV:CAC leads the narrative.
PE-Backed
Operating partners manage a finite hold period and compare portfolio companies on standardized cash-efficiency metrics. CAC payback period and pipeline coverage dominate because they answer the questions a hold-period P&L raises. LTV:CAC still matters for diligence and exit narrative but remains secondary to cash timing during the hold.
The Assumptions Problem: Why Payback Is the More Trustworthy Operational Metric
LTV:CAC only works as well as its inputs allow. Churn and gross margin assumptions distort it far more than they distort CAC payback period, and those assumptions often lag behind current performance.
As Scenario A showed, a churn assumption change can collapse LTV:CAC while leaving payback untouched. Because churn sits in the denominator of the LTV formula, cutting churn from 2.5% to 1.5% monthly raises LTV by 67% with no change to CAC. The reverse also holds: a modest churn assumption that proves optimistic can make a business look fundable when it is not.
CAC payback period anchors to observable cash timing. The inputs are measurable in the current period: CAC, ARPA, and gross margin. LTV requires a forecast of customer lifetime that depends on retention assumptions, and those assumptions may not hold.
Payback period therefore serves as the more trustworthy operational metric for week-to-week and quarter-to-quarter decisions. LTV:CAC fits better in strategic and investor conversations where the long-run thesis is under review.
Both metrics weaken when the conversion event feeding them is a form fill rather than a qualified pipeline outcome. A CAC denominator built on form fills instead of sales-qualified leads measures acquisition cost against the wrong denominator and inflates both metrics.
Payback period is the more trustworthy metric, but it still has limits. Operators who treat it as a complete picture will make different mistakes, which the next section covers directly.
What Are the Downsides of Using a Payback Period?
CAC payback period has real limitations that operators should understand before using it as a primary metric.
- It ignores what happens after breakeven. Payback period tells you when cash returns and not how much total value a customer generates. A customer who pays back CAC in month 8 and churns in month 9 looks identical to one who pays back in month 8 and stays for five years.
- It can favor short-term cash recovery over long-term customer value. Focusing on payback alone can push acquisition toward cheaper, lower-value customers who pay back quickly but generate thin lifetime value.
- It can be gamed by reducing spend rather than improving efficiency. Cutting sales and marketing spend reduces CAC and shortens payback, but it also reduces pipeline. The metric improves while the business weakens.
- It does not account for expansion revenue or net revenue retention. A company with strong NRR above 100% recovers CAC faster in practice than the formula suggests, because expansion revenue accelerates cost recovery beyond the initial MRR figure.
Payback period alone will mislead in three situations: high-expansion SaaS businesses where NRR significantly exceeds 100%, companies where the first-year cohort does not represent lifetime value, and businesses where strong net revenue retention makes eventual economics far better than the initial payback calculation implies.
These limitations are real, but they are correctable through better modeling and cohort analysis. LTV:CAC carries structural weaknesses that stem from churn sensitivity, gross margin distortion, and forecast dependency. That asymmetry is why payback period remains the better operational metric for most decisions.
Stress-Test Your Payback and LTV:CAC With SaaSHero
Board and Investor Framing: Which Number to Present
A fundraise puts LTV:CAC and net revenue retention in front, because investors are underwriting long-term value. For a Series A, a SaaS company’s CAC payback period should be under 12 months and its LTV:CAC ratio solidly above 3:1, with NRR above 110% as a baseline expectation. Payback period still governs how much can be spent before the next raise, so presenting both with a clear statement of which one governs the current decision works best.
The operating review flips the order. CAC payback period and pipeline coverage lead because the board is asking about cash efficiency and whether the number will be hit. The CFO and board care about pipeline and payback, so cost-per-lead metrics do not answer their core questions.
To present both without triggering a methodology debate, follow a simple structure. State which metric governs the current decision. Name the assumption that would change the answer. Present both numbers in the same view. A board that sees LTV:CAC without payback will ask about payback. A board that sees payback without LTV:CAC will ask about long-term value.
Board-ready reporting requires CRM-connected data. The CFO and board are asking about pipeline and payback, so platform-reported form fills and click metrics do not satisfy their needs. For guidance on structuring investor-facing payback reporting, see CAC Payback Period: How to Report It to Investors.
How SaaSHero Connects Payback and LTV:CAC to CRM Revenue
SaaSHero serves as the outsourced inbound growth team for B2B companies and optimizes against CRM revenue data rather than form-fill counts. That operational discipline makes both metrics trustworthy, because CAC payback period and LTV:CAC only hold up when the conversion event feeding them is a qualified pipeline outcome.

SaaSHero separates primary from secondary conversions, pushes lifecycle stage events back into the ad platforms, and reports on pipeline, CAC, and payback period instead of impressions and clicks. When the bidding algorithm trains on sales-qualified leads and CRM lifecycle stage changes rather than form completions, the CAC denominator reflects actual acquisition cost against actual buyers.

The firm’s flat retainer is based on total monthly ad spend rather than channel count, so channel-mix recommendations stay aligned with performance instead of fee incentives. SaaSHero owns paid media, creative, landing pages and CRO, attribution and reporting, and strategy as one team. The benchmarks the firm holds clients to, such as LTV:CAC of 3:1 and CAC payback under 12 months, match industry thresholds and appear in CRM-connected dashboards that a CFO or board can open directly.

See SaaSHero’s CRM-Connected Payback Dashboards
Frequently Asked Questions
What Is a Good CAC Payback Ratio?
Sub-12-month CAC payback is generally considered strong for B2B SaaS, with under 6 months representing exceptional capital efficiency. Payback periods above 18 months require either strong net revenue retention or a clear justification for how the business will fund the extended cash recovery window. The right threshold also depends on ACV. Enterprise deals with ACVs above $50,000 and multi-year contracts can tolerate longer payback periods than SMB or mid-market deals, because the eventual retention and expansion economics differ. A 24-month payback on a sticky enterprise account with 120% NRR is very different from a 24-month payback on an SMB account with 85% gross revenue retention.
Is LTV:CAC or Payback More Important for Fundraising?
Both matter, but LTV:CAC usually leads in fundraise conversations because investors underwrite long-term value. Payback period still governs how much can be spent before the next raise, so presenting both with a clear statement of which one governs the current decision works best. A company that leads with LTV:CAC but cannot explain its payback period will face avoidable follow-up questions. A company that leads with payback but cannot articulate lifetime value will struggle to justify acquisition spend at scale.
What Is the Difference Between ROI and Payback Period?
ROI measures total return relative to cost over the full investment period. Payback period measures how long it takes to recover the initial investment. A project can have strong ROI but a long payback period, which creates cash flow risk even when the eventual return looks attractive. In SaaS, this distinction matters because a customer with a 5:1 LTV:CAC ratio and a 30-month payback period has excellent eventual ROI but requires 30 months of working capital before the acquisition cost is recovered. The ratio alone does not reveal that cash timing problem.
How Does Gross Margin Affect CAC Payback Period and LTV:CAC?
Gross margin appears in the denominator of the CAC payback period formula and in the numerator of the LTV formula used to compute the LTV:CAC ratio. A lower gross margin lengthens payback period and reduces LTV, which compresses the LTV:CAC ratio. Companies with significant services revenue or high infrastructure costs should use subscription-only gross margin rather than blended margin to avoid overstating efficiency. Using blended gross margin when subscription-only gross margin is materially lower is one of the most common calculation errors in founder-built models. It makes payback look shorter and LTV:CAC look stronger than the underlying economics justify, and the correction can shift reported payback by several months and move LTV:CAC across the 3:1 threshold.
Can a Company Have a Healthy LTV:CAC and a Bad CAC Payback Period?
Yes. A company with low churn and high lifetime value can show a 4:1 or 5:1 LTV:CAC ratio while carrying a 24-month payback period. The ratio describes eventual profitability, and the payback period describes when that profitability arrives. If payback exceeds runway, the unit economics only work on paper. This pattern appears often: a business that looks fundable on LTV:CAC but remains cash-flow negative on every new customer for two years. The resolution depends on the binding constraint. If cash is the constraint, payback governs. If durability is the constraint, LTV:CAC governs.
Which Metric Should a PE-Backed SaaS Company Lead With?
PE operating partners typically ask about CAC payback and pipeline coverage, and PE-backed companies are compared against other portfolio companies on standardized cash-efficiency metrics. LTV:CAC matters for diligence and exit narrative but remains secondary to cash timing during the hold. Operating partners need metrics that are comparable across portfolio companies and that answer whether acquisition spend is producing qualified pipeline within the hold period. Payback period answers that question directly, while LTV:CAC requires churn and gross margin assumptions that vary across companies and are harder to standardize.
Conclusion: The Decision Rule and Next Steps
CAC payback period governs cash survival and operational decisions. LTV:CAC governs long-term value and investor conversations. When they disagree, the binding constraint, cash or durability, determines which one should lead. A company with limited runway runs on payback. A company with strong cash reserves and a retention problem runs on LTV:CAC.
Next steps are straightforward. Audit the churn and gross margin assumptions behind LTV:CAC. Confirm that the conversion event feeding both metrics is a qualified pipeline outcome rather than a form fill. Verify that reporting is CRM-connected rather than built from platform-reported conversion counts.
SaaSHero owns paid acquisition end to end, including paid media, creative, landing pages and CRO, attribution and reporting, and strategy, and aligns all of it to CRM revenue data. That discipline turns CAC payback period and LTV:CAC into decision tools rather than decorative metrics.
Review Your Metrics With a SaaSHero Strategist