




Written by: Aaron Rovner, Founder, Saas Hero
Key Takeaways For Multi-Product SaaS Portfolios
- Single-product ROI models fail in multi-product SaaS portfolios because blended CAC and payback metrics hide which investments create or destroy value.
- A three-level framework separates portfolio allocation decisions, product-level unit economics comparisons, and channel execution using gross-margin-adjusted ROI.
- Revenue-based ROI overstates returns when gross margins differ across products. Incremental gross profit is the correct numerator for portfolio comparisons.
- Product-level CAC, CAC payback, and marketing-sourced ARR must be tracked separately for each ACV tier to support defensible capital allocation.
- SaaSHero provides the CRM-connected reporting layer that turns this three-level model into a live dashboard for board and sponsor reviews.
Talk Through Your Portfolio ROI Model With SaaSHero
Defining Portfolio Marketing ROI For SaaS
Portfolio marketing ROI for SaaS measures marketing investment returns across multiple products or business units, each with distinct ACVs, sales cycles, and gross margins. It uses a structured allocation model that separates three decisions: where the next dollar goes, which product’s economics justify more investment, and which channel within a product is producing qualified pipeline.
That definition maps directly to a three-level framework:
- Level 1 — Portfolio (The Allocation Decision): Where does the next marketing dollar go across products? This level answers the capital allocation question. It requires gross-margin-adjusted ROI by product. The decision it informs: which product receives incremental budget in the next planning cycle.
- Level 2 — Product (The Comparison Decision): Which product’s unit economics justify more investment? This level compares CAC payback, LTV:CAC, and marketing-sourced ARR across products with different ACVs and sales cycles. The decision it informs: whether to scale, hold, or cut investment in a given product line.
- Level 3 — Channel (The Execution Decision): Which channel within a product is producing qualified pipeline at an acceptable cost? This level governs campaign-level decisions. The decision it informs: how to reallocate budget across paid search, paid social, and other channels within a single product’s demand engine.
Most existing content treats ROI as a single-product, single-channel calculation. The three-level model makes portfolio-level budget allocation mechanically possible instead of a judgment call from a blended dashboard.
Measuring Marketing ROI Across A SaaS Portfolio
Revenue-based ROI overstates return whenever gross margins differ across products, which is almost always true in a multi-product portfolio. The correct numerator is incremental gross profit.
The formula:
Portfolio Marketing ROI = (Incremental New ARR × Blended Gross Margin − Total Marketing Spend) ÷ Total Marketing Spend
Worked example: A portfolio spends $5M in marketing and generates $20M in new ARR at an 80% gross margin.
- Revenue ROI: ($20M − $5M) ÷ $5M = 300%
- Gross-profit ROI: ($20M × 0.80 − $5M) ÷ $5M = ($16M − $5M) ÷ $5M = 220%
The 80-point gap between 300% and 220% is material. It separates a number that survives a CFO’s scrutiny from one that fails it. When one product runs at 60% gross margin and another at 85%, a blended 80% margin misstates both. The allocation decision at Level 1 relies on gross-margin-adjusted ROI by product.
For a deeper treatment of campaign-level ROI mechanics, see how to measure ROI of enterprise SaaS marketing campaigns and the performance marketing ROI calculator for B2B SaaS.
Comparing Products With Different ACVs And Sales Cycles
A portfolio containing a $75K ACV enterprise product and a $12K ACV self-serve product cannot rely on a single blended CAC. The enterprise product will always look more expensive to acquire, because it carries longer sales cycles, more stakeholders, and more marketing touches per deal. The self-serve product will always look cheaper. Neither observation helps allocation unless the numbers are segmented by product and interpreted against the ACV that drives them.
Widelly’s 2025 SaaS Marketing Benchmark Report, based on data from 312 B2B SaaS companies, segments median CAC by ACV tier: enterprise SaaS (>$50K ACV) at $8,400, mid-market SaaS ($10K–$50K ACV) at $3,200, and SMB SaaS (<$10K ACV) at $450. A portfolio that blends enterprise and SMB products into one CAC figure produces a number that is too high to benchmark against enterprise peers and too low to benchmark against SMB peers.
The practical approach is to run a separate Level 2 comparison for each product using gross-margin-adjusted CAC payback. Those product-level payback periods then inform the Level 1 allocation decision. A product with a 14-month payback at 80% gross margin is a better allocation candidate than a product with a 10-month payback at 55% gross margin, even though the raw payback number looks worse.

Separating Portfolio-Level CAC From Product-Level CAC
Portfolio-level CAC is total sales and marketing spend divided by total new customers across all products in a period. It answers one question: what did the portfolio spend, on average, to acquire a customer? It cannot answer the allocation question, because it does not reveal which product drove that average, which channel within each product is efficient, or whether a mix shift is masking deterioration.
Product-level CAC is total sales and marketing spend attributable to a specific product divided by new customers won for that product in the same period. It makes the Level 2 comparison possible. Without it, a high-ACV enterprise product with a structurally longer sales cycle will always appear to subsidize a low-ACV self-serve product in the blended figure, and the operating partner reading the board deck will not see which product is truly earning its budget.
Marketing-Sourced Vs Marketing-Influenced ARR At Portfolio Level
Marketing-sourced ARR counts only deals where marketing created the initial opportunity. The first meaningful touch came from a marketing channel rather than an outbound sales rep. Marketing-influenced ARR captures closed-won deals where marketing had at least one meaningful touchpoint at any stage of the buyer journey, regardless of who originated the lead. Influenced ARR is typically two to four times larger than sourced ARR for the same period.
This distinction drives allocation at the portfolio level. Sourced ARR identifies which products and channels create demand from scratch, which justifies scaling a channel. Influenced ARR shows marketing’s contribution to deal velocity and win rate across sales-originated pipeline, which justifies maintaining mid-funnel investment even when sourced pipeline looks thin. Presenting only one of these to a board or sponsor produces an incomplete picture of where marketing earns its budget.
For PE operating partners reading across five to twelve portfolio companies, the definitions must be standardized. Each portfolio company defining “marketing-sourced pipeline” differently creates apples-and-oranges sums that cannot be benchmarked until measurement definitions are aligned.
Incremental ARR Vs Marketing-Sourced ARR
Marketing-sourced ARR measures which deals marketing originated. Incremental ARR measures how much additional ARR marketing caused, the lift above what would have closed without the marketing investment. The gap between the two is significant.
A deal that entered the CRM from an outbound call but closed after the buyer engaged with a retargeting campaign, a case study, and a competitive comparison page appears as zero in marketing-sourced ARR and in most attribution models. That deal still represents incremental ARR that marketing influenced. For channel prioritization, marketing-sourced ARR should be weighted much more heavily than marketing-influenced ARR, because influenced ARR inflates every channel’s contribution and blurs which channels truly created demand.
Incremental ARR, measured through holdout testing or controlled experiments, is the most defensible number in a board review and the hardest to produce at scale. It also makes the Level 2 comparison meaningful, because payback periods only become comparable once each product’s contribution is isolated.
CAC Payback Benchmarks For SaaS Portfolios
There is no single universal CAC payback target for SaaS. The number is highly correlated to ACV, and reading it without that context produces benchmarks that miss reality for most portfolio companies.
The 2026 Aleph x Benchmarkit SaaS & AI Performance Benchmarks, drawn from 342 companies, puts the median B2B SaaS CAC payback at 16 months, with top-quartile companies recovering CAC in 6 months or fewer and bottom-quartile companies taking 24 months or more. Benchmarkit’s analysis states CAC payback “is highly correlated to ACV” and should be read in that context. Sub-$5,000 ACV deals pay back in about 11 months at the median, while $50,000 to $100,000 ACV deals run closer to 22 months.
The commonly cited “under 12 months is strong” benchmark applies to SMB-focused SaaS with short sales cycles and small contract sizes. ChartMogul states that 12–24 months is typically considered normal and acceptable for larger-contract, enterprise-focused SaaS companies. Longer sales cycles in that segment push CAC higher through more sales calls, more stakeholders, and more marketing touches per deal. Bessemer’s segmented targets — under 12 months for SMB, under 18 months for mid-market, under 24 months for enterprise provide operationally useful benchmarks for portfolios with products across multiple ACV tiers.
For a multi-product portfolio, the practical move is to set a payback target for each product based on its ACV tier, then track trend rather than snapshot. A product whose payback drifts from 14 months to 19 months over three quarters is signaling a targeting or creative problem that needs correction before it escalates into a board-level issue.
The Board And Sponsor Reporting Layer
A CFO or PE operating partner in a board or sponsor review asks five questions about marketing, in this order: What did marketing spend? What pipeline did it produce? What did it cost to acquire a customer? How long until that cost is recovered? What is the plan for next quarter’s number?
Those questions are answerable. The reporting stack most multi-product SaaS companies use struggles to answer them, because the data lives in three systems that do not agree and requires manual reconciliation the week before the board deck is due.
The board reporting layer requires four elements:
- Pipeline By Source, By Product: Marketing-sourced and marketing-influenced pipeline separated and reconciled to finance.
- CAC By Product And Channel: Fully loaded, including media spend, agency fees, creative, tooling, and a prorated share of marketing headcount.
- Gross-Margin-Adjusted Payback By Product: Trended across three to four quarters.
- Forward Pipeline Coverage: Sized against the next two quarters’ plan.
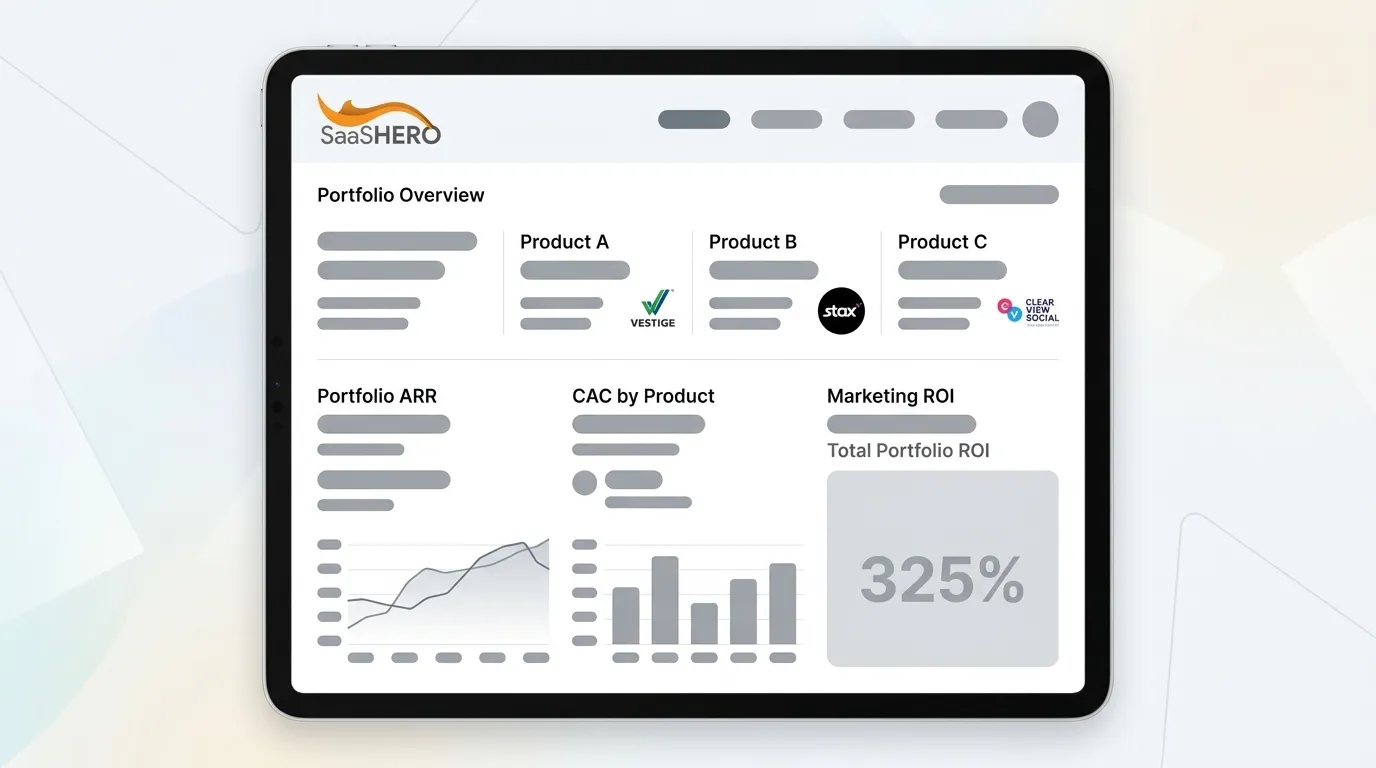
SaaSHero’s reporting layer connects directly to the client’s CRM instead of to platform exports. That connection allows the model to reconcile pipeline to finance rather than to the ad platform. Because the data comes from one source, the board deck and the team’s weekly working view share the same numbers, and the deck stops being a separate artifact assembled under pressure.

See The Portfolio ROI Dashboard In Action
Common Portfolio Measurement Failures
Three failures appear consistently in multi-product SaaS marketing measurement. Each has a diagnostic question the operator can ask internally to confirm whether it is present.
- Blended Metrics Hiding Underperformance: One efficient product subsidizes another in the blended CAC, and the portfolio average looks acceptable while one product line destroys value. Diagnostic: Can you produce a gross-margin-adjusted CAC payback figure for each product independently, without pulling from a shared cost pool?
- Attribution Across Business Units: Shared brand spend, shared events, and shared content are allocated to whichever product’s marketing team entered the cost or are not allocated at all. Diagnostic: Do your product-level CAC figures include a prorated share of shared marketing costs, and is that proration documented and consistent quarter over quarter?
- Undercounted Shared Costs: Agency retainers, marketing operations headcount, and attribution tooling sit in a shared services budget and fall outside CAC. Comprehensive CAC must include media spend, creative costs, personnel, and technology platforms, because boards that see only ad spend in the CAC calculation will eventually discover the full number and question every prior report. Diagnostic: Does your CAC figure reconcile to invoices, or does it reconcile to the ad platform dashboard?
Frequently Asked Questions About Portfolio-Level Marketing ROI
What Is A Good ROI For SaaS Marketing?
There is no single defensible ROI figure for SaaS marketing. Any benchmark that omits the gross margin used in the calculation, the ACV of the products being measured, and whether the numerator is revenue or gross profit cannot be compared across companies. The worked example above shows how much the margin assumption moves the number: at 80% gross margin the portfolio returned 220%, and at 55% the same revenue would return 120%. Both outcomes can be acceptable in context. The more useful focus is whether the gross-margin-adjusted ROI for each product in the portfolio is trending up or down and whether allocation reflects those trends.
How Much Should A SaaS Company Spend On Marketing?
Marketing spend as a percentage of ARR varies by growth stage, motion, and whether the company is venture-backed or PE-backed. Published guidance suggests growth-stage B2B SaaS marketing budgets typically fall in the 8–15% of ARR range, narrowing toward 6–10% at scale, though median observed marketing spend is closer to 8% of ARR. PE-backed software companies tend to run leaner on go-to-market spending than VC-backed peers, allocating about 33% of revenue to sales and marketing versus 47% for VC-backed firms.
For a multi-product portfolio, a more useful frame is to size each product’s marketing budget from its ARR target, work backward through required pipeline and SQL volume, price those SQLs by channel, and then aggregate to a portfolio total. A percentage-of-revenue target applied to the blended portfolio number will systematically over-fund mature products and under-fund high-growth ones.
What Is A Good CAC Ratio For SaaS?
The LTV:CAC ratio is the most commonly cited CAC health metric, with 3:1 generally considered the minimum viable threshold and top-quartile companies running 4:1 to 6:1. For a multi-product portfolio, this ratio must be calculated by product. An enterprise product with an $8,400 CAC and a $50K ACV at 80% gross margin and low churn can sustain a longer payback and still produce a strong LTV:CAC ratio. An SMB product with a $450 CAC and a $5K ACV at 60% gross margin and higher churn may look efficient on CAC alone but produce a weak ratio. The allocation decision at the portfolio level should weight toward the product with the stronger gross-margin-adjusted LTV:CAC trend.
How Do You Show Results In A Marketing Portfolio?
The four reporting elements described above, pipeline by source, fully loaded CAC, gross-margin-adjusted payback, and forward coverage, should each be presented as a three-to-four-quarter trend rather than a single-period snapshot. Activity metrics such as impressions, clicks, and MQL volume belong in the operational appendix, and the board slide should close with a specific budget decision requested.
Conclusion And Practical Next Steps For Portfolio Teams
The three-level framework of portfolio allocation, product comparison, and channel execution turns marketing ROI for SaaS portfolio companies into an actionable system. The gross-profit ROI example shows why revenue-based ROI overstates return when margins differ. The board reporting layer translates the model into the five questions a CFO or operating partner actually asks.

The next step is to apply the framework to an internal review. Separate your blended CAC into product-level figures, calculate gross-margin-adjusted payback for each product, and identify which product’s economics justify the next incremental dollar.
SaaSHero is the outsourced inbound growth team that owns the measurement layer end to end: CRM-connected reporting, paid media, creative, landing pages, and attribution. The portfolio ROI model becomes a live dashboard rather than a quarterly reconciliation exercise.
Review Your Portfolio Metrics With SaaSHero