




Written by: Aaron Rovner, Founder, Saas Hero | Last updated: September 4, 2026
Key Takeaways
- Performance marketing captures immediate demand through measurable actions like trials and demos. Brand marketing creates long-term awareness and trust that compounds over time.
- Companies can follow a stage-based budget split, starting at 90% performance and 10% brand pre-PMF, then shifting to 40–50% performance and 50–60% brand at $20M+ ARR.
- Brand equity is best tracked through directional metrics like branded search volume, direct traffic, win-rate differentials, and organic-versus-paid CAC gaps that boards can tie to revenue.
- Over-optimizing for cheap form fills drives lead volume up while pipeline stays flat. SaaSHero avoids this by optimizing against CRM revenue events instead of secondary conversions.
- Talk with SaaSHero about building a balanced acquisition strategy that captures demand now and builds brand equity that lowers CAC later.
Brand vs Performance in B2B SaaS: How They Work Together
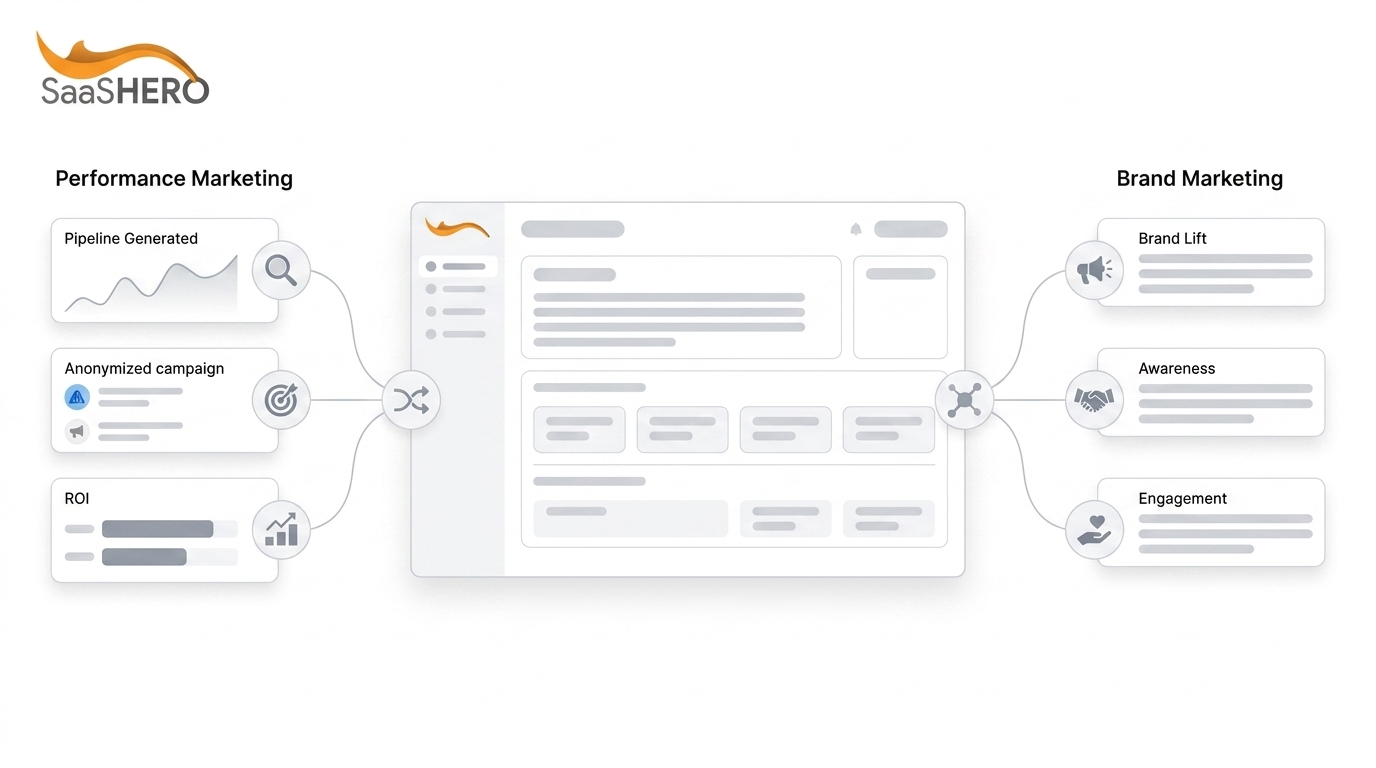
Performance marketing drives immediate, measurable actions such as sign-ups, demo requests, and free trials through paid channels tuned to specific conversion events. Brand marketing builds long-term trust, awareness, and market differentiation that compounds over months and years. In B2B SaaS, this maps directly to demand capture versus demand creation. Performance captures existing demand from buyers already searching for a solution. Brand creates demand among buyers who have the problem but have not named it yet.
| Dimension | Performance Marketing | Brand Marketing |
|---|---|---|
| Primary Goal | Demand capture: clicks, trials, demo requests from in-market buyers | Demand creation: awareness, trust, and category association among future buyers |
| Timeframe | Results in days to weeks, and branded-search lift becomes readable in 60–90 days after brand investment begins | Each compounding stage takes 6–18 months, with early months showing slower movement before effects accelerate |
| Core Metrics | CAC, ROAS, payback period, cost per SQL | Branded search volume, direct traffic, share of voice, brand recall, win-rate differential |
| Cost & Risk | Clean attribution and rising costs over time, with CPCs often rising 30–40% by year two and budgets tripling by year three to maintain the same pipeline | Durable equity without last-click attribution, and a tendency to be under-funded because it resists clean measurement |
Primary Goal: Demand Capture vs Demand Creation
Performance marketing targets bottom-funnel conversions such as clicks, free trials, and demo requests from buyers who are actively searching. Brand marketing targets upper-funnel awareness, positioning, and emotional connection among buyers who are not yet in a buying process.
Only 5% of B2B buyers are actively in-market at any given time. Heavy performance spend focuses on a small, expensive slice of the market and ignores the 95% who will eventually buy but are not searching yet. SaaSHero’s Demand Creation Framework structures paid social across three stages: awareness, consideration, and conversion. Conversion campaigns draw entirely from warm audiences built in the earlier stages. This architecture prevents the classic B2B paid social failure of asking a cold audience for a demo before they believe they have the problem.
Timeframe: Short-Term Wins vs Long-Term Compounding
Performance marketing delivers results in days to weeks with direct attribution tied to specific campaigns and keywords. Brand marketing pays off over a longer horizon. Branded-search lift typically becomes readable in 60–90 days, while win-rate improvements require 90–180 days to mature.
A strengthening brand reduces blended acquisition costs over time, so CAC trends become a longer-term outcome signal for brand investment. This compounding effect separates category leaders from also-rans. Brand investment made at $10M ARR pays dividends at $30M ARR, when acquiring a new customer through paid channels alone would otherwise be far more expensive.
Core Metrics: From CAC and ROAS to Branded Search and Win Rates
Performance marketing is measured on Customer Acquisition Cost, Return on Ad Spend, and payback period. Brand marketing is measured on branded search volume, direct traffic, share of voice, and brand recall.
Two benchmarks provide a practical signal for brand equity. If organic CAC is within 2× of paid CAC, brand equity is minimal. If organic CAC is 3× better than paid CAC, brand equity is building. This organic-versus-paid efficiency comparison is one of the most CFO-legible proxies for brand health because it uses unit economics language boards already understand.
For win-rate measurement, buyers who arrive with pre-existing brand familiarity close at higher rates due to reduced perceived risk. Tracking the close-rate gap between deals with prior brand exposure and those without creates a brand outcome metric that boards can quantify in revenue terms.
Cost & Risk: Attribution Clarity vs Rising Ad Costs
Performance marketing’s primary advantage is attribution clarity. Its primary structural risk is cost inflation. CPCs often rise 30–40% by year two as high-intent keywords are exhausted, and by year three companies can spend three times their year-one budget to generate the same pipeline, with colder prospects and lower close rates.
Brand marketing builds durable equity but resists clean attribution. The measurement problem quietly kills brand in many B2B companies through a subtle logic error: “we can’t measure brand, so we can’t justify investing in it, so we’ll put the money into performance where we can prove ROI.” This mindset treats measurability as a proxy for value. Companies that insist on measuring brand like performance usually under-fund it and become invisible to their future market.
The “measurable-vs-meaningful trap” is the signature budget mistake at this scale. Confusing what is easily measurable with what is meaningful leads teams to over-fund precisely measurable performance marketing while systematically under-funding brand.
How Brand Amplifies Performance: Real SaaS Examples
Brand acts as a performance multiplier by pre-warming prospects. This raises click-through rates, improves conversion rates, and compresses sales cycles on paid campaigns. B2B buyers with pre-existing vendor brand familiarity have purchase timelines 23–35% shorter than buyers without prior exposure.
SaaSHero’s work with TestGorilla, a pre-employment assessment platform that had raised a $70M Series A, shows this dynamic in action. The engagement achieved an 80-day payback period on paid acquisition and added more than 5,000 new customers. That outcome required a disciplined performance architecture supported by brand equity that shortened the consideration phase.
TripMaster, a transit software company with procurement-heavy sales cycles, illustrates the same pattern in a longer deal environment. SaaSHero’s paid search program generated $504,758 in net new ARR over one year with a 650% ROAS and a 20% conversion rate from paid search. That conversion rate reflects a market where procurement teams already recognized and trusted the brand.

Customers who cite brand reputation as a purchase factor have 30–40% lower churn than category averages, and companies in the top quartile of brand equity achieve 1.5–2× higher net revenue retention than category averages. Lower churn improves LTV:CAC ratios, which makes paid acquisition economics more favorable over time.
See how SaaSHero structures paid acquisition to capture demand today while building the brand equity that lowers acquisition costs tomorrow.
Stage-Based Budget Allocation Framework for SaaS Growth
The right brand-to-performance split depends on company stage, market saturation, and unit economics. The framework below offers specific starting percentages with rationale for each stage.
Pre-PMF (under $1M ARR): 90% performance / 10% brand. The priority is finding product-market fit and generating repeatable conversion evidence from at least one channel. Brand investment at this stage stays small but present. Brand compounds over multi-quarter cycles, and early investment shortens the time to visible compounding.
Early Growth ($1M–$5M ARR): 70% performance / 30% brand. Channel validation becomes the primary job. Early-growth companies should validate channels and begin building owned distribution through thought leadership, content, and community presence that will compound into category association over the next 12–24 months.
Scaling ($5M–$20M ARR): 55% performance / 45% brand. At this stage, brand investment pre-warms prospects and lowers blended CAC on performance channels. Brand and performance act as multipliers: brand pre-warms prospects so paid ads see higher click-through and conversion rates and shorter sales cycles, while performance marketing captures and measures the demand that brand creates.
Mature ($20M+ ARR): 40–50% performance / 50–60% brand. At scale, high-intent keywords are largely saturated and incremental performance spend produces diminishing returns. Category-winning SaaS companies like Salesforce, HubSpot, and Gong spend more on brand than performance marketing, using brand as a moat to create demand rather than only capture it. Brand investment at this stage separates category leaders from the rest.
These percentages serve as starting points. Actual allocation should follow CAC payback data, organic-versus-paid CAC comparison, and the pipeline coverage ratio the board has committed to.
Measuring Brand Impact in SaaS: Practical Methods
The measurement challenge is real, yet teams can solve it with a directional dashboard instead of demanding last-click precision that brand cannot provide.
A practical brand measurement dashboard for mid-market B2B SaaS combines the following indicators:
- Branded search volume in Google Search Console, showing whether prospects actively search for the company by name, tracked as a trend over time
- Direct traffic in GA4, showing people arriving intentionally rather than via an intermediary channel, with direct and branded traffic becoming readable in 30–60 days after brand investment begins
- Share of voice in SEMrush or a similar tool, showing the brand’s presence in category conversations relative to competitors
- Win-rate differential in the CRM, comparing close rates in deals with pre-existing brand familiarity versus those without
- CAC trend over rolling quarters, where a declining blended acquisition cost signals brand equity building
For a more direct read on awareness, a minimum viable brand equity survey costs $5K–$20K per wave using third-party panels such as Lucid, Cint, or Wynter. The survey should include unprompted category recall, prompted awareness and consideration, and trust ratings. Run annually with consistent methodology, this produces year-over-year comparison data that stands up in a board setting.
For a $10M ARR SaaS company, a target benchmark of 25–35% unprompted awareness among a well-defined ICP indicates that brand investment has reached critical mass. SaaSDash notes that awareness below 10% for a $5M ARR company suggests brand investment has not yet reached that threshold.
Directional, imperfect measurement of something valuable beats precise measurement of something trivial.
Common Mistakes: Over-Optimizing for Cheap Leads
The signature failure at mid-market scale appears when lead volume rises while pipeline stays flat. Ad platforms optimized toward form fills find the cheapest people to convert, such as students, competitors, job seekers, and existing customers, while reporting a falling cost per conversion. The dashboard improves on every metric the board watches, and the pipeline the sales team can work does not move.
This pattern reflects a self-fulfilling prophecy. The platform is succeeding at the goal it was given. Feed the machine high-quality data and it finds high-quality prospects. Feed it a generic form fill and it finds the cheapest people willing to complete forms.
SaaSHero’s primary-versus-secondary conversion architecture addresses this directly. SaaSHero separates secondary conversions such as content downloads, webinar registrations, and low-commitment form completions from primary ones. Secondary conversions stay tracked and visible in reporting but never drive account-wide optimization, because only primary conversions map to qualified pipeline events. By pushing lifecycle stage events from the CRM back into the ad platforms, the algorithm learns from qualified outcomes rather than raw form volume. This shift changes which keywords receive budget, which audiences scale, and which leads the platform pursues next.
Frequently Asked Questions
What is the 3-3-3 rule in marketing?
The 3-3-3 rule is a content production guideline, not a budget allocation framework. It states that content should hold attention for three seconds, deliver value within three minutes, and produce action within three days. It does not govern brand-versus-performance budget decisions in B2B SaaS. Budget allocation at this stage depends on unit economics such as fully loaded CAC, LTV:CAC ratio, and CAC payback period, combined with a stage-based framework that shifts the brand-to-performance ratio as the company scales. Heuristics like the 3-3-3 rule help with content decisions, while capital allocation decisions require revenue math.
Does performance marketing have a future?
Performance marketing has a strong future, but the playbook is resetting. Third-party cookie deprecation, rising CAC across verticals, and AI-driven platform automation have changed what the job requires. Manual bidding, manual keyword control, and manual placement selection now sit inside the platforms. What remains under human control is narrow: which conversion events the algorithm pursues and how good those events are as proxies for revenue. The future favors marketers who optimize against CRM revenue data rather than form fills, use first-party data strategies, and treat brand as a performance multiplier instead of a separate budget line. An agency that cannot connect ad spend to CRM outcomes is optimizing the wrong variable, and the platform will faithfully find more of whatever it is rewarded for.
Should startups focus on branding or performance marketing first?
Pre-PMF startups should skew heavily toward performance, with a 90/10 split as outlined in the stage-based framework above, to find product-market fit and capture immediate revenue evidence from at least one channel. Performance marketing at this stage functions as a learning tool as much as a growth tool. It generates the conversion data needed to understand who buys, why they buy, and what they pay. Even at this stage, a minimal brand investment is worth making. The 6–18 month compounding cycle mentioned earlier means early brand investment pays off later. A company that starts brand investment at $5M ARR will see compounding effects at $15M ARR. A company that waits until $15M ARR will see them at $30M ARR, if the performance ceiling has not already forced a crisis.
How do you measure brand marketing ROI for a board presentation?
Board-ready brand measurement relies on a dashboard of directional indicators rather than a single attribution number. Lead with metrics that translate directly into dollars. The win-rate differential between deals with prior brand familiarity and those without, where a 3–5 point improvement on competitive deals is quantifiable in ARR terms, is one example. The organic-versus-paid CAC gap, where a widening gap signals brand equity building, is another. Support these with branded search volume trends from Google Search Console, direct traffic trends from GA4, and share of voice from a competitive intelligence tool. For a direct awareness read, a brand equity survey run annually with consistent methodology provides year-over-year comparison data. Present the brand number as a range with clear attribution assumptions rather than a false-precision point estimate. Boards that understand unit economics accept directional measurement of a compounding asset more readily than a fabricated attribution claim.
What is the performance marketing ceiling in B2B SaaS?
The performance marketing ceiling is the point at which incremental spend on paid channels stops producing proportional pipeline returns. It typically appears when high-intent keywords are saturated, CPCs have risen to the point where the channel’s unit economics no longer justify scaling, and the sales team reports that lead quality is declining even as volume holds. The ceiling reflects a structural consequence of a market where only 5% of buyers are in-market at any given time. Once that 5% is captured efficiently, additional spend flows to broader, lower-intent traffic and efficiency degrades. The solution is demand creation upstream through brand investment that expands the pool of warm prospects available to performance campaigns.
Conclusion: Building a Balanced Acquisition Engine
Performance marketing without brand becomes a treadmill that gets faster and more expensive every quarter. Brand marketing without performance becomes an awareness machine that struggles to prove value to a board that wants pipeline numbers. A stage-based allocation that treats brand as a performance multiplier and measures both disciplines against CRM revenue data creates a more durable growth engine.
The allocation percentages in this framework serve as starting points. The actual split should follow CAC payback data, the organic-versus-paid CAC comparison, and the pipeline coverage ratio the business has committed to. The measurement discipline should stay consistent across stages. Every dollar of brand and performance spend should be traceable to qualified pipeline, lifecycle stage, and closed revenue in the CRM.
SaaSHero owns the entire paid acquisition engine for B2B SaaS companies, including strategy, creative, landing pages, and reporting, all tuned to CRM revenue outcomes rather than form-fill counts. Engagements validate a primary channel first, then expand into demand creation once the measurement architecture is clean enough to read both disciplines accurately.
Learn how SaaSHero builds and executes a balanced brand-and-performance acquisition strategy for B2B SaaS companies at your stage of growth.