




Written by: Aaron Rovner, Founder, Saas Hero
Key Takeaways For Series B SaaS Teams
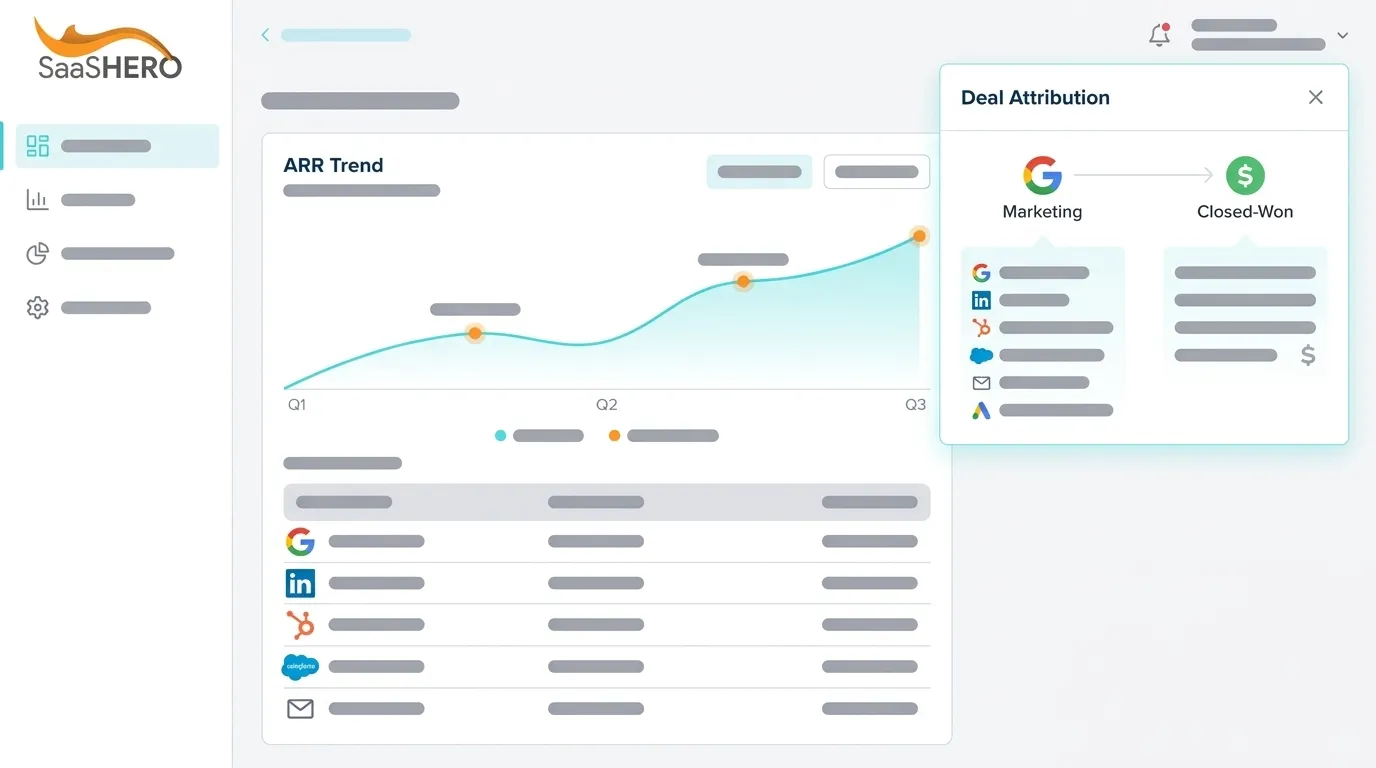
- Account-based multi-touch attribution rolls every touchpoint from a buying committee into one account record and ties those touches directly to closed-won ARR.
- Series B SaaS companies struggle with attribution because nobody owns the join between ad-platform clicks and CRM opportunities. The failure comes from missing joins, not from model choice.
- MQL volume gives way to three layers: Marketing-Sourced ARR, Marketing-Influenced ARR, and efficiency metrics such as CAC and payback period.
- The CRM object model must enforce Account ID on every record and a consistent contact-to-account association. Touchpoint fields must support the Account → Opportunity → ARR join.
- SaaSHero builds and owns the full attribution chain from impression to CRM revenue. Its board-ready reporting reconciles ad spend to pipeline and closed-won ARR.
Book A Discovery Call With SaaSHero
The Series B Attribution Problem: Why Nobody Owns The Number
The ad platforms, GA4, the CRM, and the marketing automation platform each report a different number, and nobody arbitrates. Series B SaaS companies miss on marketing attribution to revenue because nobody built and maintained the join between the ad platform click and the CRM opportunity, and no single party owns the number.
The result is a board meeting where the CFO asks about CAC payback and pipeline coverage. The VP of Marketing rebuilds the deck by hand from three sources that do not agree. This guide shows how to build the join, configure the conversion architecture, and produce a board-ready view that survives a PE operating partner's review.
See How SaaSHero Builds The Join
Why MQLs Break At Series B And What Replaces Them
MQLs came from a world where one person made a buying decision after clicking one ad. B2B buying journeys typically span 10–20 touchpoints before a conversion. A buying committee of multiple stakeholders means the MQL model scatters the journey across disconnected person-level records. At Series B, with a committed pipeline number and a board or PE operating partner asking finance-language questions, MQL volume does not hold up as an answer.
The minimum viable reporting structure for a $30M–$50M ARR sales-led SaaS company contains three layers:
- Marketing-Sourced ARR: opportunities where marketing created the initial qualifying touch, credited on agreed rules and reconcilable to bookings.
- Marketing-Influenced ARR: open or closed opportunities where at least one account contact engaged with a tracked marketing program within the attribution window. This functions as a coverage metric rather than a credit metric.
- Efficiency Metrics: CAC, CAC payback period, and pipeline per dollar of spend.
CFOs expect marketing to report pipeline coverage ratio, blended CAC by channel, fully loaded CAC payback period, and marketing-sourced revenue. They do not anchor on MQL volume or impression share. Marketing-sourced closed-won ARR is the primary revenue-contribution metric, with marketing-influenced ARR as a supporting metric rather than the headline.
The CRM Object Model: Building The Join From Account To Closed-Won ARR
The join that makes account-based multi-touch attribution work is a data architecture decision, not a reporting configuration. The correct grain for Series B SaaS is the account. Person-level models fragment a buying committee across disconnected records and cannot answer whether marketing spend produced a closed deal.
The join runs in this sequence: Account → Contact → Touchpoint → Opportunity → ARR → Close Date.
For that join to execute, six fields must exist and be populated consistently across every record:
- Account ID: a unique identifier required on every record, including Contact, Touchpoint, and Opportunity. This lets a query traverse the join without ambiguity.
- Contact-To-Account Association: every contact linked to exactly one account. Contacts without an account association remain invisible to account-level attribution.
- Touchpoint Source And Timestamp: channel, campaign, ad group, and click time. These fields support credit assignment and application of an attribution window.
- Opportunity Stage And Amount: pipeline value at each stage. These fields support pipeline coverage calculations and marketing-sourced pipeline by channel.
- Close Date: actual or forecast. This date sets the right boundary of the attribution window.
- Lifecycle Stage: MQL, SQL, Opportunity, Closed-Won. This progression feeds bidding algorithms qualified signals rather than raw form fills.
The join logic is identical across CRMs; only the implementation differs. In Salesforce, the Touchpoint record is typically a custom object carrying the Account ID as a lookup field. In HubSpot, touchpoints are captured through the Deals object and associated contact activity, with campaign attribution fields mapped at the contact and deal level. In both systems, the touchpoint record must carry the Account ID, and the opportunity record must carry the same Account ID. That structure lets a query return all touchpoints associated with a closed-won opportunity within the attribution window.
Company domain is the most reliable join key across web analytics, ad platforms, and CRM, and should be a required field on every contact and account record. Teams with duplicate accounts, unmapped opportunity stages, or missing valid emails will find that attribution software amplifies the data-quality problem rather than solving it. The join must be clean before any model is applied.
Attribution Windows And Model Selection For Your Actual Sales Cycle
A 90–120 day lookback window matches a four-month sales cycle. A 2026 benchmark corpus for B2B SaaS reports median sales cycle lengths of 12 weeks for $10K–$50K deals and 17 weeks for $50K–$100K deals, measured from opportunity created date to close date. For a $30M–$50M ARR company selling mid-market SaaS, a 90-day lookback is the practical minimum. A 120-day window is more defensible for deals above $50K ACV.
W-shaped or position-based attribution fits a buying committee better than linear. Position-based (U-shaped) attribution commonly splits credit 40% to the first touch, 40% to the lead-creation touch, and 20% across all middle touchpoints. This pattern works as a sensible default before data-driven modeling becomes viable. Linear attribution treats every touchpoint equally, which understates the first and last touches that bracket the buying decision.
Safari's Intelligent Tracking Prevention caps the lifespan of certain cookies at seven days and aggressively restricts cross-site tracking, while Firefox's Enhanced Tracking Protection blocks known tracking scripts entirely. These browser controls create the measurement gap between ad platform clicks and CRM records. This structural condition sits upstream of configuration and means browser-side pixels miss a material share of touchpoints before any attribution model is applied.
LinkedIn adds a hard platform constraint. LinkedIn's Conversions API rejects conversion events with timestamps older than 90 days, returning a 400 validation error. For a Series B SaaS company with a four-to-six-month sales cycle that wants to feed closed-won data back to LinkedIn, closed-won events cannot be streamed directly. The practical workaround is to stream mid-funnel lifecycle-stage events such as MQL creation, SQL creation, and opportunity creation. These events fall within the 90-day window and still provide qualified signals to the bidding algorithm.
The Conversion Architecture: Primary Vs Secondary Conversions
Feeding form fills to Smart Bidding trains the account toward the wrong audience. The ad platform follows the goal it receives and finds the people most likely to fill out forms: students, job seekers, competitors, and existing customers. Cost per lead falls, lead volume rises, and the pipeline the sales team can work stays flat.
A primary-versus-secondary conversion hierarchy corrects this pattern. Secondary conversions such as content downloads, webinar registrations, newsletter signups, and low-commitment form completions stay tracked and visible in reporting. They never drive account-wide optimization. They are evidence of interest, not evidence of a buyer. The table below shows how the two optimization approaches diverge across training signal, reporting focus, and volume outcomes.
| Element | Form-Fill Optimization | CRM-Revenue Optimization |
|---|---|---|
| What the ad platform is trained on | All form fills weighted equally | Qualified opportunities and lifecycle-stage events |
| What the monthly report leads with | Leads, CPL, impression share | Pipeline, CAC, payback period |
| What happens when volume rises | Lead count rises, pipeline does not | Lead count and qualified opportunities rise together |
Lifecycle-stage events should flow back into the ad platforms so the bidding algorithm learns from qualified outcomes rather than page events. When a lead becomes an SQL, when an opportunity is created, and when a deal closes, those CRM state changes can return to the platform as the signal worth optimizing toward.
LinkedIn added MARKETING_QUALIFIED_LEAD and SALES_QUALIFIED_LEAD conversion types starting with API version 202608, enabling B2B advertisers to stream mid- and late-funnel qualified signals rather than only top-of-funnel leads. LinkedIn supports 180-day and 365-day post-click attribution windows for MARKETING_QUALIFIED_LEAD and SALES_QUALIFIED_LEAD conversion types. These extended windows help companies with longer sales cycles.
Server-side tracking now functions as a foundational requirement for accurate attribution rather than an optional upgrade, because browser-side pixels miss a material portion of conversion events. When running browser pixels and server-side tracking simultaneously, teams must pass a unique event ID through both so the ad platform can deduplicate automatically and avoid counting the same conversion twice.
Improve Your Conversion Architecture
Triangulating With Self-Reported Attribution
No pixel reaches a peer recommendation, a private Slack conversation, an analyst report, or a G2 review read at 11pm. The dark funnel, including peer recommendations, private Slack conversations, analyst reports, and private LinkedIn DMs, generates buyer interactions that influence pipeline but produce no trackable events.
A “How did you first hear about us?” field on the demo request form and structured closed-won interviews with new customers capture channels the CRM join cannot see. Self-reported attribution complements the join rather than replacing it. It validates the model and surfaces systematic undervaluation. If 30% of deals self-report a channel the model credits with only 5%, that channel is undervalued. In that case, the budget allocation built on the model directs spend away from what actually works.
Self-reported data is directional rather than precise. Respondents recall the most memorable touchpoint, not necessarily the first or most influential one. Its value lies in flagging systematic gaps in the CRM join, not in replacing it as the primary attribution source.
The Board-Ready Reporting View In The CFO's Vocabulary
A Series B SaaS marketing dashboard presented to a board or PE operating partner should contain new ARR, marketing-sourced ARR, marketing-influenced ARR, CAC, CAC payback period, and pipeline per dollar of spend. In PE-backed companies, marketing should demonstrate $40–$50M in pipeline for every $10M the business needs to close in a quarter, anchoring updates to pipeline coverage ratio rather than lead volume.
The standard healthy benchmark for pipeline coverage is 3–4x quota; below 2.5x is a warning sign requiring immediate pipeline generation investment. Fairview's 2026 RevOps metrics framework benchmarks marketing-sourced pipeline at 40–60% of total pipeline for growth-stage B2B SaaS.
LTV:CAC of 3:1 is generally considered healthy for SaaS, and CAC payback under 12 months is strong. These are the standard thresholds for evaluating whether an acquisition channel is healthy. The 2026 Aleph × Benchmarkit benchmark report puts the median B2B SaaS CAC payback period at 16 months, with Fairview's 2026 RevOps framework benchmarking CAC payback at 12–18 months for mid-market B2B SaaS. Alok Chakraborty, Founder of Ivris Tech, recommends reporting CAC payback with its calculation method attached, for example, “15 months, new plus expansion ARR, gross-margin adjusted,” because board members who have seen two portfolio companies report incomparable numbers will recognize the difference.
The recommended reporting structure separates marketing-sourced pipeline and revenue from marketing-influenced pipeline so finance can reconcile labels to bookings. CTR, email open rate, and raw lead volume belong in operating reviews, not board updates.
What Attribution Cannot Prove
Multi-touch attribution allocates credit according to chosen rules. It does not prove that removing a channel would remove the revenue. Attribution assigns credit for conversions that already happened, while incrementality measures whether the advertising actually caused those conversions to happen. A customer who sees a retargeting ad and buys might be attributed to that ad, but if they were already going to buy regardless, the ad generated zero incremental revenue.
Attribution error does not behave like random noise. It runs in one direction, over-crediting tactics closest to conversion like remarketing and under-crediting demand-creating tactics upstream like non-brand search prospecting. Budget decisions made from attribution reports alone move money in exactly the wrong direction.
For budget decisions that require causal evidence, such as launching or scaling a channel, evaluating retargeting, or defending spend to a PE operating partner, incrementality testing and marketing mix modeling are the appropriate tools. Attribution remains useful for campaign reporting, creative comparison, and funnel diagnosis. The two approaches work together rather than competing.
Frequently Asked Questions About Series B Attribution
Does This Setup Differ For Sales-Led Vs Product-Led Series B SaaS?
Sales-led motions have a CRM opportunity object as the natural join point. Every deal flows through an opportunity record with a close date, an ARR amount, and an associated account, so the join described in this guide works directly against that structure. Product-led motions require additional event tracking from the product to connect usage signals to the account record. A trial signup or a product-qualified lead event must be captured, associated to an account, and surfaced in the CRM before the attribution join can traverse it. Hybrid PLG-and-sales-led companies need both layers: product usage events feeding into the CRM alongside the opportunity object, so the full buying journey from first product interaction through sales-assisted close appears in one account timeline.
Which CRM Should We Use As The System Of Record?
Salesforce and HubSpot are the standard choices for Series B B2B SaaS. The requirement is that the CRM supports custom objects or fields for touchpoint tracking, enforces contact-to-account association, and can be queried for attribution reporting. Salesforce supports custom objects natively and is the standard for companies with complex sales processes, multiple segments, or a RevOps team running advanced reporting. HubSpot supports custom properties and associations and is the standard for companies that want marketing and CRM in one platform with lower configuration overhead. The choice matters less than the data discipline: consistent Account IDs, verified contact emails, clean opportunity stage definitions, and a single agreed revenue source of truth reconciled with finance before any attribution model is applied.
How Do We Present Attribution Results When The Board Asks About Causality?
Present attribution as a credit-allocation model rather than a causal proof. The clear framing states that multi-touch attribution shows which touchpoints appeared in journeys that converted, weighted by the chosen model. It does not show what would have happened without any given channel. For budget decisions that require causal evidence, such as scaling a channel, cutting retargeting, or defending a large spend increase, incrementality testing provides the counterfactual. For ongoing campaign monitoring, funnel diagnosis, and creative comparison, attribution is the right tool. Boards and PE operating partners who ask causal questions receive the best answer from a combination: attribution for the directional view, and incrementality tests for channels where the budget decision is large enough to justify the experiment.
What Is The Difference Between Marketing-Sourced And Marketing-Influenced ARR, And Which Should We Report To The Board?
Marketing-sourced ARR counts only deals where marketing created the initial qualifying opportunity, typically credited on a first-touch or agreed-rule basis. It is a one-to-one assignment, with one opportunity and one origin, and serves as the accountability metric for budget allocation. Marketing-influenced ARR includes any deal where at least one account contact engaged with a tracked marketing program within the attribution window. It is a many-to-many join by design, meaning a single deal can be influenced by multiple programs, and the sum of influenced pipeline across teams can exceed total pipeline. Report both to the board, but lead with sourced ARR as the primary metric and present influenced ARR as a coverage metric with the definition in the footnote. Never show influenced pipeline as a raw dollar figure without also showing total pipeline, because the ratio is what the CFO can evaluate.
Conclusion: Build The Join And Own The Number
As the introduction argued, the attribution problem at Series B is a join problem, and the CRM object model, conversion architecture, and reporting view all flow from that structural choice. The CRM object model, the primary-versus-secondary conversion architecture, the lifecycle-stage feedback loop into Google Ads and LinkedIn, and the board-ready reporting view all depend on a clean, enforced join between ad clicks and CRM opportunities.
SaaSHero is the outsourced inbound growth team that owns the entire chain from impression to CRM record. The team manages paid media, creative, landing pages, attribution and reporting, and strategy, and it optimizes against CRM revenue data rather than the conversion counts the ad platforms report back. The firm separates primary and secondary conversions, pushes lifecycle-stage events back into the ad platforms, and builds reporting in HubSpot, Salesforce, or any other CRM that connects ad spend to leads, pipeline, and revenue, with Looker Studio dashboards alongside.
SaaSHero has managed over $60M in lifetime ad spend and roughly $16M annually. The firm has served more than 100 B2B companies, is a Google Premier Partner (top 3% of Google Partners), and has been a G2 High Performer in digital marketing for over two years, currently ranked #20 of approximately 6,000 agencies. The fee is a flat retainer based on total monthly ad spend rather than channel count, so channel-mix recommendations carry no fee consequence. For a Series B company with a board meeting in six weeks and no single party accountable for the number, that engagement structure makes the join possible.
Get A Board-Ready Attribution View