




Written by: Aaron Rovner, Founder, Saas Hero | Last updated: August 29, 2026
Key Takeaways
- Transparent multi-channel reporting starts with connecting every paid impression, click, and conversion to a single CRM-verified pipeline record so budget decisions rely on revenue outcomes instead of platform dashboards.
- B2B SaaS companies face long sales cycles, walled-garden attribution conflicts, and a gap between form fills and qualified opportunities, which makes platform-reported numbers structurally unreliable.
- The five-step framework turns fragmented platform data into unified pipeline outcomes through data warehousing, enforced campaign taxonomy, blended connectors, multi-touch attribution, and incrementality testing.
- Success benchmarks include LTV:CAC at or above 3:1, CAC payback under 12 months, and pipeline created per channel replacing cost per lead as the primary optimization target.
- SaaSHero owns paid media, creative, landing pages, and CRM-connected attribution under one flat retainer indexed to total ad spend, implementing the framework described in this guide for B2B SaaS clients.
Why Most B2B SaaS Teams Lack Revenue-Grade Attribution
This guide teaches how to build a CRM-connected, multi-channel reporting system that replaces fragmented platform data with unified pipeline outcomes. For a VP of Marketing at a $10M–$50M B2B SaaS company, the core problem is structural. Few teams have full pipeline attribution that connects ad spend to CRM revenue, while most still optimize on CPL metrics that do not correlate with revenue. The result is a $127 platform-reported cost per lead that corresponds to a true cost per SQL of $1,588 in CRM data, which creates a 12.5× gap.
Three structural forces compound this problem in B2B SaaS.
- Long sales cycles. B2B SaaS buyers have a median sales cycle of 84 days from first touch to first charge, while 41% of B2B SaaS workspaces (the most common choice, median window 27 days) use a 30-day attribution window, causing 40% of attributable revenue to disappear or be miscredited to last-touch retargeting. Short windows hide early touches and push apparent value into retargeting and branded search.
- Walled-garden discrepancies. Running platform conversion reports side-by-side without a neutral reconciliation layer overstates total attributed conversions by 2–4× for most B2B teams running ads on three or more platforms. Each platform claims credit independently, so totals inflate as channels are added.
- Primary-vs-secondary conversion hierarchy. Most accounts send every form fill to the bidding algorithm as a primary conversion. This pattern trains Smart Bidding on students, job seekers, and competitors instead of qualified buyers, which increases lead volume while pipeline stays flat.
This guide delivers board-ready pipeline reporting without manual reconciliation. The five-step framework is repeatable and any B2B SaaS marketing team can implement it with the right access and process.
Most agencies stop at the ad platform and therefore cannot connect optimization to revenue. SaaSHero is the only team that integrates all four layers, which are paid media execution, creative production, landing page performance, and CRM-connected attribution, under a single retainer tied to your total ad spend. Book a discovery call to see how this framework applies to your account.

Prerequisites and Context for the Five-Step Framework
The five-step framework requires specific tools and access levels to function. Before diving into the implementation steps, confirm you have the following infrastructure in place because the attribution connections in later steps depend on it.
- Google Tag Manager, with admin access, which holds conversion events and often contains the root cause of broken measurement.
- GA4, with edit access, which provides the behavioral layer that surfaces post-click discrepancies.
- CRM (HubSpot or Salesforce), with admin access to lifecycle stage definitions, deal records, and offline conversion import settings.
- Looker Studio or an equivalent BI tool, with editor access for blended connector dashboards.
- Ad platform accounts such as Google Ads, LinkedIn, Meta, and any active channels at the manager level.
Primary vs. secondary conversions defined: A primary conversion is the event used for account-wide Smart Bidding optimization. It must represent a qualified buyer signal, such as a CRM-verified MQL or SQL stage transition. A secondary conversion is tracked and visible in reporting but excluded from bidding. Form fills, content downloads, and webinar registrations sit in this secondary category. Importing HubSpot MQL-to-SQL stage transitions as offline conversions improves SQL CPA by 18–35%, while uploading Opportunity stage data improves Opportunity CPA by 22–42%. Optimizing on form fills trains the algorithm on the wrong audience and creates a self-fulfilling-prophecy pattern where lead volume rises while pipeline remains flat.
2026 consent and walled-garden API limitations: Google’s 2026 Consent Mode v2 requires four specific consent signals, which are ad_storage, analytics_storage, ad_user_data, and ad_personalization. Missing any one of these signals degrades GA4 behavior reporting, Enhanced Conversions, and remarketing lists. Following the shelving of third-party cookie deprecation, 49% of marketers report their strategies still depend on them (Adobe global survey) while 76% of European digital advertising professionals still rely on them (IAB Europe), and 81% of browser traffic still allows third-party cookies by default. Server-side tracking via Meta Conversions API and Google Enhanced Conversions now functions as a baseline requirement rather than an advanced option.
High-Level Framework Overview for CRM-Connected Reporting
The five-step framework below converts fragmented platform data into a single CRM-connected pipeline view that leadership can trust.
- Unified data warehousing via APIs, which pulls raw spend, impression, click, and conversion data from every platform into one neutral warehouse.
- Enforced campaign taxonomy with UTM and CRM IDs, which standardizes naming conventions so every click maps to a CRM record without manual reconciliation.
- Blended connectors and side-by-side metrics, which join platform data to CRM pipeline in Looker Studio dashboards the board can open directly.
- Multi-touch attribution with a variance table, which replaces last-click with a model calibrated to your actual sales cycle length and documents the gap between platform-reported and deduplicated conversions.
- Incrementality testing and data-quality gates, which use geo holdouts to confirm causal lift and automated checks that catch instrumentation failures before they distort budget decisions.
Step 1: Unified Data Warehousing via APIs
Objective: Pull raw, unmodeled data from every ad platform into a single neutral warehouse so no single platform’s self-attribution logic controls the reporting layer.
Actions:
- Select a warehouse destination such as BigQuery or Snowflake, which are standard choices for B2B SaaS at this scale. This neutral environment holds data from all sources without favoring any platform’s attribution logic.
- Connect each ad platform via its native API or a connector tool (for example, Fivetran, Supermetrics, or Improvado) to ingest spend, impressions, clicks, and platform-reported conversions at the campaign level daily. These feeds provide the ad performance data that you will later join to CRM records.
- Connect the CRM via API to pull lifecycle stage events, opportunity creation dates, deal values, and closed-won timestamps into the same warehouse. With both ad platform and CRM data in one location, you can join them on common identifiers.
- Set ingestion-time schema validation to flag null campaign IDs, missing spend values, and API schema changes before they reach the reporting layer. This quality gate prevents corrupted data from breaking the joins you will build in later steps.
B2B SaaS example: A HubSpot-connected BigQuery pipeline pulls Google Ads campaign spend alongside HubSpot deal stage timestamps. When a contact moves from MQL to SQL, that event lands in the warehouse with the original gclid attached. This setup enables spend-to-pipeline joins without manual spreadsheet work.
Tip: Performance data from walled gardens should be normalized into a unified environment such as a centralized data warehouse so impressions, clicks, conversions, and costs can be analyzed consistently, rather than compared directly from platform dashboards.
Common mistake: Teams sometimes use a platform dashboard export as the warehouse input. Ad platforms operate as walled gardens that apply self-attributing models designed to inflate their reported contribution. The warehouse must receive raw event data, not pre-attributed summary reports.
Troubleshooting: When CRM opportunity records do not join to ad platform clicks, the most common cause is a missing or overwritten click ID on the CRM lead record. Verify that gclid, li_fat_id, and fbclid are captured on form submission and stored as CRM contact fields before the lead is routed.
Quality check: Every CRM opportunity must link to at least one marketing touchpoint, opportunity amount in the CRM must match revenue value in the attribution system, and stage changes must trigger updates in marketing reporting within 24 hours.
Step 2: Enforced Campaign Taxonomy with UTM and CRM IDs
Objective: Standardize campaign naming and UTM parameters so every click, session, and CRM record shares a common key. This standardization removes the manual reconciliation that consumes a marketing ops person’s time every month-end.
Actions:
- Define a UTM taxonomy covering utm_source, utm_medium, utm_campaign, utm_content, and utm_term with a documented naming convention enforced pre-launch through a checklist or URL builder tool.
- Append a CRM campaign ID to every UTM string so the warehouse join is deterministic rather than fuzzy-matched on campaign name strings that drift over time.
- Store click IDs, including gclid, li_fat_id, and fbclid, as hidden fields on every landing page form and map them to dedicated CRM contact fields.
- Build a pre-launch validation checklist that blocks campaign activation until UTM coverage reaches 100% for that campaign.
B2B SaaS example: A LinkedIn campaign targeting VP of Engineering personas at 200–1,000-employee SaaS companies uses utm_source=linkedin, utm_medium=paid-social, utm_campaign=2026-q3-vp-eng-awareness, and utm_content=motion-graphic-v1. The CRM campaign ID appended as a custom parameter maps directly to a HubSpot campaign record, so pipeline influenced by that campaign appears without manual tagging.
Tip: Every paid campaign must apply consistent UTM parameters according to a documented naming convention; missing or broken UTMs cause analytics tools to record sessions as direct traffic and create immediate attribution gaps.
Common mistake: Allowing campaign managers to write UTM strings freehand introduces subtle inconsistencies. A single mismatch, such as utm_medium=Paid-Social versus paid-social, splits what should be one campaign into two unrecognized segments in the warehouse join.
Troubleshooting: Missing UTM parameters in HubSpot, often caused by form stripping, redirects, or workflow overwrites, break attribution links between ad platforms and CRM pipeline or revenue outcomes. Audit HubSpot’s original source drill-down report monthly and investigate any spike in “Direct Traffic” sessions that coincides with a campaign launch.
Quality check: UTM coverage should reach at least 95% of all paid sessions. A discrepancy rate above 20% between any ad platform and the CRM baseline represents a serious data-quality issue that distorts ROI calculations.
Step 3: Blended Connectors and Side-by-Side Metrics
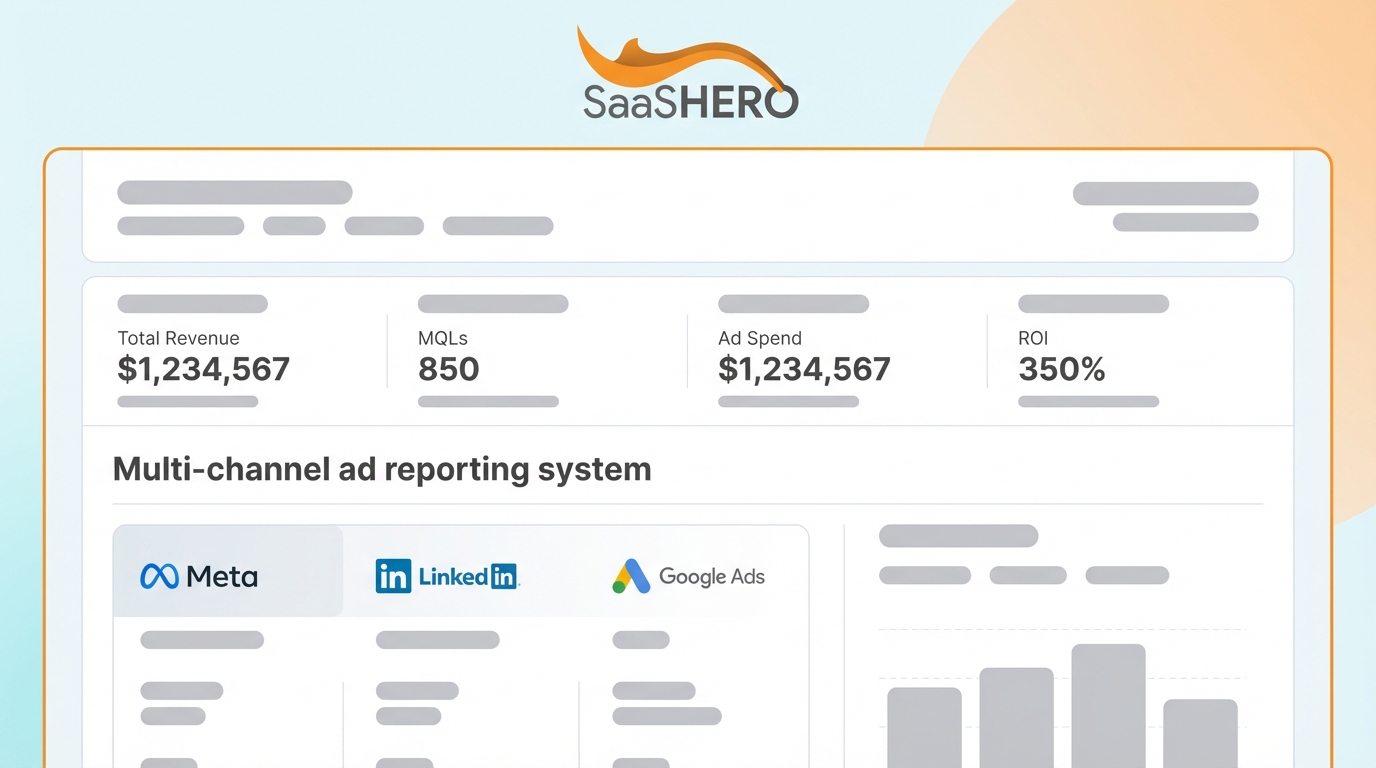
Objective: Join platform spend data to CRM pipeline data in a single Looker Studio dashboard that answers the board’s questions. The dashboard should show pipeline created by channel, CAC, and payback period without a manual rebuild each quarter.
Actions:
- Build Looker Studio data sources for each ad platform using the native Google Ads connector and community connectors for LinkedIn and Meta.
- Add a CRM data source that pulls HubSpot or Salesforce deal data via the warehouse or a direct connector.
- Create a blended data source that joins on the CRM campaign ID field established in Step 2.
- Build a single executive-summary page showing total spend by channel, pipeline created by channel, cost per SQL by channel, CAC, and CAC payback period in months.
- Publish the dashboard with view access for the CFO, CRO, and board sponsor so board reporting becomes a live view instead of a quarterly rebuild.
B2B SaaS example: A SaaS company spending $25,000 per month across Google Ads and LinkedIn connects both platforms to a Looker Studio dashboard alongside HubSpot deal data. The blended view shows Google Ads generating $180,000 in pipeline at a $4,200 cost per SQL, and LinkedIn generating $95,000 in pipeline at a $6,800 cost per SQL. The VP of Marketing can defend these numbers without translating from platform metrics.
Tip: Effective marketing analytics governance follows a four-layer framework: data ownership and access, taxonomy and data quality standards, measurement architecture, and decision-grade reporting with documented KPI logic. The dashboard represents the output of all four layers rather than a substitute for them.
Common mistake: Some teams build separate dashboards per channel and ask leadership to synthesize them. Cometly recommends establishing a single source of truth using dedicated attribution reporting software that aggregates data from ad platforms, the CRM, and website data, rather than relying on Meta Ads Manager or Google Ads as the authoritative record for conversions.
Troubleshooting: When blended data sources return null pipeline values for campaigns with confirmed spend, the join key is usually broken. Verify that the CRM campaign ID field is populated on at least 90% of CRM contact records sourced from paid channels before diagnosing the connector.
Quality check: The dashboard’s total pipeline figure should reconcile to within 10% of the CRM’s pipeline report for the same date range and channel filter. Persistent gaps above 15% indicate a taxonomy or join-key problem rather than a reporting tool problem.
SaaSHero builds and maintains this reporting layer for every client. CRM-connected Looker Studio dashboards sit alongside HubSpot reporting so the numbers the board sees match the numbers the team uses for optimization. Book a discovery call to see the executive-summary dashboard template.

Step 4: Multi-Touch Attribution with a Variance Table
Objective: Replace last-click attribution with a model calibrated to your actual sales cycle length and document the gap between platform-reported and deduplicated conversions so budget decisions rest on defensible numbers.
Actions:
- Pull your p90 deal-cycle length from CRM closed-won data, which is the point at which 90% of deals close, and set your attribution window to match. B2B attribution windows should be calculated from a company’s own CRM data using the p90 deal-cycle length rather than default 30-to-90-day settings.
- Select an attribution model appropriate to your cycle length. For B2B SaaS companies with 30–90 day sales cycles and buyers touching four or more channels, U-shaped multi-touch attribution is the most popular model, assigning 40% credit to the first touch, 40% to the last touch, and 20% to middle touchpoints.
- Implement offline conversion imports and push CRM lifecycle stage transitions, including MQL, SQL, Opportunity Created, and Closed Won, back to Google Ads and LinkedIn via their respective offline conversion APIs. These CRM-verified events become your primary conversions, as defined in the Prerequisites section, which ensures the bidding algorithm optimizes toward qualified buyers rather than form fills.
- Build the variance table below, comparing platform-reported conversions against CRM-deduplicated conversions for the same period.
The variance table below shows the structure for comparing platform-reported conversions against CRM-deduplicated conversions. For each channel, calculate the variance as (Platform-Reported Conversions minus CRM-Deduplicated SQLs) divided by CRM-Deduplicated SQLs, then multiply by 100%.
Research summarized earlier in the introduction shows that running platform reports side-by-side without reconciliation often produces a 2–4× overcount. Additional studies show that switching from last-click to multi-touch typically reveals paid search overvaluation of 40–65%, and that retargeting incremental ROAS is often 65–85% lower than platform-reported figures.
| Channel | Platform-Reported Conversions (Last 90 Days) | CRM-Deduplicated SQLs (Last 90 Days) | Variance (%) |
|---|---|---|---|
| Google Ads | [Your platform dashboard figure] | [Your CRM SQL count with gclid] | [Calculate: (Platform − CRM) / CRM × 100%] |
| LinkedIn Ads | [Your platform dashboard figure] | [Your CRM SQL count with li_fat_id] | [Calculate: (Platform − CRM) / CRM × 100%] |
| Meta Ads | [Your platform dashboard figure] | [Your CRM SQL count with fbclid] | [Calculate: (Platform − CRM) / CRM × 100%] |
B2B SaaS example: One B2B SaaS company reallocated its marketing budget using U-shaped attribution and achieved a significant increase in conversions along with a reduction in cost per acquisition while holding spend flat.
Common mistake: Many teams use the same attribution window for all channels. Meta defaults to a 7-day click plus 1-day view attribution window, Google uses last-click by default, LinkedIn counts view-through conversions at a 30-day window, and TikTok defaults to 7-day click plus 1-day view. These differences cause the same conversion to be claimed by multiple platforms simultaneously.
Troubleshooting: When the variance table shows CRM SQLs consistently lower than any single platform’s reported conversions, start with deduplication. Overlapping attribution windows across walled-garden platforms produce systematic double-counting, so the sum of platform-reported conversions almost always exceeds the actual CRM conversion count.
Quality check: A discrepancy rate above 20% between any ad platform and the CRM baseline constitutes a serious data-quality issue. Rates under 10% are generally acceptable, while rates between 10% and 20% warrant investigation of attribution settings and UTM coverage.
Step 5: Incrementality Testing and Data-Quality Gates
Objective: Confirm that observed pipeline lift is caused by ad spend rather than correlated with it and enforce automated data-quality checks that catch instrumentation failures before they corrupt budget decisions.
Actions for Incrementality Testing:
- Choose one business question per test, such as whether branded search spend is incremental or whether LinkedIn awareness campaigns drive pipeline that later converts via Google. Choose a single business question for each incrementality test rather than attempting to answer multiple questions at once.
- Select a geo holdout design for B2B SaaS by splitting DMAs or postcode groups into matched treatment and control sets using at least 12 months of historical data. Holdout sizing commonly ranges from 10% to 20% of addressable revenue for geo tests.
- Run a power analysis before launch to confirm the test can detect the expected lift magnitude. If the test can only detect a 30% lift but 10% is expected, the test is underpowered.
- Run the test for 4–8 weeks plus a cooldown period. Geo-holdout incrementality tests should run for a minimum of 3–6 weeks, with quarterly geo-holdouts by channel as part of an ongoing measurement program.
- Pre-register the success metric, analysis method, and decision rule before launch to prevent mid-flight peeking.
Actions for Data-Quality Gates:
- Run schema validation at ingestion and flag null campaign IDs, spend values outside the range of $0–$1,000,000, and CPC values outside $0.01–$500 before data reaches the reporting layer.
- Run uniqueness checks to ensure transaction IDs and conversion event IDs are unique across the table and treat events with identical user_id, timestamp, and value as duplicates.
- Run a weekly reconciliation workflow comparing ad-platform conversions against CRM entries, with a named owner and a 15% variance threshold that triggers investigation. A weekly reconciliation workflow with a 15% variance threshold prevents discrepancies from compounding over time.
- Verify consent state accuracy and confirm that consent fields and deletion flags remain aligned across HubSpot or Salesforce and the tag management layer after each sync.
B2B SaaS example: A SaaS company running $20,000 per month on LinkedIn pauses LinkedIn ads in two matched DMA markets for six weeks while holding spend in control markets. CRM pipeline creation in holdout markets drops 18% relative to control markets, which confirms LinkedIn’s causal contribution and justifies a budget increase that the variance table alone could not support.
Common mistake: Some teams treat incrementality as a one-time project. Incrementality results should serve as an ongoing input to budget allocation decisions rather than a one-time analysis, with quarterly geo-holdouts by channel, monthly MER versus platform ROAS gap analysis, and annual MMM refreshes.
Troubleshooting: When holdout and treatment markets show no difference in pipeline creation, investigate holdout contamination first. Control users exposed via cross-border retargeting or connected devices represent the primary threat to geo-holdout validity.
Quality check: Incrementality results should reach at least 90% confidence before informing a budget reallocation decision. Across 225 geo-based incrementality tests run between August 2024 and December 2025, the median iROAS was 2.31× and 88.4% of tests reached statistical significance.
Measurement and Validation Benchmarks
Success in this framework is defined by three benchmarks that SaaSHero applies to every client account.
- LTV:CAC at or above 3:1, because a lower ratio means the acquisition channel does not pay for itself at a sustainable rate.
- CAC payback under 12 months, which measures the period within which the gross margin generated by a new customer recovers the cost of acquiring that customer.
- Pipeline created per channel, which becomes the primary operational metric and replaces cost per lead as the optimization target in every board conversation.
The monthly review process runs against the Looker Studio dashboard built in Step 3 and tracks total spend by channel, pipeline created by channel, cost per SQL by channel, and CAC payback trend. The quarterly budget analysis revisits channel allocation against these outcomes instead of relying on the previous quarter’s assumptions.

Three attribution gaps require explicit management because each one distorts the data in a different direction, and ignoring any one of them undermines the entire framework. First, consent limitations reduce the visibility of conversions in platform dashboards. A company’s backend order table or CRM records every sale irrespective of consent status, cookies, or attribution windows and therefore serves as the only reliable denominator for measuring platform-reported conversions. The CRM becomes the truth, while platform dashboards serve as optimization signals only.
Second, walled-garden bias inflates platform-reported conversions through double-counting. Inconsistent ad platform data causes budget misallocation toward channels that over-claim credit, degraded algorithm performance from training on double-counted conversion signals, and eroded stakeholder trust when leadership sees conflicting numbers. Third, dark funnel undercount pulls in the opposite direction. Seventy to eighty percent of the pre-form-fill buyer journey happens in untrackable channels such as Slack DMs, private LinkedIn groups, and podcasts, which causes multi-touch attribution to systematically undercount influence. Together, these three gaps mean no single data source tells the complete story, which is why incrementality testing from Step 5 is the only method that produces genuinely causal evidence.
SaaSHero’s primary and secondary conversion architecture addresses walled-garden bias directly. Secondary conversions remain tracked and visible in reporting but never drive account-wide bidding optimization. The algorithm instead learns from CRM-verified pipeline events rather than raw form fills.
Advanced Variations and Extensions for Mature Teams
Once you have implemented the five-step framework and validated that your LTV:CAC ratio, CAC payback, and pipeline-per-channel metrics meet the benchmarks above, three extensions can further increase measurement precision and optimization effectiveness.
Geo-holdout incrementality by channel: Run quarterly holdout tests on each major channel, including branded search, LinkedIn awareness, and Google Performance Max, on a rotating basis. Feed corrected iROAS results back into the quarterly budget analysis to recalibrate allocation. Corrected incrementality results should be fed back into media mix models to recalibrate budget decisions, with re-testing conducted on a recurring cadence because auction dynamics, competitor behavior, and seasonality change.
Lifecycle-stage pushback into ad platforms: Push CRM lifecycle stage events, including MQL, SQL, Opportunity Created, and Closed Won, back into Google Ads and LinkedIn via offline conversion APIs on a rolling basis. Sending pipeline stage progressions as intermediate conversion signals to Meta and Google allows ad platform algorithms to optimize toward actual buyers weeks or months before deals close in sales cycles longer than 90 days. This mechanism powers SaaSHero’s CRM-connected optimization at the algorithm level, not just the reporting level.
Continuous experimentation tied to quarterly budget analysis: SaaSHero’s Demand Creation Framework and campaign flow map, built in Miro so the client can see where a non-converting visitor goes next, provide the structural backbone for this approach. Each quarter’s budget analysis draws on the incrementality results, the multi-touch variance table, and the A/B test log to produce a channel allocation recommendation with a clear rationale. Mature teams run both MMM and MTA, where MMM sets quarterly budget envelopes while MTA drives daily campaign optimization, with incrementality tests used to reconcile disagreements.
Summary and Next Steps by Maturity Level
The five-step framework in this guide delivers a single CRM-connected source of truth for multi-channel ad performance. Use the implementation checklist below to decide your next moves based on current maturity.
Teams at the start (no CRM-connected attribution):
- Audit and rebuild conversion tracking in Google Tag Manager and establish the primary versus secondary conversion hierarchy immediately.
- Enforce UTM taxonomy with a pre-launch checklist before the next campaign goes live.
- Connect ad platform data and CRM data in a single Looker Studio dashboard within 30 days.
Teams with basic attribution in place:
- Calculate p90 deal-cycle length from CRM data and reset attribution windows to match that length.
- Implement offline conversion imports for MQL and SQL stage transitions.
- Build the platform-reported versus deduplicated variance table and present it at the next board review.
Teams with multi-touch attribution running:
- Design and launch the first geo-holdout incrementality test on the highest-spend channel.
- Push lifecycle-stage events back into ad platforms via offline conversion APIs.
- Connect incrementality results to the quarterly budget analysis cadence.
SaaSHero owns every step in this chain, from campaign execution through CRM-connected measurement, under a single integrated retainer.