

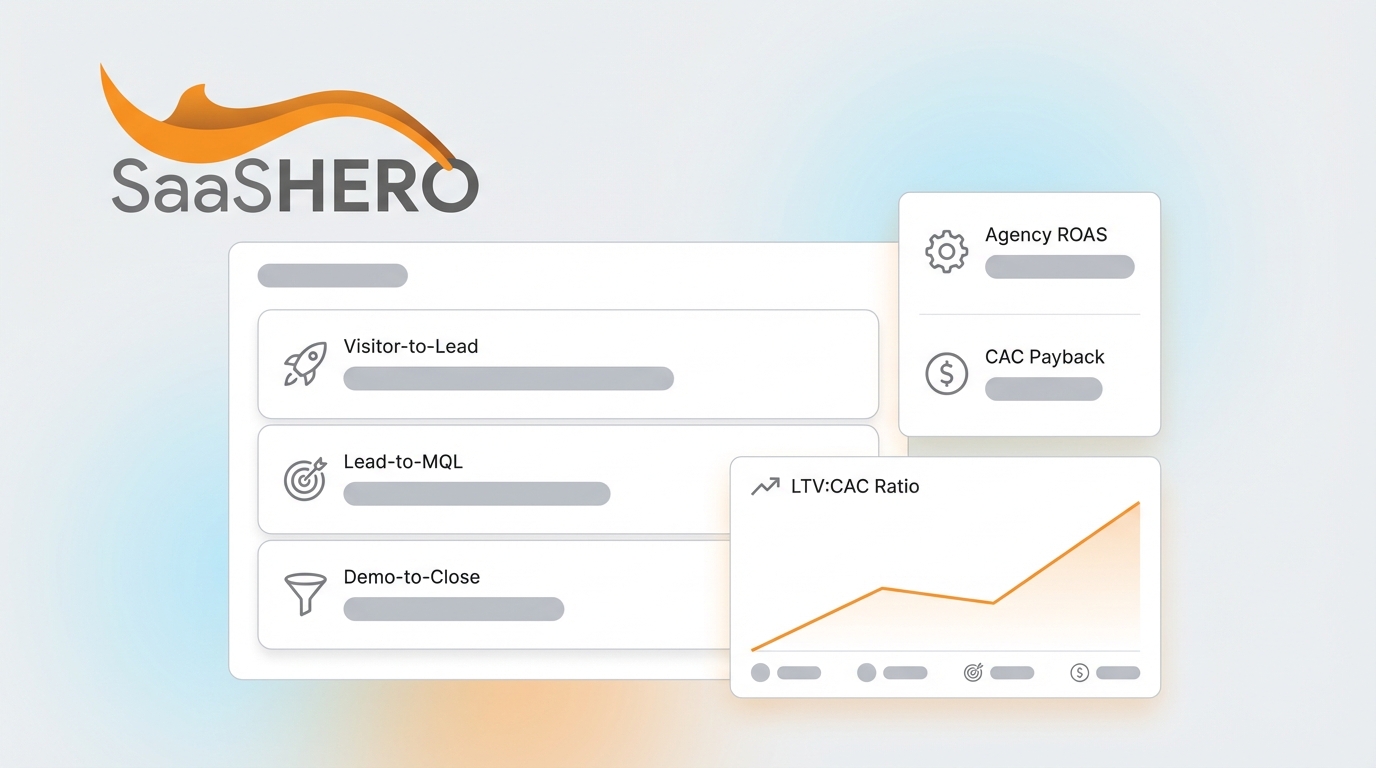
Key Takeaways for 2026 B2B SaaS Growth
- Top B2B SaaS companies reach 8-15% visitor-to-lead conversion, about 7x higher than 1.5-2% industry medians, which drives major ARR gains.
- Agency ROAS should exceed 4x for sustainable growth, while elite partners like SaaSHero deliver 6.5x+ through revenue-aligned campaigns.
- CAC payback under 80 days and LTV:CAC above 4:1 create strong investor appeal in tighter 2026 capital markets.
- PLG models convert about 2.5% of visitors to trials but close fewer deals, while sales-led models close 35% of demos with larger contracts.
- Use the hiring scorecard to audit your agency, then book a discovery call with SaaSHero for a free funnel audit against these benchmarks.
15 Essential 2026 B2B SaaS Benchmarks Across Funnel and Agency Performance
#1: Visitor-to-Lead Conversion Rates That Multiply ARR
Industry average sits at 1.5-2%, while the top 10% of companies achieve 8-15%. This 7x performance gap creates huge ARR differences. A company converting at 10% instead of 2% generates 5x more qualified leads from the same traffic.

|
Performance Tier |
Conversion Rate |
Revenue Impact |
SaaSHero Client Example |
|
Bottom 25% |
<0.7% |
-60% ARR potential |
Pre-optimization baseline |
|
Industry Median |
1.5-2% |
Baseline |
Typical agency performance |
|
Top Quartile |
8-15% |
+400% ARR boost |
TripMaster: 20% conversion from paid search |
#2: Lead-to-MQL Conversion That Signals Lead Quality
Average B2B SaaS lead-to-MQL conversion is 31%, while top performers exceed 50%. This metric exposes both lead quality and nurturing strength. Weak lead scoring inflates top-funnel volume and creates bottlenecks later in the pipeline.
#3: MQL-to-SQL Conversion as the Core Bottleneck
MQL-to-SQL conversion averages just 13%, which makes it the largest funnel choke point in B2B SaaS. Enterprise SaaS reaches 40% MQL-to-SQL with advanced lead scoring. Better qualification nearly triples performance versus the average.
#4: Demo-to-Close Win Rates That Reflect Sales Execution
Average win rates range from 20-30%, with best-in-class reaching 35-40%. Demo quality, sales enablement, and positioning drive most of this spread. Companies with strong product-market fit and tight sales processes regularly exceed 35% close rates.
#5: Agency ROAS Standards for Scalable Growth
B2B SaaS advertising should deliver at least 4x ROAS to support sustainable growth. Agencies below 3x usually suffer from poor targeting, weak creative, or broken campaign structure. SaaSHero consistently delivers about 650% ROI through revenue-focused campaigns.
|
ROAS Tier |
Performance Range |
Spend Efficiency |
Action Required |
|
Underperforming |
<3x |
Poor targeting |
Audit or replace agency |
|
Industry Standard |
3-5x |
Acceptable baseline |
Improve for growth |
|
Top Quartile |
5x+ |
Exceptional efficiency |
Scale investment |
|
SaaSHero Standard |
6.5x+ |
Revenue-aligned model |
Partner for growth |
#6: Cost Per Lead Benchmarks by SaaS Vertical
CPL shifts with industry complexity and deal size. Enterprise software averages $450+ CPL, while SMB tools land around $200-300. HRTech often sees about $250 CPL, while Cybersecurity reaches $450+ because of longer cycles and compliance demands.
#7: CAC Payback Periods That Impress Investors
Healthy CAC payback usually falls between 12 and 18 months, yet top performers reach payback in under 80 days. TestGorilla’s 80-day payback through SaaSHero’s work shows how strong funnel management can accelerate revenue.
#8: LTV:CAC Ratios That Balance Growth and Efficiency
Healthy LTV:CAC ratios sit above 4:1, with excellent performance at 5:1+. Ratios above 7:1 often signal under-investment in growth. This metric balances acquisition efficiency with growth speed and requires accurate attribution.
#9: PLG vs Sales-Led Performance Tradeoffs
PLG models reach higher visitor-to-lead rates through low-friction opt-ins, while sales-led enterprise models show lower top-funnel conversion but stronger close rates and deal sizes. PLG companies convert about 2.5% of visitors to trials, while sales-led teams close about 35% of demos.
|
Sales Model |
Visitor-to-Lead |
Close Rate |
Average Deal Size |
|
PLG |
2.5% |
15-20% |
$2,000-$10,000 |
|
Sales-Led |
1.2% |
35% |
$25,000-$100,000 |
#10: Free Trial to Paid Conversion by SaaS Category
Trial-to-paid conversion varies by vertical: CRM at 29%, Cybersecurity at 21.9%, HR at 22.7%, and Enterprise at 18.6%. These numbers guide expectations and highlight onboarding and activation gaps.
#11: Channel Performance Gaps Across SEO, PPC, and Social
SEO-sourced leads reach 51% MQL-to-SQL conversion versus 26% for PPC, which signals higher intent and better fit. LinkedIn Ads usually deliver about 4x ROAS for B2B SaaS, while Google Ads average around 3.5x.
#12: Net Revenue Retention as a Growth Multiplier
Median NRR sits near 106%, while top performers exceed 120%. High NRR companies grow about 2.5x faster than peers, which shows how strong customer success compounds acquisition work.
#13: AI-Driven Gains in Targeting and Attribution
SaaS companies with deep AI adoption grow about twice as fast as peers, with 70% faster growth in the $1-5M ARR range. AI tools sharpen targeting, improve creative testing, and refine attribution for clear efficiency gains.
#14: Agency Client Retention as a Trust Signal
Top B2B SaaS agencies keep 85-86% of clients, which reflects consistent value. Retention below 80% often points to performance issues or misaligned expectations. Month-to-month contracts keep agencies accountable every single month.
#15: Revenue Per Client as the Agency Quality Filter
Elite agencies generate $250k+ net new ARR per client each year through advanced funnel work and accurate attribution. This metric separates revenue partners from simple lead vendors. SaaSHero’s TripMaster case study shows $504k net new ARR in 12 months, which reflects a true revenue partnership.

PLG models excel at top-funnel volume but need strong onboarding to convert trials. Sales-led models win larger deals but require longer nurturing. Book a discovery call to match your model and growth stage with the right optimization plan.
Agency Hiring Scorecard and Performance Gap Analyzer
This scorecard helps you grade current agency performance and find revenue-aligned partners. Score each item from 1 to 5, where 5 reflects best-in-class results.
|
Performance Criteria |
Score (1-5) |
SaaSHero Standard |
Industry Median |
|
ROAS Performance |
___ |
6.5x+ (5/5) |
3-4x (3/5) |
|
Contract Flexibility |
___ |
Month-to-Month (5/5) |
12-month lock (1/5) |
|
Pricing Model |
___ |
Flat retainer (5/5) |
% of spend (2/5) |
|
Revenue Reporting |
___ |
ARR/Pipeline focus (5/5) |
Vanity metrics (2/5) |
|
B2B SaaS Specialization |
___ |
Exclusive focus (5/5) |
Generalist (2/5) |
|
Senior Team Access |
___ |
Direct strategist (5/5) |
Junior account manager (2/5) |
|
Setup Investment |
___ |
$1-2k one-time (4/5) |
$5k+ or $0 (2/5) |
|
Client Retention Rate |
___ |
High retention (5/5) |
70-80% (3/5) |
|
Attribution Sophistication |
___ |
CRM integration (5/5) |
GA4 only (2/5) |
|
Proven Case Studies |
___ |
$500k+ ARR results (5/5) |
Lead volume claims (2/5) |
Gap Analysis: Scores below 35 out of 50 reveal major performance gaps. Agencies under 25 out of 50 usually drain ARR potential through misaligned incentives and weak execution. SaaSHero typically scores 48-50 out of 50 through revenue-aligned flat retainers, month-to-month terms, and proven $500k+ ARR case studies.

SaaSHero Case Studies That Beat These Benchmarks
These real results show how focused B2B SaaS execution impacts revenue:
- TripMaster: $504,758 net new ARR in 12 months and 650% ROI through competitor conquesting and CRO work.
- TestGorilla: 80-day CAC payback, 5,000+ new customers, and $70M Series A supported by strong unit economics.
- Playvox: 10x decrease in cost per lead and 163% lead volume increase through negative keywords and intent-based targeting.
These outcomes come from SaaSHero’s revenue-first model with flat monthly retainers ($1,250-$7,000), month-to-month contracts, and senior-led strategy. Book a discovery call to get started with a $1,000 setup and full month-to-month flexibility.

Frequently Asked Questions
Good B2B SaaS ROAS Targets for 2026
B2B SaaS teams should aim for at least 4x ROAS, while top performers reach 5-6x returns. ROAS below 3x usually signals poor targeting, weak creative, or broken campaign structure. The key metric is revenue attribution, not just lead counts. Companies reaching 6x+ ROAS usually rely on attribution that connects ad spend to closed-won revenue in their CRM.
Key Differences Between PLG and Sales-Led Benchmarks
PLG models reach higher visitor-to-lead rates, about 2.5% versus 1.2%, because trials feel frictionless. They also see lower close rates, around 15-20% versus 35%, and smaller deal sizes. Sales-led models require more nurturing but bring in higher-value customers. PLG teams should refine onboarding and feature adoption, while sales-led teams should sharpen demo quality and sales enablement. The right choice depends on product complexity, target market, and growth stage.
Core Metrics for Measuring Agency Performance
Revenue-connected metrics matter more than vanity numbers. Focus on CAC payback under 90 days, LTV:CAC above 4:1, and net new ARR. Strong agencies integrate with your CRM and track leads through to closed-won revenue. Monthly reports should show pipeline value, SQL volume, and revenue attribution. Avoid partners who only talk about impressions, clicks, or unqualified leads.
Reasons SaaSHero Outperforms Typical B2B SaaS Agencies
SaaSHero delivers about 650% ROI through revenue-aligned incentives that most agencies lack. Flat monthly retainers remove percentage-of-spend conflicts that reward waste. Month-to-month contracts keep performance accountable. The team focuses only on B2B SaaS across HRTech, FinTech, Cybersecurity, and similar verticals, so they understand churn, MRR, and long sales cycles. Case studies highlight $500k+ ARR gains instead of vague lead volume claims.
Conclusion: Turn Benchmarks Into ARR Growth
These 15 benchmarks and the scorecard give you a clear framework to audit your funnel and agency partners. Companies in the top quartile generate 3-5x more ARR from the same traffic and budget. Specialized expertise, revenue-aligned incentives, and accurate attribution usually create that gap.
Book a discovery call with SaaSHero for a custom audit that compares your metrics to these 2026 benchmarks and uncovers specific ARR growth opportunities.