

Key Takeaways
- B2B SaaS sales cycles now average 6.2 months with falling win rates, often because collateral ignores buyer-specific objections.
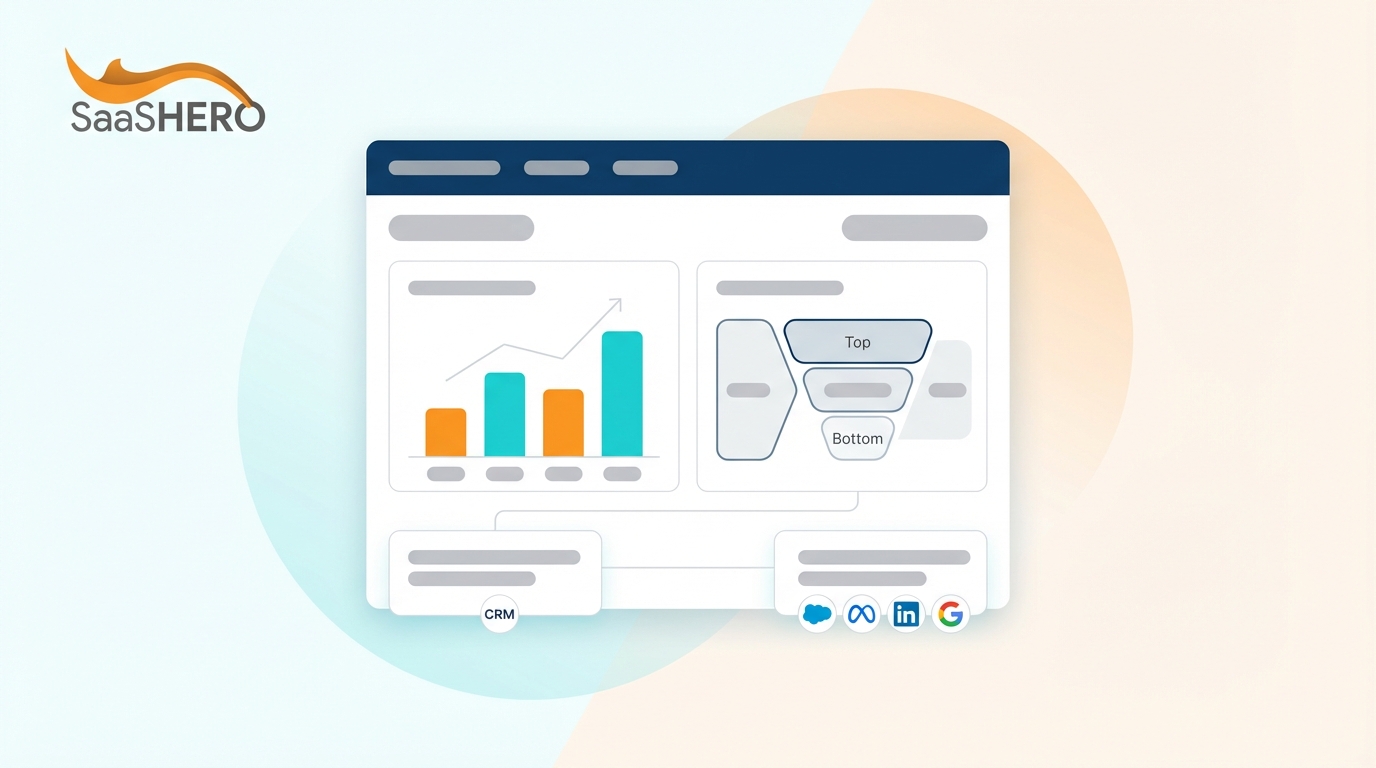
- Use the 7-step framework of ICP mapping, stage-specific assets, ROI data, design, objection handling, A/B testing, and revenue attribution.
- Match collateral to funnel stages: whitepapers for awareness, case studies and ROI calculators for consideration, and battle cards for decisions.
- Include clear ROI metrics, customer proof, and objection-handling frameworks to shorten cycles and increase Net New ARR.
- Set up tracking and centralized distribution, and book a discovery call with SaaSHero for a free collateral assessment and rollout support.
Tools and Context You Need Before You Build
Set up your basic tools before you create high-converting collateral. Use design platforms like Canva or Figma, content hubs like Google Docs or Notion, and sales enablement tools such as HubSpot, Highspot, or Gong for distribution and tracking.
You also need a handle on key SaaS metrics. Focus on ICP pain points, CAC payback periods with a target of 80 days, and dark funnel behavior where buyers research on their own before talking to sales. 33% of businesses now use AI to build marketing and sales collateral, which makes 2026 a turning point for AI-driven personalization.
Plan 1 to 2 weeks for initial collateral builds, then keep running A/B tests. Misaligned collateral creates the biggest risk, as 58% of SaaS firms report longer sales cycles when materials do not match buyer intent or stage.
7-Step Framework That Connects Collateral to ARR
This 7-step framework keeps every asset tied to revenue outcomes instead of vanity metrics.
- ICP and Journey Mapping, so you identify high-intent phases and specific pain points
- Collateral Types by Stage, so each asset format fits its funnel position
- ROI Data Integration, so every piece shows measurable business value
- Visual and Heuristic Design, so design supports conversion and clarity
- Copy and Objection Handling, so you answer real concerns with proof
- Centralization and A/B Testing, so you test and distribute at scale
- Measurement and Attribution, so you track impact on pipeline and ARR
|
Funnel Stage |
Primary Collateral |
Key Metrics |
ARR Impact |
|
Awareness |
Whitepapers, Industry Reports |
Download Rate, Email Capture |
Pipeline Influence |
|
Consideration |
Case Studies, ROI Calculators |
Engagement Time, Share Rate |
Deal Velocity |
|
Decision |
Battle Cards, Comparison Sheets |
Close Rate, Cycle Length |
Net New ARR |
Step 1: Map ICPs to Real Buying Journeys
Start by mapping your Ideal Customer Profile to each phase of the buying journey. Capture pain points, budget limits, and decision paths for every stakeholder involved.
Build detailed personas for technical users, economic buyers, and internal champions. Document preferred formats, how they consume information, and their most common objections. Use Gong or Chorus call recordings to surface recurring themes from real conversations.
Analyze competitor positioning and pricing so you know exactly where prospects compare alternatives. ABM strategies boost average deal value by 171% and shorten sales cycles by 40% when collateral speaks to specific accounts instead of generic markets.
Avoid the common mistake of writing from your internal perspective. Validate key messages with customers and prospects before you finalize any major asset.
Step 2: Match Collateral Types to Funnel Stages
Align each collateral format with a clear buyer stage and sales need. Early-stage prospects want education that builds trust. Mid-funnel buyers want proof and differentiation. Late-stage evaluators want detail and ROI clarity.
For awareness, ship thought leadership whitepapers, benchmark reports, and educational webinars. For consideration, build detailed case studies, comparison guides, and interactive ROI calculators. For decision, focus on battle cards, implementation timelines, and contract support materials.
B2B buyers consume an average of 13 content assets before purchase, so you need a full-funnel library. Add clear next-step calls to action in every asset to move prospects toward a sales conversation.
Equip SDRs with concise, skimmable one-pagers for outbound and follow-up. Give AEs detailed spec sheets and objection frameworks for complex deals. Support Customer Success with onboarding guides and expansion playbooks.
Step 3: Weave ROI Data into Every Asset
Anchor your collateral in quantifiable business value. Replace vague benefit claims with specific metrics for cost savings, efficiency gains, and revenue growth.
Build interactive ROI calculators that accept prospect inputs and show tailored value projections. Offer conservative, realistic, and optimistic scenarios to match different risk profiles across stakeholders.
Highlight customer success metrics in plain language. A line like “TechCorp cut manual work by 40% and saved $200K per year” beats “streamlines operations” every time. Use clear before-and-after comparisons with dates and dollar amounts.

Create value frameworks for each industry. HR tech buyers care about cost per hire and time to productivity. Cybersecurity buyers focus on breach costs and compliance efficiency. Adjust ROI stories to match each vertical’s core metrics.
Step 4: Use Visual Design That Guides Decisions
Design each asset so it pulls attention toward key value points and calls to action. Use a clear visual hierarchy while keeping a polished B2B look.
Apply a simple 5-second test. A prospect should grasp your main value proposition within five seconds of opening any piece. Lead with benefit-focused headlines, use bullets for scanning, and add trust signals such as logos and certifications.
Design for mobile first, since many decision-makers review content on phones. Keep text readable, scale images correctly, and make CTAs easy to tap on any screen.
Use tables and diagrams to simplify complex ideas. Feature matrices, before-and-after visuals, and process flows help buyers understand value and implementation at a glance.
If design capacity feels tight, book a discovery call to review options for design support.

Step 5: Write Copy That Neutralizes Objections
Shape your messaging around the objections you hear most often. Focus on pricing, implementation effort, security, and competitors, then answer each with specific proof.
Build a simple framework for every major objection. For pricing, include TCO comparisons and payback math. For implementation, show timelines, resources, and support. For security, highlight certifications and data protection practices.
Use testimonials and case studies that speak directly to those concerns. A quote like “We worried about integration, but the API docs were clear and we went live in two weeks” carries strong credibility.
Apply a “Switch and Save” narrative for competitive takeaways. Call out pains with the current tool and quantify the gains from switching, backed by real migration stories.
Keep copy scannable with short paragraphs, bullets, and clear subheadings. Put the main benefit in the first sentence of each section so skimmers still get the message.
Step 6: Centralize Assets and Test Systematically
Centralize your collateral so teams can find, use, and track it easily. Use platforms like Highspot, Seismic, or Showpad to organize by journey stage, industry, and use case.
Run structured A/B tests on high-impact assets. Experiment with headlines, value statements, case study choices, and CTA placement. Automated lead scoring improved B2B conversion efficiency by 36% when paired with tuned collateral.
Set up tight feedback loops between sales and marketing. Ask reps which pieces land with prospects and where they feel gaps. Review usage and conversion data to decide what to refine or retire.
Maintain version control so sales never sends outdated pricing or feature comparisons. Old information can stall deals and hurt credibility with informed buyers.
Use automated workflows to send relevant collateral based on behavior, deal stage, and industry. Targeted delivery raises engagement and speeds up progression.
Step 7: Measure Collateral Impact on Revenue
Measure collateral with metrics that tie to revenue, not just clicks. Focus on SQL volume, deal velocity, win rates, and Net New ARR.
Connect your CRM so you can see which assets appear in won deals versus lost ones. Use that data to identify materials that truly influence buying decisions.
Watch how deal velocity shifts when you roll out new collateral. ABM strategies shorten sales cycles by 40% when backed by targeted, account-specific content.
Use tools like Looker Studio or HubSpot Analytics to visualize performance across the funnel. Track open rates, engagement time, shares, and movement to the next stage.
|
Metric |
Benchmark |
Tracking Method |
Revenue Impact |
|
SQL Uplift |
20%+ improvement |
CRM Attribution |
Direct Pipeline |
|
Win Rate Boost |
15%+ increase |
Deal Analysis |
Close Rate |
|
Cycle Reduction |
30-40% shorter |
Stage Duration |
Velocity |
|
ARR Attribution |
Measurable lift |
Revenue Tracking |
Net New Growth |
Advanced Plays for High-Growth Teams
AI-driven personalization engines are used by 69% of e-commerce brands, and B2B SaaS now follows the same path. Use dynamic content blocks that adjust messaging based on behavior, company size, and industry.
Create conquest collateral for competitor renewals. Build migration guides and switching calculators that show clear financial and operational gains from moving to your platform.
Connect collateral to advanced sales enablement analytics. Let the platform recommend the next best asset based on deal traits and past win patterns.
Use short, focused videos for complex demos and testimonials. Video often drives higher engagement than text, especially with technical buyers.
If you want support with these advanced moves, book a discovery call to explore options.

Summary and Practical Next Steps
Effective B2B SaaS collateral aligns buyer stages, specific pain points, and clear value metrics. This 7-step framework keeps your library focused on pipeline velocity and Net New ARR.
Begin with a structured audit of your current assets. Check coverage across the journey, refresh ROI numbers with recent data, and tighten tracking so you can link each piece to revenue.
Prioritize high-impact additions such as competitive battle cards, vertical case studies, and interactive ROI calculators. These assets usually move the needle fastest on deal speed and close rates.
Frequently Asked Questions
How do I measure ROI from sales collateral investments?
Measure collateral ROI by tying assets to deal outcomes in your CRM. Track SQL creation, changes in deal velocity, and win rate shifts for deals that used specific materials versus those that did not. Build attribution models that follow engagement from first view through closed-won revenue. Combine leading indicators such as engagement time and shares with lagging indicators such as pipeline contribution and Net New ARR.
What collateral templates work best for early-stage SaaS startups?
Early-stage teams should focus on a small set of high-impact pieces that build credibility. Create a one-page overview that explains the problem, your solution, and early proof points. Add two or three detailed case studies for key use cases or segments. Build a competitive comparison sheet that shows how you differ from legacy tools. Include a simple ROI calculator that helps prospects estimate value. These assets cover most early sales conversations without overloading a lean team.
How long does it typically take to see results from improved sales collateral?
Most B2B SaaS companies see engagement lift within two to four weeks of launching new collateral. Deal velocity changes usually appear within 30 to 60 days as opportunities move through the pipeline. Win rate and revenue impact often take 60 to 90 days, depending on your average sales cycle. Track performance from day one so you can refine based on data instead of assumptions.
Should I create different collateral for each industry vertical we serve?
Industry-specific collateral usually improves conversion and speed, especially for complex products. Create vertical versions of your core assets that highlight relevant use cases, ROI metrics, and compliance needs. Focus on the two or three verticals with the largest revenue upside instead of spreading efforts too thin. Use testimonials and case studies from each target industry to build trust with similar buyers.
How do I ensure sales teams actually use the collateral I create?
Drive adoption by involving sales early and making access effortless. Run feedback sessions where reps share gaps and ideas from real calls. Use a centralized content system that connects to your CRM so reps can grab assets without leaving their workflow. Track usage and performance to see which pieces help close deals. Train teams on when and how to use each asset, and show clear links between usage and better outcomes.
If you want to turn your collateral into a consistent revenue driver, book a discovery call to review your current library and next steps.