

Key Takeaways
- B2B SaaS companies in 2026 need LinkedIn dashboards that connect ad spend to pipeline, revenue, and unit economics, not just clicks and impressions.
- A funnel-based framework with clear TOFU, MOFU, and BOFU metrics keeps teams aligned on what success looks like at each stage of the buyer journey.
- Integrated data from LinkedIn, web analytics, and CRM systems enables accurate attribution, better optimization decisions, and more capital-efficient growth.
- A structured implementation roadmap, from basic tracking to predictive insights, reduces wasted effort and helps teams avoid common analytics pitfalls.
- SaaSHero helps B2B SaaS teams design, build, and operate LinkedIn analytics and campaign programs that prove pipeline and revenue, not vanity metrics. Schedule a discovery call with SaaSHero.
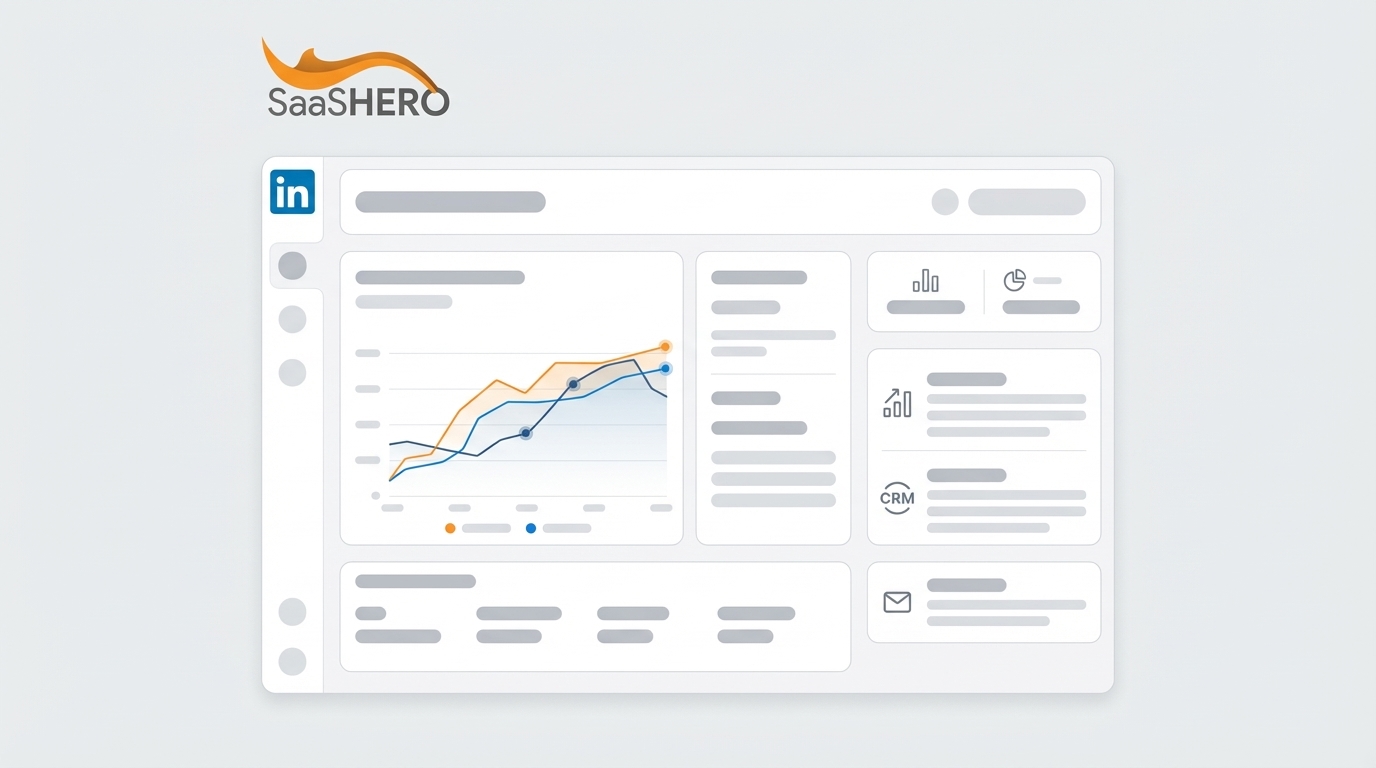
Why Your B2B SaaS Needs a Refined LinkedIn Campaign Management Analytics Dashboard Now
B2B SaaS teams face strict expectations for capital efficiency and clear ROI from LinkedIn. Tighter markets and longer buying cycles require dashboards that link spend to CAC, LTV, and payback period. LinkedIn delivers B2B leads that are 277% more effective than Facebook, so even with higher CPCs it remains a high-priority channel.
Generic ad dashboards usually stop at impressions, clicks, and basic engagement. Effective LinkedIn analytics connect campaigns to CRM data, pipeline, and revenue so teams can optimize budgets based on business impact instead of vanity metrics. This approach turns LinkedIn from an awareness channel into a measurable growth lever.
Core Components of a High-Impact LinkedIn Campaign Analytics Framework
A clear, funnel-based framework keeps your dashboard focused on outcomes that matter across awareness, lead generation, and revenue.
Top-of-Funnel (TOFU): Build Qualified Awareness
TOFU metrics show whether you reach the right people and capture attention.
- Impressions, reach, and frequency for audience exposure
- Click-through rate, often 0.44–0.65% for B2B
- Video views and completion rate for content resonance
- Engagement rate for early interest signals
Middle-of-Funnel (MOFU): Generate and Qualify Leads
MOFU metrics indicate whether campaigns convert interest into qualified leads at a sustainable cost.
- Cost per Lead, with typical B2B ranges of $60–$150, and up to $200 for enterprise
- Lead form submission rate, with LinkedIn Lead Gen Forms often converting at 10–15%
- Lead-to-MQL rate and cost per MQL
- Audience, offer, and message performance by segment
Bottom-of-Funnel (BOFU): Prove Revenue and Unit Economics
BOFU metrics map LinkedIn activity to pipeline, revenue, and long-term value.
- Cost per demo or high-intent conversion
- MQL-to-SQL rate, cost per SQL, and qualified opportunity volume
- Pipeline value and revenue attributed to LinkedIn
- ROAS, CAC, payback period, influenced deal velocity, and LTV
Explore how SaaSHero structures revenue-focused LinkedIn dashboards.
From Vanity Metrics to Verifiable Impact
Modern B2B SaaS marketing has shifted from reporting on clicks to proving revenue impact. The most effective dashboards combine LinkedIn Campaign Manager data with web analytics and CRM records to follow contacts from first impression to closed-won deal. This approach supports decisions that prioritize pipeline and revenue over cheap traffic or low-funnel conversions that never close.
Teams that track CAC, payback, and LTV by campaign gain a clearer view of which audiences, messages, and offers create sustainable growth. This focus helps justify budgets and guides reallocation toward the highest-return segments.
Strategic Decisions When Implementing Your LinkedIn Analytics Dashboard
Strong strategy before implementation reduces rework and ensures your dashboard mirrors how your business grows.
Decide Whether to Build or Buy
In-house builds provide maximum control but require engineering time, data expertise, and ongoing maintenance. Purchased tools or agency-built dashboards accelerate launch and embed tested best practices, but can limit deep customization. Many SaaS companies start with a partner, then internalize parts of the stack as their team matures.
Choose Internal Management or Specialist Support
Internal management works best when teams already understand LinkedIn nuances, reporting, and testing. External specialists add value when internal bandwidth is limited or when performance has plateaued and needs fresh strategy, creative, and analytics thinking.
Select an Attribution Model That Fits B2B Buying Cycles
Single-touch models rarely capture LinkedIn’s role in long, multi-contact journeys. Multi-touch and full-funnel attribution models such as linear, time decay, or W-shaped offer better views of influence across channels. The right choice depends on your deal size, cycle length, and sales process.
Learn how SaaSHero approaches attribution and LinkedIn strategy.
Integrating LinkedIn Data for Full-Funnel Visibility
Integrated data turns a static dashboard into an operating system for growth.
Connect LinkedIn, CRM, and Marketing Automation
High-performing teams sync LinkedIn with platforms such as Salesforce or HubSpot and their marketing automation tools. This setup lets them optimize on SQLs, opportunities, and Net New ARR instead of only on CPC or CTR.
Use A/B Testing and Segmentation for Clarity
Clear experiment design on creative, offers, and audiences shows which variables drive better unit economics. Dashboards that segment performance by ICP, deal size, or vertical make it easier to double down on high-value segments and pause underperforming ones.
Anchor Reporting in SaaS Unit Economics
Dashboards that highlight CAC, LTV, and payback by campaign make it easier to treat LinkedIn spend as an investment. Mapping these metrics to stages and personas improves planning and reduces wasted spend.
Apply AI and Predictive Analytics Where It Matters
AI capabilities such as predictive lead scoring, budget reallocation suggestions, and creative pattern detection can enhance LinkedIn performance. The most useful models forecast lead quality and revenue contribution rather than just clicks or form fills.

Implementing Your Dashboard: Readiness and Operating Model
A phased approach reduces complexity and improves adoption across marketing, sales, and RevOps.
Assess Your Analytics Maturity
Most teams fall into one of three stages:
- Basic reporting that tracks impressions, clicks, and form fills only
- Integrated data that ties LinkedIn to CRM outcomes like SQLs and opportunities
- Predictive insights that use AI to guide budgets and creative choices
Understanding your stage clarifies gaps in tracking, integrations, and cross-team alignment.
Build a Reliable Data Foundation
Clear definitions and clean data keep dashboards trustworthy. This work usually includes:
- Shared taxonomies for campaigns, offers, and lifecycle stages
- Consistent UTMs, LinkedIn Insight Tag, and any required IDs
- Unified pipelines that bring together ad, web, and CRM data
Data quality and consistent benchmarks require clear ownership and documentation.
Follow a Practical Implementation Sequence
A four-phase rollout keeps the work manageable.
- Phase 1, Foundation: Implement UTMs and the LinkedIn Insight Tag, validate basic conversion tracking, and standardize definitions.
- Phase 2, Integration: Connect LinkedIn with CRM and marketing automation, and ensure lead source and campaign fields stay accurate.
- Phase 3, Reporting: Launch dashboards for core funnel metrics such as CPL, MQL-to-SQL rate, and pipeline by campaign.
- Phase 4, Optimization: Add multi-touch attribution, unit economics, and AI-driven insights where data volume supports it.
See how SaaSHero supports each stage of this rollout.
Common Pitfalls in LinkedIn Analytics for Experienced B2B SaaS Teams
Even advanced teams can undermine performance when dashboards reward the wrong behaviors.
Focusing on Engagement Instead of Revenue
Optimizing for clicks, impressions, or CTR, often 0.4–0.6%, without checking pipeline and revenue impact leads to misaligned decisions. Dashboards should make it clear which campaigns generate qualified opportunities and deals.
Allowing Data Silos to Block Attribution
Isolated LinkedIn, web, and CRM data prevents teams from following a prospect from ad view to closed-won. Unified data structures and integrations close this gap and unlock reliable attribution.
Misaligned KPIs Between Marketing and Sales
Marketing goals around lead volume and CPL can conflict with sales targets tied to SQL quality and revenue. Shared definitions for MQL, SQL, and opportunity, sourced directly from the LinkedIn analytics dashboard, help align both teams.
Chasing Low-Cost Leads at the Expense of Quality
Low CPL looks positive on the surface but can mask poor MQL-to-SQL conversion and weak pipeline value. Dashboards that highlight conversion and revenue by source discourage cheap but low-quality lead strategies.
Using Benchmarks Without Context
Public benchmarks can help orient expectations, but benchmarks remain directional and contextual. Effective teams compare performance against peers and also against their own history, ICP, and objectives.
Conclusion: Build a Dashboard That Proves LinkedIn’s Revenue Impact
LinkedIn can be one of the highest-impact channels for B2B SaaS when analytics focus on revenue, not vanity metrics. Dashboards that connect campaigns to pipeline, deals, and unit economics give leaders the confidence to scale budgets responsibly and cut what does not perform.
Next steps for most teams include:
- Assess the current LinkedIn analytics setup and identify gaps in tracking and integrations.
- Define shared KPIs that reflect pipeline, revenue, and payback, not just lead volume.
- Prioritize integrations that create a single view of the customer journey from impression to renewal.

Teams that want expert support can accelerate this journey with a specialist partner. Schedule a discovery call with a SaaSHero B2B SaaS LinkedIn Ads specialist to design a dashboard and operating model that proves pipeline and revenue.