


Key Takeaways
- Pipeline benchmarks only work when segmented by stage, channel, industry, and sales motion, not as broad averages.
- MQL-to-SQL conversion, SQL-to-opportunity, and opportunity-to-close form the core benchmark set for B2B SaaS pipeline health.
- Industry, deal size, and sales motion (sales-led vs. PLG) change what “good” looks like for conversion rates and coverage.
- Internal trends over time matter more than any single external benchmark; consistent measurement and iteration drive improvement.
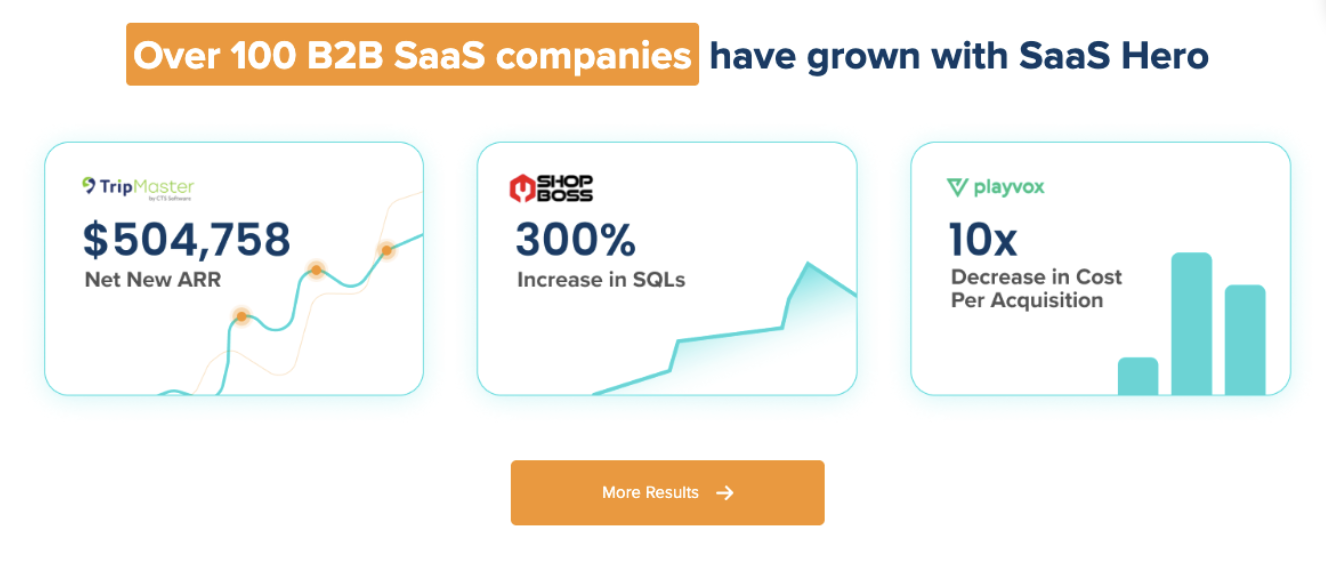
- SaaSHero helps B2B SaaS teams define realistic benchmarks and improve pipeline performance; schedule a discovery call for a tailored assessment.
1. Understanding MQL-to-SQL Conversion Rates: The Foundation of Pipeline Generation
MQL-to-SQL conversion shows how many Marketing Qualified Leads advance to Sales Qualified Leads, which reflects how well marketing delivers leads that sales accepts. This metric anchors pipeline health because it connects top-of-funnel activity to sales-ready demand.
Across B2B SaaS in 2026, average MQL-to-SQL conversion sits around 18–22%, while top-performing teams reach 25–35%. Many teams misread this metric because MQL and SQL definitions differ by company, which can make comparison difficult.
A 10% MQL-to-SQL rate signals issues with lead scoring, ICP definition, or slow sales follow-up. Rates above 35% can signal either strong performance or very narrow MQL criteria that restrict volume.
Actionable strategies:
- Define shared MQL and SQL criteria with sales and document them.
- Align lead scoring with your ICP, intent signals, and buying roles.
- Respond to high-intent MQLs within the first hour to increase conversion probability by up to 7x.
Key metrics to monitor: MQL acceptance rate, time to first contact, and lead score distribution across segments.
2. Channel-Specific Pipeline Generation Benchmarks: Prioritizing High-Quality Demand
Channel source strongly influences conversion rates and deal quality. Segmenting pipeline metrics by channel helps focus budget on sources that generate sales-ready demand.
SEO-driven MQLs convert to SQLs at about 51%, email marketing at 46%, and webinars at 30%, which often outperform paid channels. PPC leads convert from MQL to SQL at roughly 26%, which puts more pressure on targeting and landing page quality.
|
Marketing Channel |
MQL-to-SQL Conversion |
Performance Notes |
|
SEO (Organic) |
~51% |
High-intent, problem-aware visitors |
|
Email Marketing |
~46% |
Nurtured and engaged audiences |
|
Webinars |
~30% |
Consideration-stage education |
|
PPC (Paid Ads) |
~26% |
Relies on precise targeting and messaging |
Optimization strategies:
- Report MQL-to-SQL conversion by channel, campaign, and persona.
- Shift more budget to channels that consistently generate high SQL conversion and healthy deal sizes.
- Improve paid performance with tighter targeting, clear value-focused CTAs, and focused landing pages.
Many B2B SaaS teams now treat organic search, email, and events as their core pipeline engines and use paid as an amplifier once core benchmarks look healthy.
3. Industry-Specific Pipeline Generation Benchmarks: Setting Realistic Targets
Industry vertical changes conversion expectations at every funnel stage. Risk, regulation, and buying processes vary, so a benchmark that looks strong in one sector may be weak in another.
FinTech and healthcare often see longer cycles and lower conversion due to compliance and risk review, while general SaaS buyers typically progress faster. This difference affects required pipeline coverage and sales capacity planning.
CRM tools see visitor-to-lead conversion around 2%, while edtech sits near 1.4%, but edtech often converts leads to MQL at about 46% versus 36% for CRM. Some industries trade volume for quality earlier in the funnel.
Industry-specific considerations:
- Use benchmark data broken out by industry where possible.
- Adjust pipeline coverage and time-to-close targets based on regulatory and procurement complexity.
- Tailor messaging and content to industry-specific pain, compliance needs, and buying committees.
Critical metrics by industry: sales cycle length, win rate by vertical, and conversion blockers tied to risk or compliance reviews.
4. Company Size and Sales Motion: Aligning Benchmarks to SMB, Mid-Market, and Enterprise
Target company size and sales motion change how you interpret funnel benchmarks. SMB, mid-market, and enterprise motions often share similar stage labels but operate very different funnels.
For B2B SaaS in the $10M–$100M ARR range, MQL-to-SQL conversion averages about 39%, and large enterprise vendors above $1B ARR see similar averages. The enterprise motion, however, usually involves more stakeholders and longer evaluation timelines.
Product-led models see free-trial-to-paid conversion around 8–12% on average, which calls for different metrics than a pure sales-led model.
Segmentation strategies:
- Create separate MQL and SQL definitions for SMB, mid-market, and enterprise where needed.
- Set pipeline coverage targets by deal size and sales cycle length.
- For PLG funnels, track visitor-to-trial conversion (about 9% on average, 12–15% at the high end) and activation rates.
Essential metrics by motion: MQL-to-SQL by segment, trial-to-paid for PLG, and average deal size by tier.
5. Comprehensive Funnel Benchmarks: Viewing Pipeline as a System
MQL-to-SQL is only one part of the story. Measuring each stage of the funnel gives a clearer view of where pipeline slows or leaks.
For many small to mid-sized B2B SaaS teams, SQL-to-opportunity conversion averages around 42%, and opportunity-to-close averages around 39%. These metrics help distinguish lead quality issues from sales process issues.
Balanced motions expect marketing-sourced pipeline to contribute about 30–50% of total pipeline. Lead-to-customer conversion often lands between 1–5%, with performance above 5% considered strong.
Holistic funnel practices:
- Document clear stage definitions from first touch to closed-won.
- Monitor stage-to-stage conversion and cycle time to spot bottlenecks.
- Keep CRM stages clean so reports and benchmarks match reality.
Comprehensive metrics: stage conversion, average sales cycle, and pipeline velocity by channel and segment.
6. Optimizing Pipeline Generation with ICP Alignment and Predictive Scoring
Strong pipeline generation depends on how precisely you define and prioritize your Ideal Customer Profile. Data-driven scoring helps focus sales effort on the accounts most likely to become customers.
ICP alignment has a direct impact on MQL-to-SQL conversion, and many teams now use AI-based scoring to prioritize high-intent accounts that match their ICP. These models often combine demographic, firmographic, behavioral, and intent signals.
Advanced optimization tactics:
- Define ICP using closed-won analysis and revisit it as markets and product lines evolve.
- Combine explicit signals such as industry and company size with implicit signals such as website behavior and content engagement.
- Use predictive tools to rank leads and accounts for outreach priority and routing.
SaaSHero supports teams with ICP development, scoring design, and reporting so revenue leaders can connect strategy, data, and daily execution.

7. Continuous Improvement for Pipeline Generation: Building Internal Benchmarks
External benchmarks show where you stand in the market, but internal trends show whether your strategy works. Consistent tracking, testing, and review turn pipeline into a repeatable system.
Many revenue teams now use external benchmarks mainly as reference points and focus day to day on improving their own numbers over time. Internal “best to date” performance becomes the standard to beat.
Systematic improvement framework:
- Review pipeline data on a weekly tactical cadence, a monthly strategic review, and a quarterly benchmark check.
- Run structured A/B tests on landing pages, email sequences, ad creative, and sales messaging.
- Maintain feedback loops among marketing, sales, and product so insights from each stage inform the others.
Internal optimization metrics: period-over-period improvement in key conversion rates, test win rates, and cohort performance by source and segment.

Frequently Asked Questions About Pipeline Generation Benchmarks
How often should we review our pipeline generation benchmarks?
Quarterly reviews work well for high-level benchmark comparison and strategic adjustments because they capture seasonality and provide enough data. Weekly or bi-weekly reviews of channel and stage metrics support tactical optimization of budget, campaigns, and follow-up processes.
What is the biggest mistake B2B SaaS companies make with pipeline benchmarks?
The most common mistake is using a single benchmark for all situations instead of segmenting by industry, company size, channel, and motion. A FinTech vendor that faces strict regulation and long sales cycles will not see the same conversion pattern as a horizontal SaaS tool with shorter evaluations, even at similar ACVs.
Can small SaaS companies effectively use industry pipeline benchmarks?
Smaller teams can use benchmarks as directional guides rather than hard targets. Establishing a clear internal baseline, then improving one or two core metrics at a time, often delivers more value than chasing volume targets that match much larger peers.
How important is sales and marketing alignment for improving MQL-to-SQL conversion?
Alignment is critical because marketing and sales share responsibility for MQL-to-SQL performance. Shared ICP definitions, agreed lead criteria, swift follow-up, and structured feedback on lead quality usually lead to higher acceptance rates and more efficient pipeline progression.
Should we prioritize improving conversion rates or increasing lead volume?
Most teams see stronger ROI when they improve conversion before scaling volume. If MQL-to-SQL or later-stage conversion falls below relevant benchmarks, focusing on lead quality, scoring, and sales process usually generates more revenue per dollar than simply spending more on acquisition.
Teams that want outside perspective on benchmarks and funnel health can work with SaaSHero on a tailored review; book a strategy session to pressure-test your pipeline data and plans.
Conclusion: Turning Benchmarks into Predictable B2B SaaS Revenue
B2B SaaS leaders in 2026 need benchmarks that match their reality, not generic averages. Segmenting metrics by stage, channel, industry, and sales motion makes forecasts more accurate and highlights the areas where focused work will move the needle most.
The seven areas in this guide form a practical framework: MQL-to-SQL fundamentals, channel-by-channel performance, industry context, size and motion alignment, full-funnel visibility, ICP and scoring, and continuous improvement. Together, these practices help build a pipeline that is measurable, adjustable, and easier to predict.
SaaSHero partners with B2B SaaS teams that want clear benchmarks, cleaner data, and better pipeline performance. Schedule a discovery call to align your benchmarks with your market and build a pipeline plan for the next stage of growth.