Written by: Aaron Rovner, Founder, Saas Hero | Last updated: August 21, 2026
Key Takeaways
Closed-loop tracking connects demand-gen spend to closed-won pipeline, CAC, and payback period, replacing vanity metrics with revenue numbers finance trusts.
The four-step framework (Define Revenue Metrics, Wire the Measurement Stack, Choose Attribution Models, Establish Review Cadences) keeps every implementation decision in sequence.
Standardizing UTM parameters, capturing GCLID and GA4 Client IDs, and sending closed-won events back to GA4 via Measurement Protocol closes the largest gaps between ad-platform and CRM data.
W-shaped attribution, validated by self-reported attribution and aligned to the median sales cycle length, reduces last-click bias and properly credits early-stage channels like LinkedIn.
Book a discovery call with SaaS Hero to audit your tracking setup and build a measurement stack that produces reproducible CAC, payback period, and pipeline-to-spend metrics.
The Four-Step Revenue Measurement Framework
This framework organizes every implementation decision into four sequential phases.
Define Revenue Metrics
Wire the Measurement Stack
Choose Attribution Models
Establish Review Cadences
Each step builds on the last. Skipping ahead, such as wiring tools before agreeing on metric definitions, often creates dashboards that look complete but produce numbers marketing and finance dispute.
Step 1: Define Revenue Metrics Everyone Can Reproduce
The goal in this step is a shared metric dictionary before any platform settings change. Without this agreement, every downstream report becomes a debate.
Anchor to marketing-sourced pipeline. Marketing-sourced pipeline is the subset of sales pipeline where the first meaningful engagement originated from a marketing activity before any sales outreach occurred. Set an Opportunity Source field in your CRM at creation time and lock it. Keep that value fixed even when sales re-engages the account later.
Define CAC and payback period from that pipeline. CAC equals total demand-gen spend divided by new customers acquired in the same period. Payback period equals CAC divided by average monthly gross margin per customer. Aim for a payback period under 90 days and a pipeline-to-spend ratio above 3:1.
Document every definition in a shared wiki. Marketing, sales, and finance should sign off on the same definitions before any dashboard work begins. Schedule a 60-minute alignment meeting, capture decisions in writing, and share the recording.
Common Mistake: Vanity Metric Substitution MQLs from content downloads usually convert at much lower rates to revenue, while inbound demo requests convert at substantially higher rates. Reporting MQL volume as the primary KPI inflates perceived program health. Replace MQL count with pipeline influenced and cost per opportunity as your primary executive metrics.
Quality-check prompt: Confirm that your finance team can independently reproduce your CAC figure from CRM data alone without asking marketing for a spreadsheet.
Step 2: Wire a Click-to-Revenue Measurement Stack
This step creates a single, unbroken data chain from ad click to closed-won revenue. Every gap in this chain introduces discrepancies between ad-platform reports and CRM reality.
Standardize UTM naming conventions as the base layer. Create a shared UTM taxonomy covering source, medium, campaign, content, and term. Apply it to every paid URL across Google Ads, LinkedIn Ads, and other active channels. Inconsistent naming is the leading cause of unattributed pipeline in HubSpot and Salesforce.
Send closed-won events back to GA4 via Measurement Protocol. When an opportunity reaches Closed-Won in your CRM, trigger a server-to-server Measurement Protocol call that passes the deal value and stored GA4 client_id back to GA4. This step turns attribution reports into revenue views instead of simple form-fill counts.
Activate server-side Conversions APIs for deeper optimization. Enable Google Enhanced Conversions and LinkedIn CAPI to send pipeline events such as MQL, SQL, Opportunity, and Closed-Won server-side. Businesses using CRM integration often see stronger campaign performance because bidding algorithms optimize toward real sales outcomes instead of top-of-funnel inquiries.
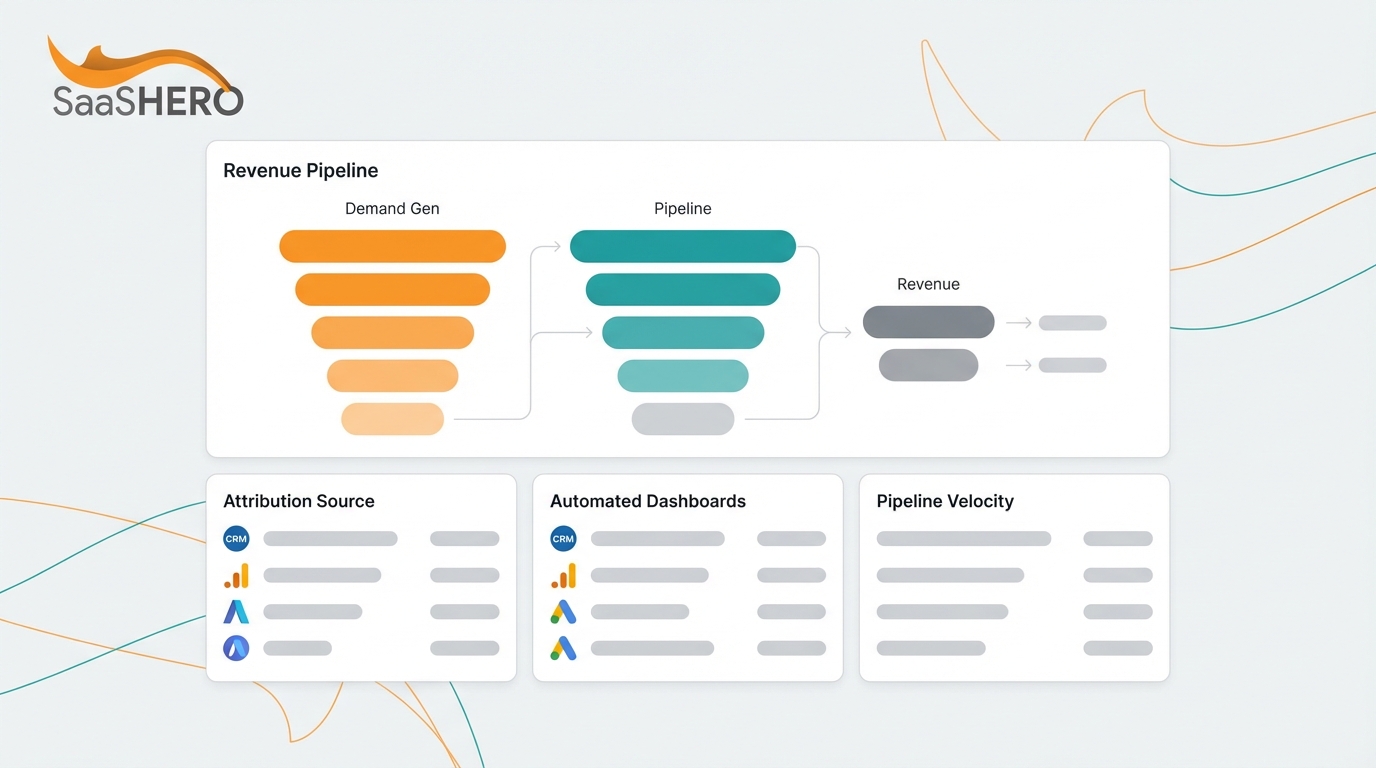
Connect all data sources to a BI layer. Pipe CRM data, ad spend data, and GA4 data into Looker Studio or a data warehouse through tools like Fivetran or Airbyte. Build a single dashboard that shows marketing-sourced pipeline, CAC, payback period, and pipeline-to-spend ratio in one place.
Quality-check prompt: Confirm that a closed-won deal created today appears as revenue in your GA4 attribution report within 24 hours without manual exports.
Step 3: Choose Attribution Models That Match Your Sales Cycle
This step selects a primary attribution model that reflects your sales cycle and funnel structure, then adds validation methods for channels the primary model undervalues.
Remove last-click as your primary model. Last-click attribution usually undercredits LinkedIn in B2B SaaS because LinkedIn rarely provides the final click and instead drives early-stage engagement. Last-click reporting defunds awareness programs and inflates the apparent value of branded search.
Use W-shaped attribution as the main reporting layer. W-shaped attribution fits most B2B SaaS companies with defined funnel stages. It assigns roughly 30% credit each to first touch, lead conversion, and opportunity creation, with the remaining 10% spread across other interactions. Both Marketo and HubSpot include W-shaped logic natively.
Add data-driven attribution once volume supports it. Data-driven attribution works as a validation layer when deal volume is high enough. Below that threshold, the model tends to overfit noise. Teams closing fewer deals annually usually get more reliable guidance from W-shaped models.
Layer in self-reported attribution as a dark-funnel check. Place a plain-text “How did you first hear about us?” field on every demo request form. Self-reported attribution often surfaces channels such as podcasts, communities, founder content, and peer referrals that multi-touch models undercount.
Match attribution windows to your median sales cycle. B2B enterprise deals typically average 3–6 months and mid-market deals 1–4 months. Set attribution windows to the median sales cycle length instead of default 30- or 90-day windows in GA4 and ad platforms. Extend LinkedIn click-through windows to 30–90 days in LinkedIn Campaign Manager.
Common Mistake: Last-Click Reliance in Executive Reporting Multi-touch attribution adoption reached 47% in 2026 (up from 31% in 2023) per synthesized reports including HubSpot data. Single-touch models cause teams to cut LinkedIn and content budgets that are actively seeding pipeline, then watch pipeline drop 90 days later.
Quality-check prompt: Confirm that your current attribution model assigns some credit to a LinkedIn ad a prospect clicked four months before booking a demo.
Step 4: Establish Review Cadences That Keep Data Honest
This step creates a rhythm of structured reviews that catch data drift, validate model accuracy, and connect marketing decisions to revenue outcomes on a predictable schedule.
Weekly: Verify tracking integrity. Compare ad-platform conversion counts to CRM lead counts for the prior seven days and flag any discrepancy above 15%. Confirm that UTM parameters populate on new leads and that GCLID fields are not blank on paid leads.
Monthly: Review pipeline-to-spend ratio and CAC. Pull marketing-sourced pipeline created in the month, divide by total demand-gen spend, and compare to the 3:1 target. Calculate CAC and payback period. Reuse the Forrester benchmarks mentioned earlier as a reference point for win rate and pipeline coverage.
Quarterly: Audit attribution model accuracy. Compare self-reported attribution responses to W-shaped model outputs. Identify channels where the two differ by more than 20 percentage points and adjust budget allocation. Recheck that attribution windows still match your current median sales cycle length.
Quarterly: Present an executive-ready revenue report. Include marketing-sourced pipeline, CAC, payback period, pipeline-to-spend ratio, and win rate. Ensure every figure is reproducible from CRM data. Target a payback period under 90 days, a pipeline-to-spend ratio above 3:1, and less than 5% discrepancy between ad-platform and CRM revenue figures.
Advanced Variations for Mature Revenue Teams
Once the core four-step system is stable and producing consistent weekly reports, two extensions can deepen your measurement, provided foundational tracking remains reliable.
Early-stage (0–3 items checked): Start with Step 1 and lock metric definitions before changing any platform settings. Consider a senior-led partner to build the stack correctly from the beginning instead of inheriting a broken foundation.
Mid-stage (4–7 items checked): Prioritize GCLID capture and Measurement Protocol setup. These two improvements usually close the largest share of the discrepancy between ad-platform and CRM revenue figures and prepare you to move into advanced variations once discrepancies stabilize.
Advanced (8–10 items checked): Move to ABM account scoring integration and incrementality testing. Validate your W-shaped model against self-reported attribution quarterly and adopt data-driven attribution once annual closed-won volume exceeds roughly 500 deals.
Frequently Asked Questions
How long does it take to build a closed-loop tracking system from scratch?
A functional closed-loop system covering UTM capture, GCLID storage, GA4 Client ID passing, and Measurement Protocol closed-won events usually takes several weeks to implement when admin access to all platforms is available from day one. Internal alignment on metric definitions often creates the longest delay and can add two to four weeks if marketing, sales, and finance have not already agreed on a shared conversion taxonomy. A senior-led partner with existing CRM and ad-platform integrations can compress the technical build to two to three weeks while alignment work happens in parallel.
Which team roles are required to maintain this measurement stack?
Ongoing maintenance typically involves three functional roles. A marketing operations owner monitors weekly tracking integrity and manages UTM governance. A RevOps or CRM administrator maintains field mappings and triggers closed-won event workflows. A BI or analytics owner maintains the Looker Studio dashboard and runs quarterly attribution audits. At smaller companies, one person may cover two of these roles, but no single role should own both the data and the reporting that evaluates their own channel performance.
Can a smaller team with limited budget implement this system?
Smaller teams can implement this system with tight prioritization. Teams with budgets under $10,000 per month in ad spend should focus first on UTM standardization, GCLID capture in the CRM, and a self-reported attribution field on demo forms. These three steps close most of the visibility gap at near-zero incremental cost. The Measurement Protocol integration and BI layer can follow once foundational data is clean. HubSpot's native W-shaped attribution and Google Ads' offline conversion import handle most attribution logic without a separate attribution platform.
What causes large discrepancies between ad-platform and CRM revenue figures, and how are they fixed?
The four most common causes include missing UTM parameters on paid URLs, GCLID fields that are not mapped through lead conversion in Salesforce, attribution windows shorter than the actual sales cycle, and double-counted conversions from both pixel and server-side tracking firing at the same time. The diagnostic process starts with a weekly comparison of ad-platform conversion counts to CRM lead counts for the same period. As noted in Step 2, discrepancies above 40% usually signal a structural break, often a GCLID mapping issue in Salesforce or a UTM parameter stripped by a redirect. Fix the data foundation before adjusting any campaign settings because optimizing on broken data produces worse outcomes than holding spend steady.
How does SaaS Hero's model differ from a standard agency engagement for this type of work?
SaaS Hero operates on a flat monthly retainer with no percentage-of-spend billing and no long-term lock-in contracts. Every engagement is month-to-month, so the team must re-earn the client's business every 30 days. The measurement stack, including executive-ready dashboards covering CAC, LTV, payback period, Net New ARR, SQLs, and pipeline, is included in every plan instead of sold as an add-on. Senior strategists remain hands-on throughout the engagement rather than handing accounts to junior managers after onboarding. This structure serves VP-level marketers and RevOps leads who need a partner accountable to closed-won revenue, not click volume.
Conclusion
A closed-loop tracking system that connects demand-gen spend to closed-won pipeline, CAC, and payback period gives B2B SaaS revenue leaders the evidence they need to defend budget and direct spend toward channels that produce revenue. The four-step framework (Define Revenue Metrics, Wire the Measurement Stack, Choose Attribution Models, Establish Review Cadences) offers a repeatable implementation path at any maturity level.
SaaS Hero's flat-fee, month-to-month, senior-led model is built to implement and maintain this measurement stack. There are no percentage-of-spend incentives to inflate budgets, no 12-month contracts that protect mediocrity, and no junior handoffs after the sales call. The team that scopes your engagement is the team that builds and runs it.
Includes unlimited revisions as well as custom written copy (from a human, not ChatGPT). We’ll send a first draft in Figma and you can request as many edits as you’d like. We won’t ever activate any landing pages until you give us the final OK