

Written by: Aaron Rovner, Founder, Saas Hero
Key Takeaways
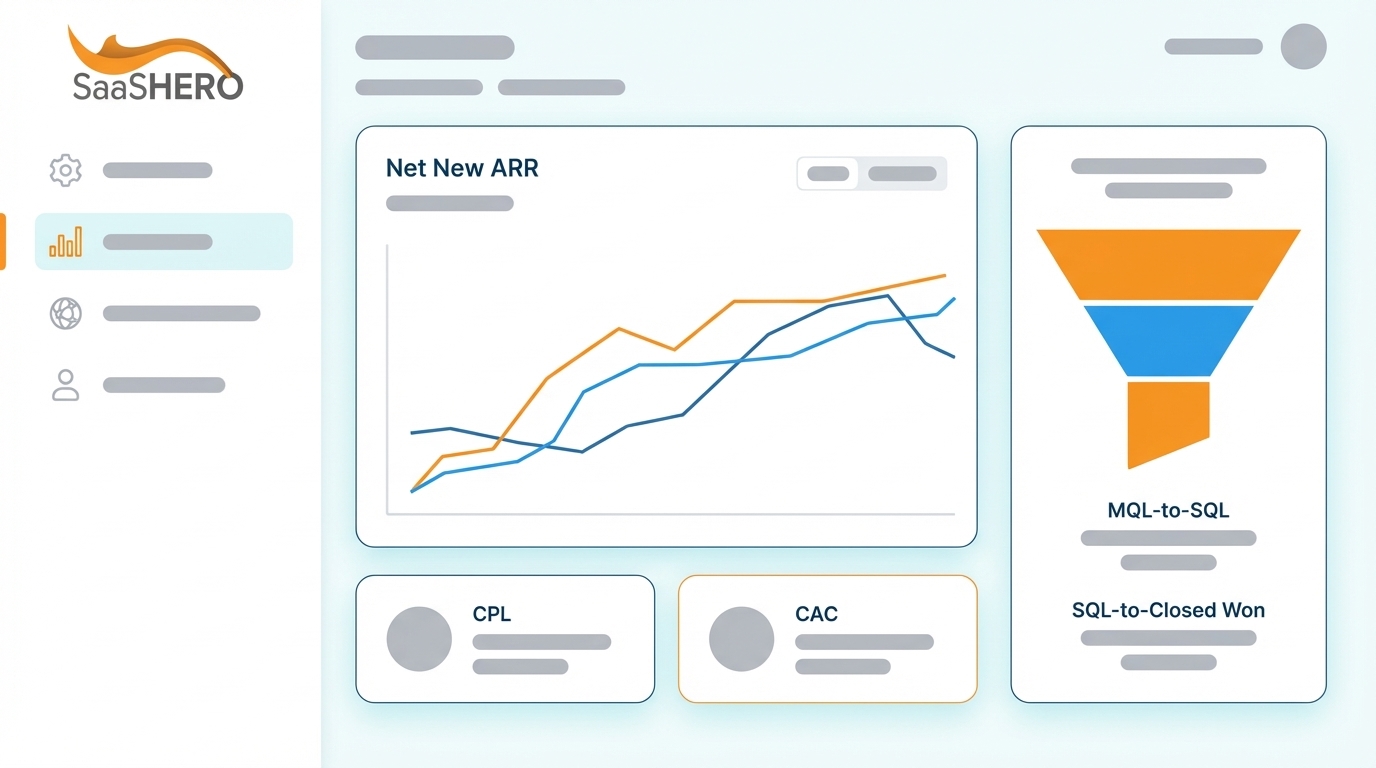
- Track Cost Per Lead (CPL) under $200 for SMBs and $400 for Enterprise to measure how efficiently your marketing generates leads.
- Maintain Lead Velocity Rate (LVR) above 20% month over month to forecast revenue growth and keep pipeline momentum strong.
- Control Customer Acquisition Cost (CAC) with payback periods under 90 days to improve capital efficiency and appeal to investors.
- Increase MQL-to-SQL conversion rates above 15%, with priority on SEO channels that deliver 51% conversion versus 26% for PPC.
- Work with SaaSHero for performance-based lead generation that delivers $504k ARR, and book a discovery call to benchmark your metrics.
1. Cost Per Lead (CPL) Benchmarks You Can Actually Hit
Cost Per Lead shows the average marketing spend required to generate one new lead. Calculate it by dividing total marketing spend by the total number of new leads. Unlike vanity metrics that celebrate high traffic, CPL connects every dollar you spend to real lead generation efficiency. B2B average CPL starts around $200, with high-complexity solutions reaching $300 to $500.
Formula: CPL = Total Marketing Spend ÷ Total Number of New Leads
2026 Benchmarks: Google Ads $200, LinkedIn $350, Email $42
Optimization Strategies:
- Use negative keyword lists to remove navigational and low-intent searches.
- Run competitor conquesting campaigns targeting “[Competitor] pricing” and “[Competitor] alternatives.”
- A/B test landing page headlines and call-to-action placement.
- Shift budget toward high-intent keywords with clear commercial modifiers.
2. Customer Acquisition Cost (CAC) That Supports Growth
Customer Acquisition Cost shows the total sales and marketing expense required to win one new customer. CAC includes marketing spend, sales salaries, tools, and overhead, divided by new customers in a specific period. This metric exposes the real cost of growth and shows whether campaigns generate profit or burn cash.
Formula: CAC = (Total Sales + Marketing Spend) ÷ Number of New Customers
2026 Benchmarks: SMB $250 to $500, Enterprise $500+, with SEO delivering 60% lower CAC than paid channels.
Optimization Strategies:
- Prioritize channels that combine low CAC with strong conversion rates.
- Use lead scoring so sales focuses on high-probability prospects.
- Shorten the sales cycle through tighter lead qualification.
- Track CAC by channel and reallocate budget toward efficient sources.
3. MQL-to-SQL Conversion Rate That Aligns Sales and Marketing
MQL-to-SQL conversion rate shows the percentage of Marketing Qualified Leads that advance to Sales Qualified Lead status. This metric connects marketing and sales performance, revealing lead quality and how well campaigns target the right buyers. Average MQL-to-SQL conversion sits at 13%, and only 25% of marketing leads qualify for direct sales engagement.
Formula: MQL-to-SQL Rate = (Number of SQLs ÷ Number of MQLs) × 100
2026 Benchmarks: 13 to 15% average, with SEO-sourced leads reaching 51% MQL-to-SQL conversion versus 26% for PPC traffic.
Optimization Strategies:
- Refine your ideal customer profile targeting across campaigns.
- Use progressive profiling to collect qualification data over time.
- Build channel-specific lead scoring models.
- Design nurture sequences for MQLs that are not yet ready for sales.
4. Lead Velocity Rate (LVR) for Predictable Pipeline Growth
Lead Velocity Rate tracks month-over-month growth in qualified leads and acts as a leading indicator of future revenue. Calculate LVR as ((Qualified Leads This Month – Qualified Leads Last Month) / Qualified Leads Last Month) × 100. An LVR of 15% or higher signals healthy pipeline momentum for B2B SaaS teams.
Formula: LVR = ((This Month’s Qualified Leads – Last Month’s Qualified Leads) ÷ Last Month’s Qualified Leads) × 100
2026 Benchmarks: 15 to 25% month over month for SMB, 20 to 30% for Enterprise
Optimization Strategies:
- Scale proven campaigns while protecting conversion quality.
- Test new channels that already show strong lead quality.
- Improve landing pages to lift conversion rates.
- Run retargeting campaigns for visitors who engaged but did not convert.
SaaSHero uses revenue-first tracking to turn leads into $504k ARR. Book a discovery call to review detailed case studies.
5. Pipeline Velocity for Faster Revenue Realization
Pipeline velocity shows how quickly leads move from first touch to closed-won deals. This metric blends deal size, conversion rates, and sales cycle length to forecast revenue timing and highlight bottlenecks that slow deals.
Formula: Pipeline Velocity = (Number of Opportunities × Average Deal Size × Win Rate) ÷ Sales Cycle Length
2026 Benchmarks: 60 to 90 day average sales cycle for SMB SaaS, 120 to 180 days for Enterprise
Optimization Strategies:
- Map and remove friction points in the sales process.
- Equip sales teams with competitor battle cards.
- Create urgency with limited-time offers or implementation bonuses.
- Build sales enablement content that answers common objections.
6. SQL-to-Closed Won Rate That Reflects Sales Performance
SQL-to-Closed Won rate measures the percentage of Sales Qualified Leads that become paying customers. This metric reflects both sales execution and the quality of leads that marketing delivers. Benchmarks show SQL-to-Opportunity conversion at 25 to 30% and Opportunity-to-Closed-Won at 6 to 9%.
Formula: SQL-to-Closed Won Rate = (Closed Won Deals ÷ Total SQLs) × 100
2026 Benchmarks: 15 to 25% for well-qualified SQLs
Optimization Strategies:
- Tighten lead qualification criteria to reduce unqualified SQLs.
- Share detailed lead context and behavioral data with sales.
- Route leads based on geographic and vertical expertise.
- Build personalized follow-up sequences tailored to lead source.
7. LTV:CAC Ratio for Long-Term Profitability
The Lifetime Value to Customer Acquisition Cost ratio compares total revenue from a customer over their lifespan to the cost of acquiring them. Benchmarks show Early-Stage at 2:1 to 3:1, Growth-Stage at 3:1 or higher, and Enterprise at 4:1 or higher.
Formula: LTV:CAC = Customer Lifetime Value ÷ Customer Acquisition Cost
2026 Benchmarks: 3:1 minimum for sustainable growth, 5:1 or higher for mature SaaS
Optimization Strategies:
- Concentrate acquisition spend on high-LTV customer segments.
- Launch onboarding programs that reduce early churn.
- Develop expansion revenue plays for existing customers.
- Refine pricing tiers to increase customer lifetime value.
8. Payback Period Targets for Capital-Efficient Scaling
Payback period shows how long it takes to recover customer acquisition costs through gross margin. With investors demanding efficiency, payback periods under 90 days now influence funding and valuation. This metric clarifies cash flow needs and growth sustainability.
Formula: Payback Period = CAC ÷ (Monthly Recurring Revenue × Gross Margin %)
2026 Benchmarks: Under 90 days for VC-backed companies, 60 to 80 days for top performers
Optimization Strategies:
- Sell annual contracts with discounts for upfront payment.
- Promote higher-priced plans that offer stronger unit economics.
- Lower CAC through channel mix improvements and better conversion.
- Use usage-based pricing to speed up revenue recognition.
Scale efficiently with SaaSHero’s flat-fee model. Book a discovery call.
9. Net New ARR per Lead for Revenue-Focused Marketing
Net New ARR per Lead shows the average Annual Recurring Revenue generated from each marketing lead. This metric includes expansion, contraction, and churn. It connects marketing activity directly to revenue and supports precise ROI analysis for every campaign.
Formula: Net New ARR per Lead = Total Net New ARR ÷ Total Number of Leads
2026 Benchmarks: $500 to $2,000 for SMB SaaS, $2,000 to $10,000 for Enterprise
Optimization Strategies:
- Target enterprise segments with larger contract values.
- Use account-based marketing for high-value prospects.
- Design expansion programs for current customers.
- Focus on industries with lower churn and higher LTV.
10. Channel ROAS for Smarter Budget Allocation
Channel ROAS shows how much revenue each advertising dollar generates by channel. LinkedIn delivers 113% ROI compared to Google Ads at 78% for B2B SaaS, while SEO delivers 702% average ROI with a seven-month break-even time.
Formula: Channel ROAS = Revenue Attributed to Channel ÷ Channel Ad Spend
2026 Benchmarks: 3:1 minimum for paid channels, 7:1 or higher for organic channels
Optimization Strategies:
- Shift budget toward channels with the strongest ROAS.
- Use multi-touch attribution to credit assist channels accurately.
- Test new channels with small pilot budgets before scaling.
- Refresh creative and targeting for underperforming channels.
2026 SaaS Lead Gen Benchmarks and Playbook
|
Metric |
SMB Target |
Enterprise Target |
Minimum ROAS |
|
Cost Per Lead |
<$200 |
<$400 |
3:1 |
|
CAC Payback |
<90 days |
<120 days |
N/A |
|
LVR Growth |
>20% MoM |
>25% MoM |
N/A |
|
Pipeline Velocity |
60-90 days |
120-180 days |
N/A |
Tracking Implementation Across Your Stack
Connect HubSpot or Salesforce with Google Analytics 4 and your ad platforms. Use UTM parameters and GCLID tracking to follow ad clicks through the full customer journey. Configure custom conversion events for each funnel stage so attribution reports stay accurate.
A/B Testing Framework for Continuous Gains
Test landing page headlines, call-to-action buttons, form fields, and value propositions. Run tests until you reach 95% statistical confidence. Prioritize experiments that improve conversion rates and directly lower CPL and CAC.

Channel-Specific Optimization Tactics
Google Ads: Run competitor conquesting campaigns, build negative keyword lists, and refine ad schedules. LinkedIn: Target specific job titles and company sizes with sponsored content and lead gen forms. SEO: Publish comparison pages and buyer-intent content that targets commercial keywords.
Top 5 SaaS Lead Gen Metrics to Watch First
|
Priority |
Metric |
Why Critical |
Target Range |
|
1 |
Cost Per Lead |
Direct spend efficiency |
$150-400 |
|
2 |
CAC Payback Period |
Cash flow impact |
<90 days |
|
3 |
Lead Velocity Rate |
Growth momentum |
>15% MoM |
|
4 |
Pipeline Velocity |
Revenue timing |
60-180 days |
|
5 |
MQL-to-SQL Rate |
Lead quality |
>15% |
SaaSHero Case Studies with Real Revenue Impact
TripMaster generated $504,758 in Net New ARR with 650% ROI and 20% conversion rates from paid search improvements. Playvox cut Cost Per Lead by 10x while increasing lead volume by 163% through campaign restructuring and negative keyword work. TestGorilla reached an 80-day payback period that supported a $70M Series A raise and added more than 5,000 new customers through efficient lead generation.

Partner with SaaSHero, the performance agency for B2B SaaS that offers month-to-month retainers, senior-led execution, and ARR attribution. Book a discovery call to benchmark your campaigns.

FAQ
2026 B2B SaaS CPL Benchmarks by Channel
Cost per lead varies significantly by channel. Google Ads averages $200, LinkedIn $350, and email marketing $42, while SEO-generated leads cost 60% less than paid channels. High-complexity B2B solutions often see CPLs of $300 to $500, while transactional products sit between $75 and $150. Allocate budget toward channels that deliver the lowest CPL while still maintaining lead quality and strong conversion rates.
CAC Calculation for Lead Generation Campaigns
Customer Acquisition Cost equals total sales and marketing spend divided by new customers acquired. Include ad spend, tools, salaries, sales team costs, and overhead tied to acquisition. Track CAC by channel so you can identify the most efficient sources and shift budget toward channels with lower acquisition costs and higher conversion rates.
Lead Velocity Rate Formula in B2B SaaS
Lead Velocity Rate = ((This Month’s Qualified Leads – Last Month’s Qualified Leads) ÷ Last Month’s Qualified Leads) × 100. This metric acts as a leading indicator of future revenue growth. An LVR of 15% or higher signals healthy pipeline momentum, and consistent growth above 20% month over month shows strong market demand and effective lead generation.
Typical SQL Conversion Rates for SaaS
Average MQL-to-SQL conversion rates range from 13 to 15% across B2B SaaS companies. SEO-sourced leads convert at 51% compared to 26% for PPC traffic, which highlights the quality advantage of organic search. Only 25% of marketing leads qualify for direct sales engagement, so lead scoring and qualification processes play a key role in improving conversion efficiency.
Agency Specializing in Performance-Based SaaS Lead Gen
SaaSHero provides flat-fee retainers starting at $1,250 per month with month-to-month contracts and focuses only on B2B SaaS lead generation. The team delivers senior-led execution, revenue attribution tracking, and results such as $504k Net New ARR for clients. Their performance-based model removes percentage-of-spend conflicts and aligns agency success with your revenue growth.

Conclusion: Lead Gen Metrics That Win 2026
Performance-based lead generation metrics now define B2B SaaS marketing strategy for 2026. Companies that move away from vanity metrics and focus on revenue-driving KPIs strengthen ARR growth and investor confidence.
Top priorities include Cost Per Lead under $200, Lead Velocity Rate above 20% month over month, and CAC payback periods under 90 days. These metrics create a solid base for sustainable, capital-efficient growth in a crowded market.
SaaSHero scales B2B SaaS lead generation with proven playbooks and transparent pricing. Book a discovery call for $1,250 per month performance-based lead generation today.