

Written by: Aaron Rovner, Founder, Saas Hero
Key Takeaways
- B2B SaaS companies can reach 20%+ overall funnel conversion by improving each stage against the 2026 benchmarks outlined below.
- Calculate stage-specific rates with (Conversions ÷ Stage Entries) × 100 and track Net New ARR to expose bottlenecks like the common MQL-to-SQL gap.
- TOFU performance improves when you run competitor conquest campaigns, build high-intent landing pages, and pass the 5-second value test, as shown in the TripMaster case.
- MOFU and BOFU gains come from personalized nurturing, lead scoring, transparent pricing, and friction reduction that support 42%+ MQL-to-SQL and 45%+ close rates.
- Apply heuristic CRO audits for instant fixes and partner with SaaSHero for expert funnel work, then schedule your personalized audit and roadmap session to uncover your highest-impact opportunities.
B2B SaaS Funnel Conversion Benchmarks 2026
Benchmarking each funnel stage against current data shows where you are losing revenue. Current B2B SaaS conversion data shows significant performance gaps between average and high-performing companies. The table below highlights that the MQL-to-SQL stage usually has the widest gap between typical and top performers, which makes it the strongest opportunity for most teams.
| Funnel Stage | Typical Rate | 2026 Benchmark | Top Performers |
|---|---|---|---|
| Visitor-to-Lead | 1-2% | 2-5% | 10%+ *(e.g., SaaSHero TripMaster: 20% paid search conv. rate)* |
| Lead-to-MQL | 25-31% | 40-50% | 55%+ |
| MQL-to-SQL | 13-20% | 25-35% | 42%+ |
| SQL-to-Close | 22-25% | 30-38% | 45%+ |
The MQL-to-SQL stage represents the biggest bottleneck for most B2B SaaS companies. SEO-sourced leads convert at 51% MQL-to-SQL rates versus only 26% for PPC leads, which shows how much intent-driven traffic sources matter.
Calculate your current performance using this formula: (Stage Conversions ÷ Stage Entries) × 100. For example, if 1,000 visitors generate 30 leads, your visitor-to-lead rate is 3%. Companies in the TripMaster case study improved each stage systematically rather than chasing volume alone, which produced $504k in Net New ARR.

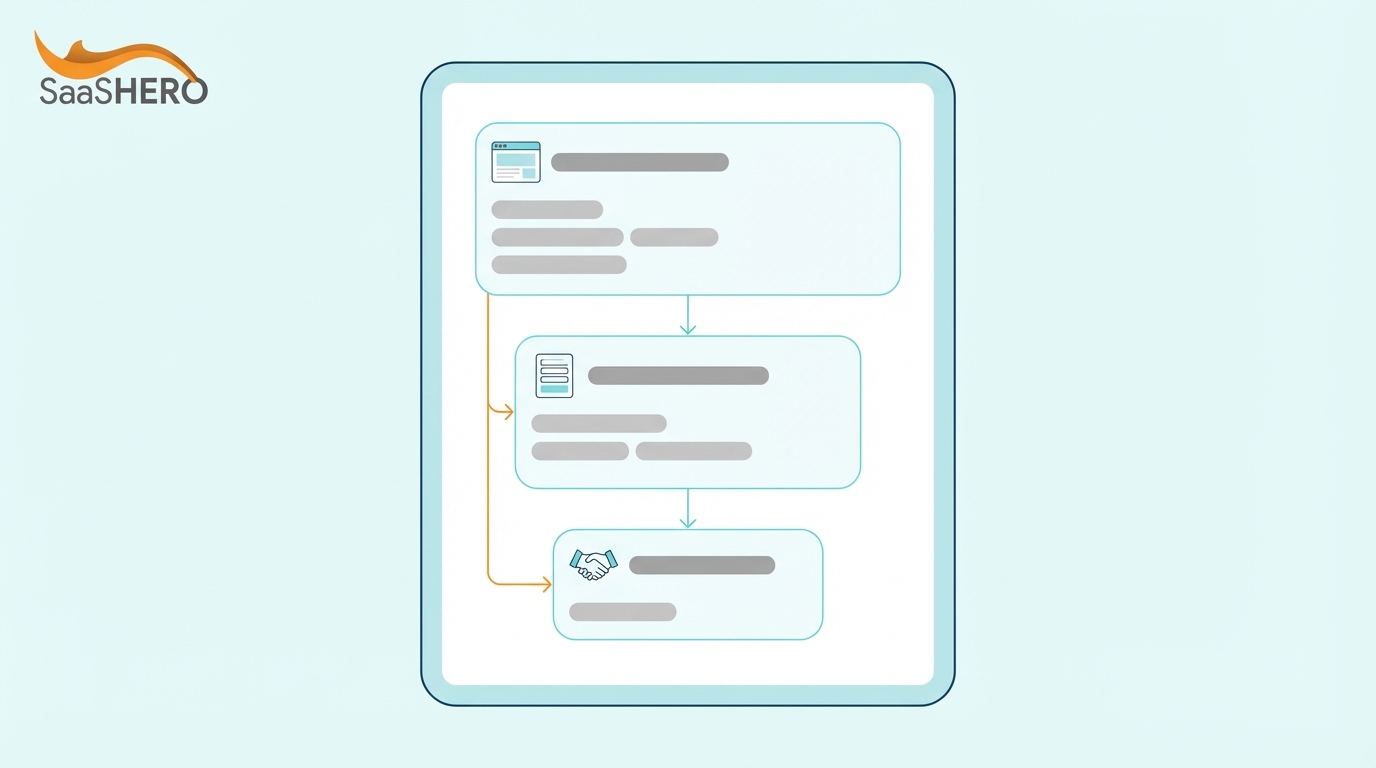
How to Calculate Sales Funnel Conversion Rate
Stage-by-stage analysis gives you accurate conversion tracking instead of a vague overall percentage. Use this formula for each funnel stage: (Conversions at Stage ÷ Total Entries to Stage) × 100.
Many SaaS companies face dark funnel attribution, where prospects research across multiple touchpoints before converting. Implement GCLID-to-CRM tracking so you can connect ad clicks and landing page visits to your sales system. Tools like HubSpot and Salesforce provide pipeline reporting, but you should measure Net New ARR instead of vanity metrics like total pipeline value.
The most common calculation mistake comes from using the wrong starting point. Your SQL-to-close rate should measure closed-won deals divided by sales-qualified leads, not total website visitors. This precision helps you see exactly where your funnel breaks down and where you should focus optimization. Once you have identified your biggest conversion gaps, you can apply stage-specific tactics to fix them, starting with top-of-funnel strategies that attract higher-intent visitors.
Step-by-Step: Optimize TOFU (Visitor-to-Lead)
Top-of-funnel work should attract visitors who already show buying intent. One of the strongest TOFU tactics is competitor conquesting, which targets users searching for competitor pricing, alternatives, and complaints.
Create dedicated landing pages for competitor comparison searches. When someone searches “[Competitor] pricing,” send them to a page that clearly shows your pricing advantage or core value proposition. Use negative keywords to exclude navigational searches that only include the competitor name, and focus on evaluative modifiers like “vs,” “alternative,” and “pricing.”
Intent data and account-based marketing (ABM) raise TOFU conversion rates by focusing on accounts that already show buying signals. Companies prioritizing intent-based outbound and ABM see higher funnel progression rates because they concentrate spend on in-market buyers.
Your 5-second value proposition test often predicts TOFU success. Visitors should understand your main benefit within 5 seconds of landing on your page. The TripMaster engagement generated $504k in ARR through competitor conquest campaigns that communicated value immediately to frustrated prospects.
Quick wins checklist: Start by launching competitor keyword campaigns that target high-intent searches, then build comparison landing pages where these visitors arrive. After those pages go live, add trust signals above the fold to establish credibility, and refine the mobile experience because a large share of B2B research now happens on phones. Finally, capture abandoning visitors with exit-intent popups that offer relevant lead magnets. Throughout this process, avoid broad keywords that pull in unqualified traffic and waste ad spend.

Optimize MOFU (Lead-to-SQL)
Middle-of-funnel optimization turns early interest into sales-ready conversations. The 42% MQL-to-SQL benchmark gap exists because many companies fail to nurture and qualify leads before sending them to sales.
Personalized trial experiences and targeted lead magnets improve MOFU conversion. Segmented emails yield 3-5x higher conversions, with behavioral segmentation achieving 2.5-3.5x lifts and predictive intent scoring delivering 4-6x improvements.
Sales and marketing alignment becomes critical at this stage. Create service level agreements that require sales follow-up within 2 hours of SQL creation. Use AI-powered lead scoring to prioritize prospects who show multiple buying signals such as pricing page visits, demo requests, and competitor comparison downloads.
SaaSHero’s heuristic audits support MOFU performance by improving relevance, clarity, and trust on key pages. Their Playvox case study reported a 10x decrease in cost-per-lead and a 163% volume increase after restructuring campaigns around qualified intent signals instead of broad awareness tactics.
MOFU optimization tactics include building nurture sequences based on specific lead magnet downloads, using progressive profiling to gather qualification data, and running retargeting for engaged prospects. You can also score leads based on product usage and engagement, then define clear MQL-to-SQL handoff criteria with sales teams so only qualified prospects move forward.
Optimize BOFU (SQL-to-Close)
Bottom-of-funnel optimization removes the final barriers that block purchase decisions. Demo request to closed deal conversion rates range from 20-30% for SMB and 10-15% for enterprise, which shows that most sales processes still leave revenue on the table.
Transparent pricing tables remove a major conversion barrier for high-intent prospects. Buyers who research pricing already feel ready to purchase, but hidden pricing forces them into slow sales cycles. Display clear pricing with value-based packaging so they can move forward faster.
Demo optimization should focus on personalization and relevance. Use prospect research to tailor demo scenarios to their use case and industry. Follow up quickly with trial access, implementation timelines, and switching incentives for prospects who currently use competitors.
Friction reduction matters most at BOFU. Streamline contract workflows, offer month-to-month options to reduce commitment anxiety, and provide implementation support that lowers perceived switching costs. SaaSHero’s landing page optimization at $750 per page has delivered 650% ROI by removing conversion barriers.

BOFU tactics work best when they address urgency, confidence, and friction together. Create urgency with limited-time offers that shorten decision timelines, while you build confidence through social proof such as customer logos and case studies. For prospects switching from competitors, remove financial friction with free migrations and reduce commitment anxiety by simplifying pricing and contract terms. Finally, cut process friction by offering immediate trial or demo access without long forms that delay evaluation.
Heuristic CRO Audit Checklist for Instant Fixes
Heuristic analysis uncovers conversion killers without waiting for A/B test significance. This structured review compares your funnel against proven usability principles so you can prioritize the highest-impact fixes first. The table below highlights four checks that usually deliver the fastest gains, with “High” impact items often driving immediate conversion lifts.
| Principle | Check | Fix | Impact |
|---|---|---|---|
| Relevance | Ad-to-page match | Align headlines | High |
| Clarity | 5-second value test | Simplify messaging | High |
| Trust | Social proof visible | Add testimonials | Medium |
| Friction | Form field count | Reduce to 3 fields | High |
The SaaSHero heuristic process uses three independent evaluators to review each page against these principles. This approach surfaces quick wins that your team can implement immediately while longer-term A/B tests run in the background.

Priority fixes often include matching ad copy to landing page headlines, reducing form fields to essential information only, adding trust signals like security badges and customer logos above the fold, and removing navigation elements on conversion-focused pages.
Ready to identify your biggest conversion opportunities? Get your comprehensive heuristic funnel audit to uncover quick wins and high-impact fixes.
Measurement, Tools & Advanced Plays
Revenue-focused measurement tracks Net New ARR, customer acquisition cost (CAC), and payback periods instead of impressions or clicks. AI-powered GTM tools improve engagement at every stage with personalized content and next-best actions.
Core tools include HubSpot or Salesforce for CRM tracking, Google Analytics 4 for website behavior, and Looker Studio for attribution reporting. Advanced setups use GCLID tracking to connect ad clicks through the entire customer journey.
The 80-day payback period achieved by TestGorilla represents a strong benchmark for SaaS unit economics. This metric shows that marketing spend generates positive cash flow within 80 days, which supports sustainable growth and attracts investors.
New 2026 AI tools like Rezo.ai add conversation intelligence and automated lead qualification. These platforms analyze sales calls and chat interactions to detect buying signals and refine follow-up sequences automatically.
Why SaaSHero Delivers the Best Results
SaaSHero’s flat-fee retainer model, tiered from $1,250 to $7,000 monthly based on ad spend and channels, removes spend-based incentive conflicts that affect many agencies. This structure keeps optimization recommendations focused on efficiency instead of budget increases.
Senior strategists manage campaigns directly rather than junior account managers. With over $30M in managed ad spend and experience across HR Tech, Transportation, and Cybersecurity, SaaSHero understands B2B SaaS buyer behavior.
Proven results include the TripMaster ARR gains, 650% ROI improvements, and 20% conversion rates that exceed industry benchmarks. Month-to-month contracts show confidence in performance without long-term lock-ins.

The SaaSHero approach combines competitor conquesting, heuristic audits, landing page improvements, and revenue-focused reporting that connects marketing spend to closed deals. This integrated method strengthens every funnel stage in sequence.
Transform your stuck funnel into a predictable revenue engine with proven SaaS expertise. Talk with SaaSHero about your conversion challenges and explore specific optimization opportunities.
Summary & Next Steps
Improving B2B SaaS funnel conversion rates requires coordinated work across TOFU competitor conquesting, MOFU lead nurturing, and BOFU friction reduction. Use the 2026 benchmarks to spot your largest gaps, apply heuristic audits for quick wins, and track Net New ARR instead of surface-level metrics.
Start with a comprehensive funnel audit so you can rank your highest-impact opportunities. Pay special attention to the MQL-to-SQL stage, which often becomes the main bottleneck, and support it with proven tactics like competitor campaigns and personalized nurture sequences.
Ready to move toward 20%+ conversion rates seen among industry leaders? Get your personalized optimization roadmap and begin generating more qualified pipeline right away.
FAQ
How long does it take to see results from B2B SaaS funnel optimization?
Most companies see early improvements within 30 to 60 days after implementing heuristic fixes such as landing page updates and competitor campaigns. Larger gains usually appear within 90 days as campaigns gather data and nurture sequences mature. The key is to combine fast wins with longer-term optimization programs.
Can these strategies work for different company sizes and stages?
These strategies work across stages, but you should adapt tactics to your resources and growth phase. Early-stage startups benefit most from bottom-funnel high-intent keywords and competitor conquesting for fast results. Growth-stage companies can layer in ABM and full nurture programs, while enterprise SaaS teams plan for longer sales cycles and more advanced attribution.
What are the biggest risks when optimizing conversion rates?
Poor tracking setup creates the biggest risk because it leads to decisions based on incomplete data. Many companies also chase higher conversion rates without protecting lead quality, which floods sales with unqualified prospects. Always monitor downstream metrics like SQL quality and closed-won rates, not just top-of-funnel conversions.
How often should I revisit and update my funnel optimization strategy?
Review performance monthly and run deeper audits every quarter. B2B SaaS markets change quickly as new competitors enter, buyer behavior shifts, and platforms update features. Seasonal patterns also affect conversion rates, so you need ongoing adjustments to campaigns and messaging.
What MQL-to-SQL conversion rate should I target?
Use 25 to 35% MQL-to-SQL conversion as a baseline, with 42%+ as a top-tier goal. Focus on SQL quality more than raw volume, since a 20% MQL-to-SQL rate with strong close rates beats 40% with weak sales outcomes. Align with sales on lead quality definitions and build feedback loops for continuous improvement.