

Written by: Aaron Rovner, Founder, Saas Hero
Key Takeaways
- Target a CAC Payback Period under 80 days to prove capital efficiency and attract investors, as TestGorilla did before their $70M raise.
- Aim for an LTV:CAC ratio above 3:1, with 4:1 ideal, so every acquisition dollar returns sustainable lifetime revenue.
- Track ROAS with benchmarks above 5:1 for Google Search and above 3:1 for LinkedIn to direct ad spend toward profitable campaigns.
- Improve MQL-to-SQL conversion rates to 18-22% by tightening lead scoring and targeting decision-makers with budget authority.
- Implement these revenue-first metrics with SaaSHero’s proven strategies by talking to our team about your current tracking setup.
1. CAC Payback Period
CAC Payback Period shows how quickly your company recovers the cost of acquiring a new customer. The formula is CAC ÷ (Average Monthly Revenue per User × Gross Margin Percentage). For example, if your CAC is $1,800 and monthly ARPU is $150 with 80% gross margin, your payback period is 15 months.
Excellent CAC payback for 2026 is 12-15 months, and top performers achieve under 80 days. TestGorilla maintained an 80-day payback period while scaling to their $70M Series A, which proved that efficient unit economics attract investor confidence.
Track this metric by channel in HubSpot or Salesforce, connecting ad spend to closed-won revenue. This channel-level tracking matters because last-click attribution undervalues awareness campaigns that start the buyer journey. For example, LinkedIn campaigns usually require higher payback tolerance due to premium CPMs, while Google Search should achieve faster payback from high-intent keywords, so you avoid applying one benchmark to every channel.
2. LTV:CAC Ratio
LTV:CAC ratio equals LTV divided by CAC. A healthy ratio for B2B SaaS is 3:1 minimum, with 4:1 as the target for 2026. This ratio means every dollar spent on acquisition should generate at least three dollars in lifetime revenue.
TripMaster achieved a strong LTV:CAC ratio that supported their $504k Net New ARR growth. Calculate LTV using monthly recurring revenue, gross margin, and churn rate. For a customer paying $200 monthly with 5% monthly churn and 80% gross margin, LTV equals $3,200.
Monitor this ratio monthly and segment by acquisition channel. Organic search usually delivers higher LTV:CAC ratios than paid social, while competitor conquest campaigns may show lower ratios but faster payback periods, which helps you balance long-term value with short-term growth.
3. Return on Ad Spend (ROAS)
ROAS shows how much revenue you generate for every dollar of ad spend. LinkedIn campaigns should target 3:1 ROAS minimum, while Google Search campaigns should exceed 5:1 because of higher intent traffic.
Playvox achieved a 10x decrease in Cost Per Lead while increasing volume by 163%. This shift showed how proper campaign restructuring and negative keyword use can dramatically improve ROAS. Focus on revenue attribution instead of lead volume so you avoid chasing vanity metrics.
Set up conversion tracking that passes revenue data back to ad platforms. Use Google Analytics 4 enhanced ecommerce or HubSpot revenue attribution to connect ad clicks to closed deals. Track ROAS by campaign, ad group, and keyword level so you can refine performance at a granular level.
Get help setting up revenue attribution to implement advanced ROAS tracking and campaign improvement strategies.
4. MQL-to-SQL Conversion Rate
MQL-to-SQL Conversion Rate shows how effectively marketing generates leads that sales teams qualify as genuine opportunities. Track SQO rate and opportunity win rate from marketing programs to measure channel effectiveness. Industry benchmarks range from 18-22% for B2B SaaS.
Poor MQL-to-SQL rates often signal targeting problems or lead scoring issues. Review your ideal customer profile and adjust campaign targeting to focus on decision-makers with budget authority. Use LinkedIn job title and company size filters to improve lead quality instead of chasing raw volume.
Implement lead scoring in your CRM based on demographic data such as company size and role, plus behavioral signals such as content downloads and demo requests. This structure helps sales teams prioritize follow-up and improves conversion rates throughout the funnel.
5. Demo-to-Closed-Won Rate
Demo-to-Closed-Won Rate measures how effectively product demonstrations convert prospects into customers. A SaaS company boosted demo-to-trial conversion from 12% to 34% using AI-powered demo personalization, which directly contributed to $4.2M in ARR growth over six months.
Benchmark demo-to-won rates typically range from 15-25% for B2B SaaS. RankScale.ai improved close rates by 39% by simplifying their funnel and rebuilding their demo script to focus on problem diagnosis first.
Track this metric by lead source to see which marketing channels generate the highest-quality demo requests. Improve landing pages so they pre-qualify prospects before they book demos, which ensures sales teams spend time with qualified opportunities.
6. Net New ARR Attribution
Net New ARR measures the incremental annual recurring revenue that marketing campaigns generate, excluding expansion revenue from existing customers. This metric connects marketing activities directly to business growth and board-level KPIs.
TripMaster generated $504,758 in Net New ARR through strategic paid search and social campaigns. This outcome shows how focused execution can drive substantial revenue growth. Track this metric with 90-180 day attribution windows so you reflect real B2B sales cycles.

Assign revenue values based on demo-to-close rates within 90-180 day attribution windows to connect marketing to revenue. Use CRM integration to track campaigns that influence closed-won deals, not just first-touch interactions, so you capture the full impact of your programs.
7. Cost Per SQL
Cost Per Sales Qualified Lead shows how efficiently you generate leads that sales teams accept as genuine opportunities. SEO delivers the lowest CPL at $31, followed by email at $53 and webinars at $72, while trade shows cost $811 per lead.
This metric guides budget allocation across channels. LinkedIn Ads usually generate higher-quality SQLs at premium costs, while Google Search provides more volume at lower per-lead costs. Balance quality and quantity based on your sales team capacity and close rates.
Calculate Cost Per SQL by dividing total channel spend by SQLs generated. Once you have this baseline, track it monthly and set targets based on your average deal size and close rates, because a $10,000 average deal with 25% close rate justifies higher SQL costs than smaller deal sizes. Without anchoring Cost Per SQL targets to deal economics, you risk overspending on low-value leads or underfunding channels that could scale profitably.
8. Activation Rate
Activation Rate shows the percentage of new users who complete key onboarding actions that correlate with long-term retention. A BI platform boosted activation rate from 52% to 71% by segmenting onboarding by role with tailored training, templates, and guides.
Top performers see 17-50% of users reach their “Aha! Moment” during onboarding. This metric highlights which marketing channels attract users who successfully adopt your product versus those who churn quickly.
Define your activation event based on product usage data that correlates with retention. Track activation rates by acquisition channel so you can focus spend on users more likely to become long-term customers.
Let’s discuss your onboarding metrics to implement activation tracking and improve your onboarding conversion rates.
9. Churn Impact from Campaigns
Churn Impact from Campaigns shows how marketing efforts affect customer retention and expansion. A SaaS company improved GRR from 85% to 92% and NRR from 95% to 108% by implementing feature adoption campaigns and CSM outreach for at-risk accounts.
Track Net Revenue Retention by acquisition cohort to see which marketing channels attract customers with higher lifetime value. Benchmarks for 2026 target 95-120% NRR for healthy B2B SaaS companies.
Run retention marketing campaigns for customers showing usage decline or approaching renewal dates. Use email sequences, in-app messaging, and CSM outreach to reduce churn and drive expansion revenue.
10. Magic Number (Efficiency Score)
The Magic Number measures sales and marketing efficiency by dividing net new ARR by total sales and marketing spend in the previous quarter, then multiplying by four. A score above 1.0 indicates efficient growth, while below 0.5 suggests spending problems.
This metric helps you decide when to scale marketing spend versus improve existing campaigns. Companies with Magic Numbers above 1.5 can usually justify aggressive growth investments, while those below 0.75 should focus on efficiency improvements.
Calculate this quarterly using your income statement data. Include all sales and marketing expenses, not just ad spend, to get a complete picture of go-to-market efficiency. Use this metric to guide budget allocation decisions and overall growth strategy.
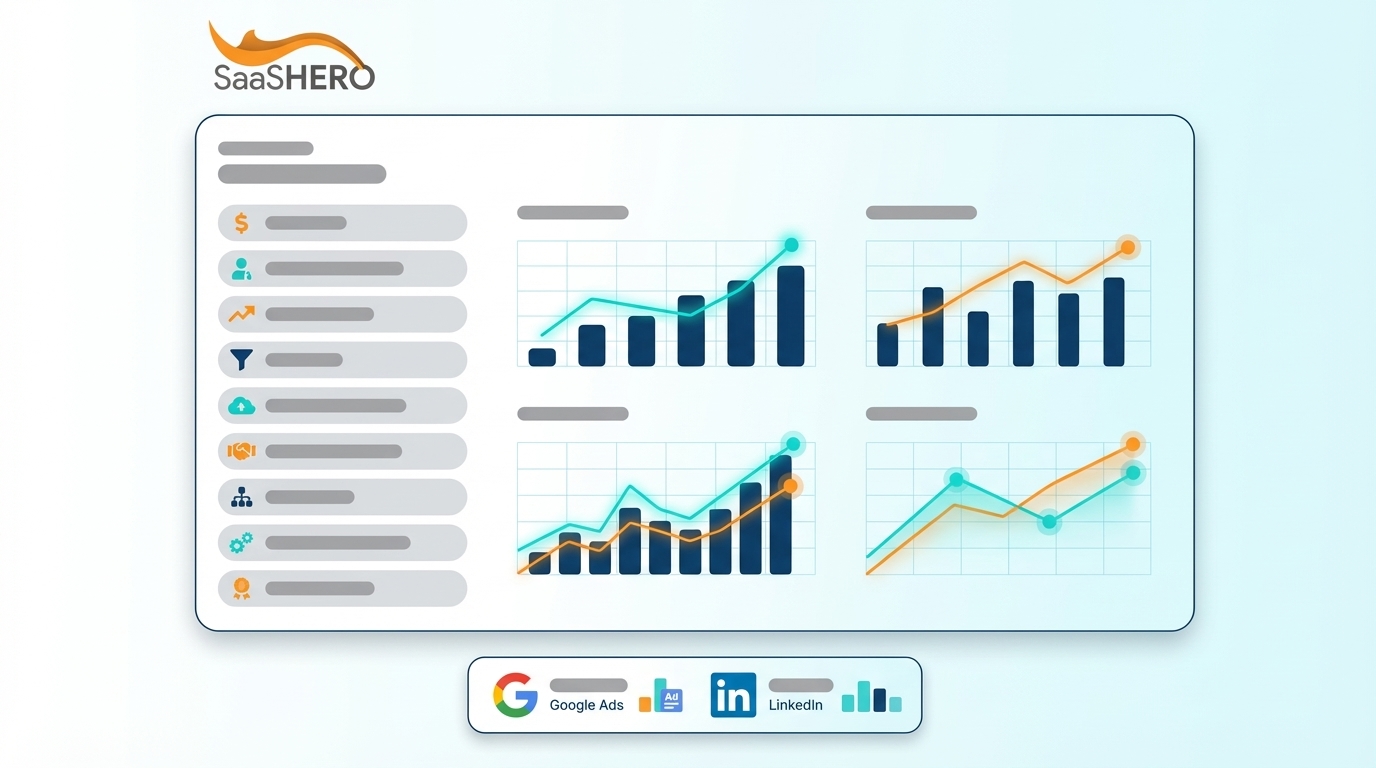
Channel Benchmarks: Choosing Between Google Ads and LinkedIn
LinkedIn Thought Leader Ads achieve 10-20% CTR for cold audiences and 15-25% for retargeted audiences, while Google Ads average £70.11 CPL with 1.42% conversion rates for B2B tech. The table below compares these channels side by side so you can match each platform to your acquisition strategy and budget.
|
Channel |
ROAS Benchmark |
CPL Range |
Best Use Case |
|
Google Search |
>5:1 |
$150-250 |
High-intent keywords |
|
LinkedIn Ads |
>3:1 |
$200-400 |
Account-based marketing |
|
SEO |
702% ROI |
$31 |
Long-term brand building |
Google Search excels for bottom-funnel keywords such as “[problem] software” and competitor terms. LinkedIn works best when you target specific job titles and company sizes for account-based marketing strategies. Competitor conquest campaigns can generate immediate pipeline but need dedicated landing pages for strong conversion.
FAQ: B2B SaaS Marketing Metrics
What’s a good CAC payback period for B2B SaaS in 2026?
Excellent CAC payback for B2B SaaS is under 80 days for top performers, with 12-15 months considered acceptable. Companies that reach sub-90-day payback periods show the level of capital efficiency that attracts investor confidence and supports sustainable growth.
How do you calculate LTV:CAC ratio accurately?
Calculate LTV using monthly recurring revenue divided by monthly churn rate, then multiply by gross margin percentage. Divide this LTV by your fully loaded CAC, including sales and marketing costs. Aim for the 3:1 minimum discussed earlier, with 4:1 preferred, so each acquisition dollar generates durable lifetime revenue even after churn and support costs.
Which marketing channels deliver the best ROI for B2B SaaS?
SEO delivers 702% ROI over three years with the lowest CPL at $31. Email marketing and webinars follow with strong efficiency. Paid channels such as Google Search and LinkedIn require higher investment but generate faster results for companies that need immediate pipeline.
What’s the difference between MQLs and SQLs in B2B SaaS?
Marketing Qualified Leads, or MQLs, meet demographic and behavioral criteria set by marketing teams. Sales Qualified Leads, or SQLs, are MQLs that sales teams accept as genuine opportunities with budget, authority, need, and timeline. As noted earlier, aim for an 18-22% MQL-to-SQL conversion rate, because lower ranges usually signal targeting or lead scoring problems.
How long should attribution windows be for B2B SaaS marketing?
Use 90-180 day attribution windows to reflect longer B2B sales cycles. B2B buyers often research for weeks or months before purchasing, so shorter windows undervalue top-of-funnel marketing activities that influence eventual conversions.
Conclusion: Scale with Revenue-First Metrics in 2026
The most successful B2B SaaS companies in 2026 will move away from vanity metrics and focus on CAC payback periods under 90 days, LTV:CAC ratios above 3:1, and Net New ARR attribution. These revenue-driven KPIs create a foundation for sustainable growth and investor confidence in a more capital-efficient market.
SaaSHero has helped companies like TripMaster generate $504k in Net New ARR and TestGorilla achieve 80-day payback periods that supported their $70M Series A. Our month-to-month retainer model aligns our success with your revenue growth and avoids the misaligned incentives of traditional percentage-of-spend agencies.

Talk with our team about your revenue metrics to put these revenue-focused KPIs in place and turn your marketing campaigns into predictable ARR growth engines.