

Written by: Aaron Rovner, Founder, Saas Hero
Key Takeaways
- B2B SaaS teams can unlock 20-50% conversion lifts at each funnel stage by fixing leaks across Visitor → Lead → MQL → SQL → Trial → Paid.
- Average benchmarks expose major bottlenecks like 2.3% visitor-to-lead and 13% MQL-to-SQL, while top performers reach 10%+ and 35%+ with focused improvements.
- SaaSHero’s heuristic audit framework scores Relevance, Clarity, Trust, Friction, Urgency, Distraction, and Anxiety to surface quick 20-35% wins such as shorter forms and stronger trust signals.
- Stage-specific plays like video content (up to 80% lifts), personalized demos (30% faster cycles), and 7-day trials (40%+ conversion) help compress CAC payback below 90 days.
- Real SaaSHero engagements have produced 650% ROI and $504k Net New ARR; see how these frameworks could apply to your funnel and replicate similar gains.
Why Fix GTM Funnel Leaks in 2026
The 2026 B2B landscape rewards precise GTM execution and punishes waste. Poor sales-marketing alignment costs B2B companies about 10% of revenue every year, while longer sales cycles from more stakeholders slow pipeline and inflate CAC. Dark funnel attribution gaps hide real leak points, which causes stalled follow-ups and inefficient sales activity.
These systemic issues are compounded by how most companies and agencies approach GTM optimization. Traditional agencies rely on percentage-of-spend models that reward higher budgets instead of better performance. Revenue-first partnerships remove this misalignment and focus on SQL generation, pipeline velocity, and Net New ARR. Companies like TripMaster generated $504k in Net New ARR and 650% ROI by treating funnel optimization as a core growth system instead of chasing vanity metrics.
Executive Summary and Six-Stage Funnel Framework
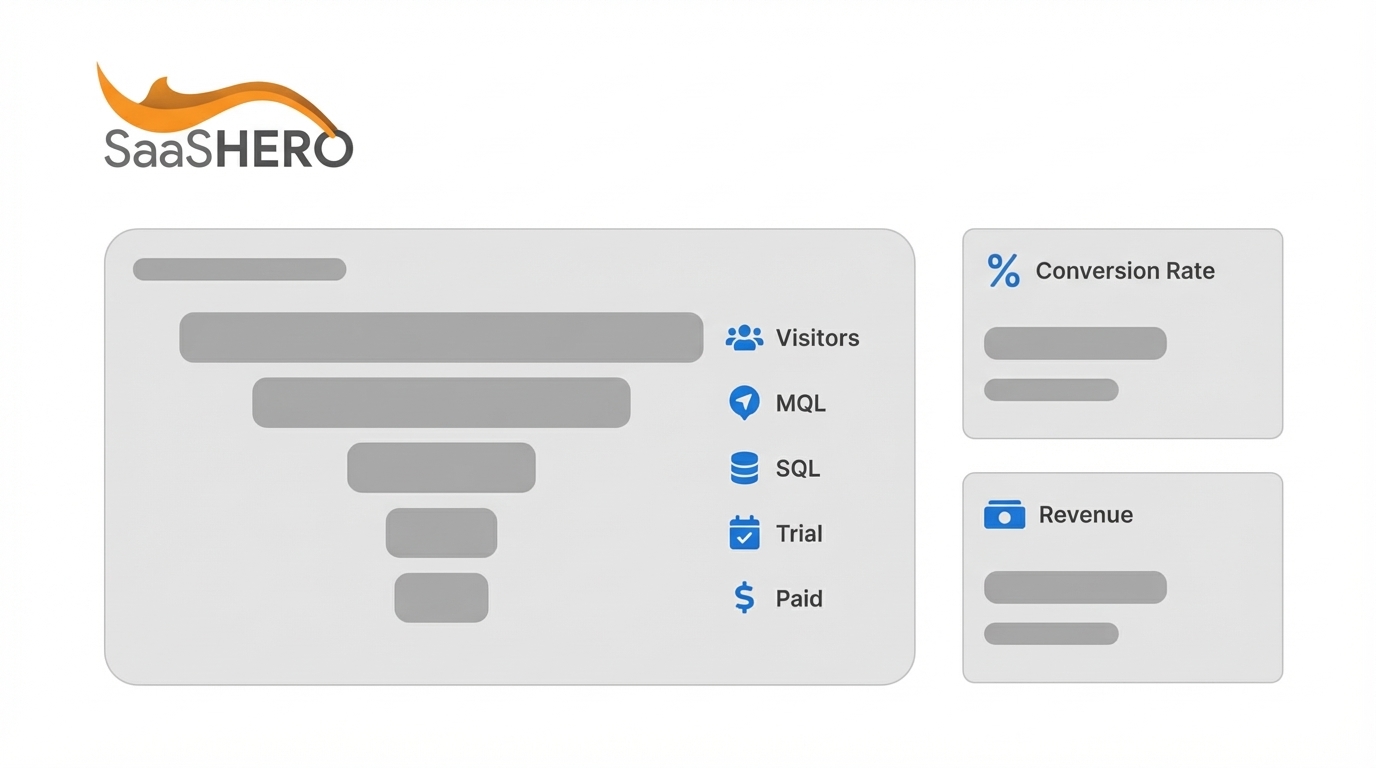
The 2026 B2B SaaS funnel runs through six stages: Visitor → Lead → MQL → SQL → Trial/Demo → Paid/Expansion. Average visitor-to-lead conversion sits at 2.3%, while MQL-to-SQL conversion averages only 13%, which forms the largest bottleneck. Top-quartile teams push visitor-to-lead above 10% and MQL-to-SQL above 35% through consistent, stage-level improvements.
CAC payback under 90 days depends on strong performance at every stage. Trial-to-paid conversion ranges from 18-25% for opt-in trials and 49-60% for opt-out trials, which shows how deliberate friction placement shapes revenue outcomes. A 20% lift at each stage compounds through the funnel and produces outsized revenue growth from the same traffic and budget.
2026 B2B SaaS GTM Funnel Benchmarks
This benchmark table highlights where most B2B SaaS funnels lose the most revenue. Notice how the MQL-to-SQL stage shows the widest gap between average and top-quartile performance, which makes it the highest-impact place to improve first.
| Stage | Average Conv Rate | Top Quartile | Primary Leak Drivers |
|---|---|---|---|
| Visitor-to-Lead | 2.3% | 10%+ | Poor targeting, weak value props |
| Lead-to-MQL | 31% | 40%+ | Unqualified traffic, no nurturing |
| MQL-to-SQL | 13% | 35%+ | Sales-marketing misalignment |
| SQL-to-Trial | 30-59% | 70%+ | Complex demo processes |
| Trial-to-Paid | 32-56% | 70%+ | Poor onboarding, unclear value |
These benchmarks align with the 2.3% visitor-to-lead average mentioned earlier, while adding channel-level nuance. SaaS organic search averages 2.7% visitor-to-lead conversion, and paid search averages 1.5%, reaching 3%+ with focused improvements. Teams that apply systematic funnel optimization consistently outperform these numbers across every stage.
Funnel Leak Diagnostic with SaaSHero’s Heuristic Audit
Effective funnel improvement starts with a structured diagnostic, not random testing. SaaSHero’s seven-point heuristic framework evaluates Relevance, Clarity, Trust, Friction, Urgency, Distraction, and Anxiety at each stage. This qualitative review surfaces conversion killers quickly, without waiting weeks for new traffic data.
The 5-second test exposes clarity gaps immediately. Visitors should grasp the core value proposition and the next step within five seconds of landing on a page. Companies that score highly on value delivery see 62% better conversion rates than those with vague or confusing positioning.
Clear quick wins usually appear during this audit. Above-the-fold trust signals often deliver 22% conversion lifts, while reducing form fields can create 20-35% improvements. The framework ranks these opportunities by impact and effort so you can ship high-yield changes first. Get a free heuristic audit of your funnel to identify your highest-impact optimization opportunities.

Stage-by-Stage Playbooks to Diagnose and Fix Leaks
Visitor-to-Lead: Turning Traffic into Qualified Leads
Visitor-to-lead performance depends on tight ICP targeting and sharp value propositions. Video content can drive up to 80% conversion increases, and personalized landing pages can improve conversion by 202%. Competitor comparison pages that target queries like “[Competitor] pricing” and “[Competitor] alternatives” capture buyers already in evaluation mode.

Form and CTA changes often deliver the fastest gains. Single CTAs can improve conversion by 32%, and reducing form fields from five to three typically adds another 25%. These friction-reduction tactics work even better when you pair them with urgency elements such as limited-time offers or live social proof showing recent signups, which create momentum for hesitant visitors.

Lead-to-MQL: Scoring and Nurturing for Fit
Lead-to-MQL conversion improves when scoring models reflect engagement, fit, and intent. Negative keyword strategies remove navigational searches that drain budget without adding pipeline. Personalized messaging produces 10% higher open rates and double the reply rates compared to generic nurture flows.
Lead magnets should match the buyer’s journey stage. Problem-awareness content works for early-stage leads, while solution comparison guides suit mid-funnel prospects. Track engagement velocity as well, because leads that consume several assets within 48 hours usually show 3x higher SQL conversion rates.
MQL-to-SQL: Fixing the Biggest Bottleneck
The MQL-to-SQL stage often blocks the most revenue in B2B funnels. Clear SLAs between marketing and sales reduce this friction. Sales should contact each MQL within 24 hours, supported by automated follow-up sequences. Lead routing based on company size, industry, and engagement score ensures that the right rep handles each opportunity.
Intent data sharpens timing and prioritization. More than 70% of B2B marketers now use intent data to identify ICPs and personalize outreach with real-time signals. This behavior-led targeting can increase ABM success and raise sales productivity by about 20%.
SQL-to-Trial/Demo: Running High-Impact Demos
SQL-to-trial performance hinges on demos that feel tailored and relevant. Micro-commitments can accelerate sales cycles by 30%, and problem-centered discovery with 11-14 questions can lift close rates by 74%. Custom demo environments that mirror the prospect’s workflow outperform generic feature tours.
Account-based personalization deepens this effect for high-value deals. Custom landing pages, industry-specific case studies, and tailored demo scripts often produce 18-60% conversion improvements on enterprise opportunities. These plays also shorten sales cycles by addressing stakeholder concerns earlier.
Trial-to-Paid: Designing Trials That Convert
Trial-to-paid conversion improves when users reach value quickly. Beyond the opt-in versus opt-out dynamics covered earlier, trial length also matters. Seven-day trials achieve 40.4% conversion rates, while trials longer than 61 days drop to 30.6%. Guided onboarding with in-app prompts, checklists, and tutorials helps users hit key milestones during that first week.
Activation metrics at 7- and 14-day checkpoints provide an early read on trial health. Track the product actions that correlate most strongly with paid conversion. Strategic free trial design delivers 57% better conversion than ad hoc setups. Progressive disclosure of advanced features then opens clear paths for expansion.
Expansion and Retention: Growing Existing Accounts
Post-conversion work focuses on reducing churn and expanding revenue per account. Account-based expansion now ranks as faster and cheaper than new logo acquisition, which makes retention and expansion central to sustainable growth. Usage pattern analysis helps you spot churn risk early and trigger proactive outreach.
Usage-based triggers can also drive expansion. When accounts hit specific thresholds, the system can surface upgrade prompts or notify customer success. This approach lowers blended acquisition costs and increases lifetime value from your current customer base.
Common GTM Pitfalls and Agency Traps
Many GTM struggles trace back to misaligned agency models. Percentage-of-spend billing rewards higher media budgets instead of better outcomes, and long-term contracts protect underperformance. Poor data capture affects 40% of companies and blocks accurate attribution and improvement. The 10% revenue loss from misalignment mentioned earlier often stems from this weak data foundation.
Capability gaps appear when senior leaders sell the work and junior teams execute it. Generalist agencies without B2B SaaS expertise rarely understand metrics like MRR, churn, and sales cycle length. Vanity reporting then hides these issues by focusing on impressions and clicks instead of pipeline and revenue.
Specialized partners with flat-fee pricing, month-to-month agreements, and senior-led execution create healthier incentives. Their recommendations center on performance and profitable growth rather than fee maximization, which supports long-term GTM success.

SaaSHero Case Studies with Documented Lifts
TripMaster generated $504,758 in Net New ARR with 650% ROI and 20% conversion rates from paid search through structured funnel optimization. The transportation software company used competitor conquesting campaigns and conversion improvements at each stage, which illustrated the compounding effect of small lifts across the funnel.

TestGorilla reached an 80-day CAC payback while adding more than 5,000 customers and closing a $70M Series A. The HR tech team scaled across several channels while protecting unit economics, which showed how disciplined GTM optimization supports sustainable hypergrowth.
Playvox cut cost-per-lead by 10x while increasing volume by 163% and conversion by 305%. The CX software company removed waste with negative keyword strategies and sharper targeting, proving how cleanup work can unlock major efficiency gains. See how these frameworks would apply to your specific funnel—schedule a strategy session with our team.
Tools, Quick Wins, and Implementation Roadmap
Modern GTM teams rely on a focused tool stack to execute this work. Looker Studio supports attribution analysis, HubSpot powers lead scoring and automation, and Google Analytics 4 tracks on-site behavior. Teams that coordinate email, LinkedIn, phone, and paid ads see up to 30% higher meeting conversion rates than single-channel programs.
Quick wins follow a clear order of operations. Start with friction reduction by implementing single CTAs per page for a potential 32% lift and reducing form fields for a 20-35% increase. Once these basics are in place, add trust-building elements like video testimonials, which can drive up to 80% improvement, then address technical performance with faster page load times. Layout redesign often delivers 18-40% conversion improvements by clarifying visual hierarchy and removing distractions.
Frequently Asked Questions
What is the difference between PLG and sales-led conversion benchmarks?
PLG motions usually see higher trial-to-paid conversion rates, often in the 32-56% range, because the product qualifies users directly. Sales-led motions tend to produce higher deal values but longer cycles. PLG companies should track activation metrics within 7-14 days, while sales-led teams focus on demo-to-close rates and pipeline velocity. ACV, product complexity, and buyer behavior patterns guide the right mix.
Which funnel stage offers the quickest 20% conversion lift?
Visitor-to-lead typically delivers the fastest lift through form reduction, CTA refinement, and prominent trust signals. These changes require little development work yet can raise conversion by 20-35% within a few weeks. MQL-to-SQL improvements from better lead scoring and tighter sales handoff also create rapid gains in pipeline quality.
How do you measure true GTM ROI beyond vanity metrics?
True GTM ROI centers on Net New ARR, CAC payback period, and pipeline velocity instead of clicks or impressions. Connect ad spend to closed-won revenue through CRM integration and multi-touch attribution. Track sales cycle compression and lifetime value improvements to understand the full impact of your GTM investments.
What is the optimal trial length for B2B SaaS conversion?
Seven-day trials achieve 40.4% conversion rates, while trials longer than 61 days fall to 30.6%. Shorter trials create urgency and force faster value delivery, while long trials often encourage procrastination. Guided onboarding that showcases clear value within the trial window matters more than the exact number of days.
How do you fix attribution gaps in complex B2B buying cycles?
Multi-touch attribution models that credit all key touchpoints provide a more accurate picture of influence. Consistent UTM parameters across campaigns and tight CRM integration with marketing platforms support this view. Account-level tracking across stakeholders then reveals how buying groups move through the journey and where to invest next.
Conclusion and Next Steps for Your GTM Funnel
Systematic GTM funnel optimization compounds into meaningful revenue gains for B2B SaaS companies. The frameworks in this guide give you a clear diagnostic process and stage-specific tactics that can unlock 20-50% improvements at each step, which often translates into 3x revenue growth from the same traffic.
Execution requires B2B SaaS expertise, reliable tracking, and ongoing iteration based on performance data. Ready to transform your GTM performance? Let’s build your custom optimization roadmap and connect with our team today.