




Written by: Aaron Rovner, Founder, Saas Hero | Last updated: September 3, 2026
Key Takeaways for B2B SaaS Leaders
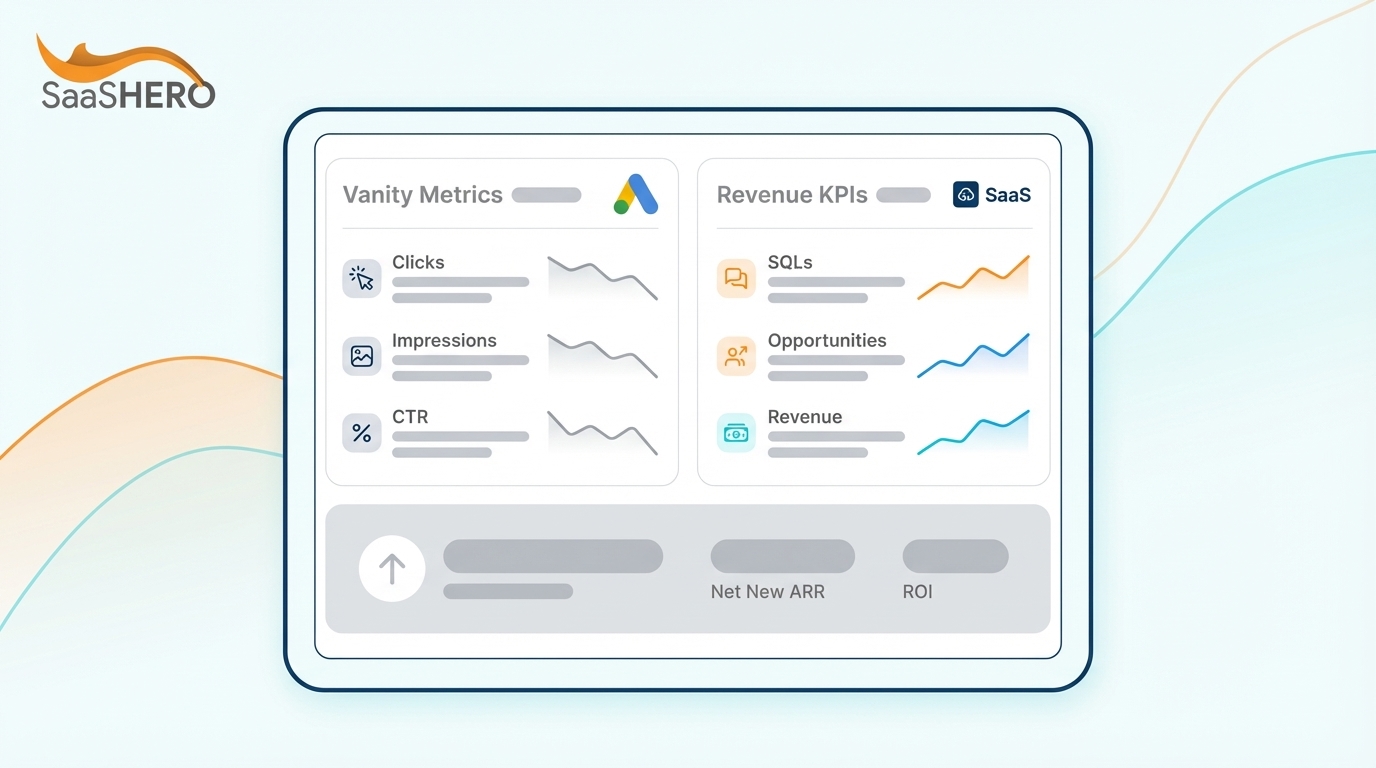
- Vanity metrics like impressions, clicks, and CTR measure platform activity but rarely connect to revenue or pipeline growth in B2B SaaS.
- Agencies often highlight these surface-level numbers because ad platforms reward what they can easily measure, not what drives business outcomes.
- Revenue-based KPIs such as CPA, ROAS, LTV:CAC ratio, and CAC payback period answer the questions CFOs and boards actually ask.
- Auditing your agency’s report for CRM integration, landing-page ownership, and proactive testing shows whether they focus on qualified buyers or just form fills.
- Ready to replace vanity metrics with revenue-focused Google Ads management? Talk to SaaSHero about your Google Ads strategy.
Vanity Metrics in Google Ads and Why They Mislead
The following metrics appear in nearly every agency report. Each one measures something real, yet each one misleads in a B2B SaaS context for a specific reason.
- Impressions. A high impression count means your ad was shown, not that it persuaded anyone. In B2B SaaS, where sales cycles run for months, an impression is a brief moment of potential awareness. A buyer might see your ad ten times across a six-month research journey, and none of those impressions created demand.
- Clicks. Clicks measure curiosity, not intent. Students researching a paper, competitors scouting your positioning, and job seekers exploring your careers page all generate clicks. The platform counts them identically.
- Click-Through Rate (CTR). A high CTR can coexist with zero qualified pipeline. If your ad promises something irresistible but your landing page does not deliver, you attract clicks from the wrong people. The platform still rewards the CTR.
- Cost Per Click (CPC). A cheap click only matters when the clicker can become a customer. Low CPC often signals low-quality traffic. The platform found the cheapest audience, not the most relevant one.
- Quality Score. Quality Score functions as a diagnostic tool, not a business outcome. Google Ads documentation confirms that conversion actions can be defined broadly in the platform, which means optimizing for Quality Score treats a platform signal as a success metric instead of a proxy for revenue.
The pattern across all five metrics stays consistent. The platform measures what it can observe, and what it can observe stops at the click.
Why Impressions, Clicks, and CTR Mislead B2B SaaS Marketers
The gap between a click and a closed deal in B2B SaaS spans months and involves multiple stakeholders. Google Analytics 4’s event-based measurement model requires deliberate configuration to align events with business objectives. Without that configuration, the default report shows platform activity instead of business outcomes.
Consider a campaign that generates thousands of clicks at a falling cost per click, while producing zero sales-qualified leads. The dashboard looks healthy. The pipeline stays empty. The ad platform received rewards for finding people who click, and it faithfully found more of them. The platform is succeeding at the goal it was given.
This mechanism makes vanity metrics dangerous rather than merely unhelpful. Google Ads behaves like a self-fulfilling prophecy. Feed the machine a low-quality conversion signal, and it will find more people who produce that signal. Students, competitors, and job seekers fill out forms. They do not buy software. An account optimized toward form fills systematically discovers the cheapest people to convert. The dashboard improves in the metrics the board sees, while the pipeline the sales team can work remains flat.
The Metrics That Matter Instead: Revenue-Based KPIs
Revenue-based KPIs connect directly to the questions a CFO and board actually ask. HubSpot’s CRM platform reflects the broader industry shift toward revenue-linked reporting. It tracks deals and pipeline stages to measure performance from lead to customer rather than from click to form fill.
The metrics that belong in a B2B SaaS Google Ads report include cost per acquisition (CPA), return on ad spend (ROAS), customer lifetime value (LTV), LTV:CAC ratio, and CAC payback period. SaaSHero holds accounts to two specific benchmarks: an LTV:CAC ratio of 3:1, which is generally considered healthy for SaaS, and a CAC payback period under 12 months.
The table below maps each common vanity metric to a revenue-based alternative and the question to put to your agency.
| Vanity Metric | Why It Misleads | Revenue-Based Metric to Track Instead | What to Ask Your Agency |
|---|---|---|---|
| Clicks | Anyone can click, including students, competitors, and job seekers | Qualified pipeline generated | How many of these clicks became sales-qualified leads? |
| Impressions | Being seen does not equal being persuasive | Sales-accepted opportunities | Which campaigns produced opportunities, not just views? |
| CTR | High CTR with zero conversions signals incorrect targeting | Cost per qualified lead | What is the conversion rate from click to SQL? |
| CPC | Cheap clicks from non-buyers add no value | CAC payback period | How long does it take to recover the cost of acquiring a customer? |
How to Audit Your Agency’s Google Ads Report
This framework gives a VP of Marketing clear language and a practical process to evaluate what an agency actually delivers in its monthly report.

- Check what the report leads with. When the first page features impressions, clicks, and CTR, the agency is leading with activity instead of outcomes. A revenue-focused report leads with pipeline, CAC, and payback period.
- Look for CRM data integration. Check whether the report references pipeline, lifecycle stage, or closed revenue. Pipeline management and revenue forecasting require CRM-connected reporting, not a platform export. When the agency’s numbers do not appear inside your CRM, the agency remains disconnected from your revenue.
- Ask about conversion architecture. Clarify which conversion events feed the bidding algorithm. Google Ads allows conversion actions to be defined broadly, so the platform may report conversions that have nothing to do with qualified buyers. When the answer is “form fills,” the algorithm is being trained to find form-fillers instead of buyers.
- Examine landing page ownership. Identify who owns the pages your ads point to. An agency that does not control the post-click experience cannot be accountable for conversion. For example, headline copy is the single highest-leverage variable on a landing page. If the agency cannot change it, the agency cannot move the number that matters.
- Demand proactive recommendations. Review whether the report includes new tests, new channels, or new messaging hypotheses. When those are missing, the account is being maintained instead of advanced. A stagnant account is the predictable output of a reactive relationship.
The red flags to document before the meeting are specific and checkable.
- Report leads with impressions and clicks
- No mention of pipeline or revenue
- No CRM data integration
- No landing page ownership or testing
- No proactive recommendations for new tests or channels
- Cost per lead is falling while pipeline stays flat
- No primary versus secondary conversion architecture
- No search terms review or negative keyword hygiene mentioned
If three or more of these appear in your current report, the agency is reporting on its own activity rather than on your business outcomes. Schedule a structured audit of your account with SaaSHero.
Real-World B2B SaaS Scenario: Fixing the Form Fill Fallacy
To see how these red flags play out in practice, consider a typical scenario. A SaaS company sees cost per lead drop and lead volume rise, while pipeline stays flat. The dashboard improves in exactly the metrics the board reviews, such as more leads and cheaper leads. The pipeline number that determines the company’s future does not move because the ad platform was optimized for form fills instead of qualified opportunities.

GA4’s event-based model requires deliberate alignment between tracked events and business objectives. Without that alignment, the optimization loop runs on the wrong signal indefinitely. The platform is succeeding at finding people who fill out forms, and that population differs from the population that buys software.
An agency that optimizes against CRM data catches this pattern quickly. It tracks lifecycle stage events such as when a lead becomes an SQL, when an opportunity is created, and when a deal closes. Those signals then feed back into the platform. The algorithm learns to find people who become customers instead of people who simply fill out forms. The account that looked healthy on the dashboard gets rebuilt around the signal that actually predicts revenue.
Choose an Agency That Focuses on Revenue
Vanity metrics measure activity. Revenue-based KPIs measure outcomes. When your agency cannot show how ad spend connects to CRM data, you receive a report instead of performance.
SaaSHero is the outsourced inbound growth team for B2B companies. One team owns strategy and execution across paid media, creative, landing pages, and reporting, and optimizes all of it against CRM revenue data rather than form-fill counts. As a Google Premier Partner with over $60M in managed ad spend, SaaSHero brings the methodology and accountability your quarterly business review demands.
Ready to see revenue-based Google Ads management in action? See revenue-based Google Ads management in action — book a discovery call.
Frequently Asked Questions
What are good metrics for Google Ads in B2B SaaS?
Revenue-based metrics form the standard a B2B SaaS company should use for its Google Ads program. The core set includes cost per acquisition (CPA), return on ad spend (ROAS), LTV:CAC ratio, CAC payback period, and qualified pipeline generated by channel. As mentioned earlier, SaaSHero targets an LTV:CAC ratio of 3:1 and a CAC payback period under 12 months. These metrics tie directly to business outcomes rather than platform activity, and they match the terms a CFO and board use to decide whether a channel deserves funding.
What is the difference between KPIs and vanity metrics in Google Ads?
KPIs measure progress toward business outcomes such as pipeline, revenue, customer acquisition cost, and payback period. Vanity metrics measure platform activity such as impressions, clicks, and CTR that look impressive in a report but do not correlate with revenue. The practical test is whether the metric changes a budget decision. A falling cost per click that coexists with flat pipeline behaves as a vanity metric in practice, regardless of its label. A rising cost per SQL that still falls within a healthy CAC payback period functions as a KPI because it informs a real allocation decision.
How do I know if my Google Ads agency is doing a good job?
The clearest test is whether the agency can show how ad spend connects to CRM outcomes. When the monthly report does not reference pipeline, lifecycle stage, or closed revenue, the agency is not measuring what matters. A second test concerns who sets the agenda. If you generate test ideas, chase creative, and find problems in the account before the agency does, the agency is executing a brief you are writing rather than owning the strategy. A third test involves landing page ownership. An agency that cannot change the page its ads point to cannot be accountable for conversion, regardless of how well the ad account is managed.
What should I track instead of clicks and impressions?
The metrics that belong in a B2B SaaS paid media report include qualified pipeline generated, cost per sales-qualified lead, opportunities created, and closed revenue attributed to paid channels. These metrics require CRM integration, which explains why most agency reports omit them. Tracking these metrics also changes what the ad platform optimizes toward. When lifecycle stage events feed back into the bidding algorithm, the platform learns to find people who become customers rather than people who fill out forms.
Is Quality Score a vanity metric?
Quality Score functions as a diagnostic tool rather than a business outcome. It measures ad relevance, expected CTR, and landing page experience relative to the auction. This helps identify structural problems in an account but does not measure whether the account produces revenue. Treating Quality Score as a success metric repeats the same error as treating CTR as one. It optimizes toward a platform signal instead of a business result. Use it to diagnose issues, never to report progress to a board or a CFO.