

Key Takeaways
-
Shift from vanity metrics like impressions and clicks to revenue-first KPIs such as Pipeline Generated Value, Net New ARR, and ROI to achieve 3x-5x agency returns in 2026.
-
Use Revenue Core metrics like Pipeline Value (SMB: $50K-$200K monthly) and Net New ARR to connect agency work directly to client bottom-line growth.
-
Track Efficiency metrics such as CAC ($150-$1,980 by channel) and Cost per SQL ($150-$500) to guide budget allocation and highlight the channels that consistently produce profitable customers.
-
Rely on Velocity metrics including 15-20% Lead Velocity Rate and 84-day median sales cycles to predict revenue 30-90 days ahead and speed up funnel progression.
-
Replace percentage-of-spend models with flat retainers and book a discovery call with SaaSHero to implement revenue tracking that has delivered 650% ROI.
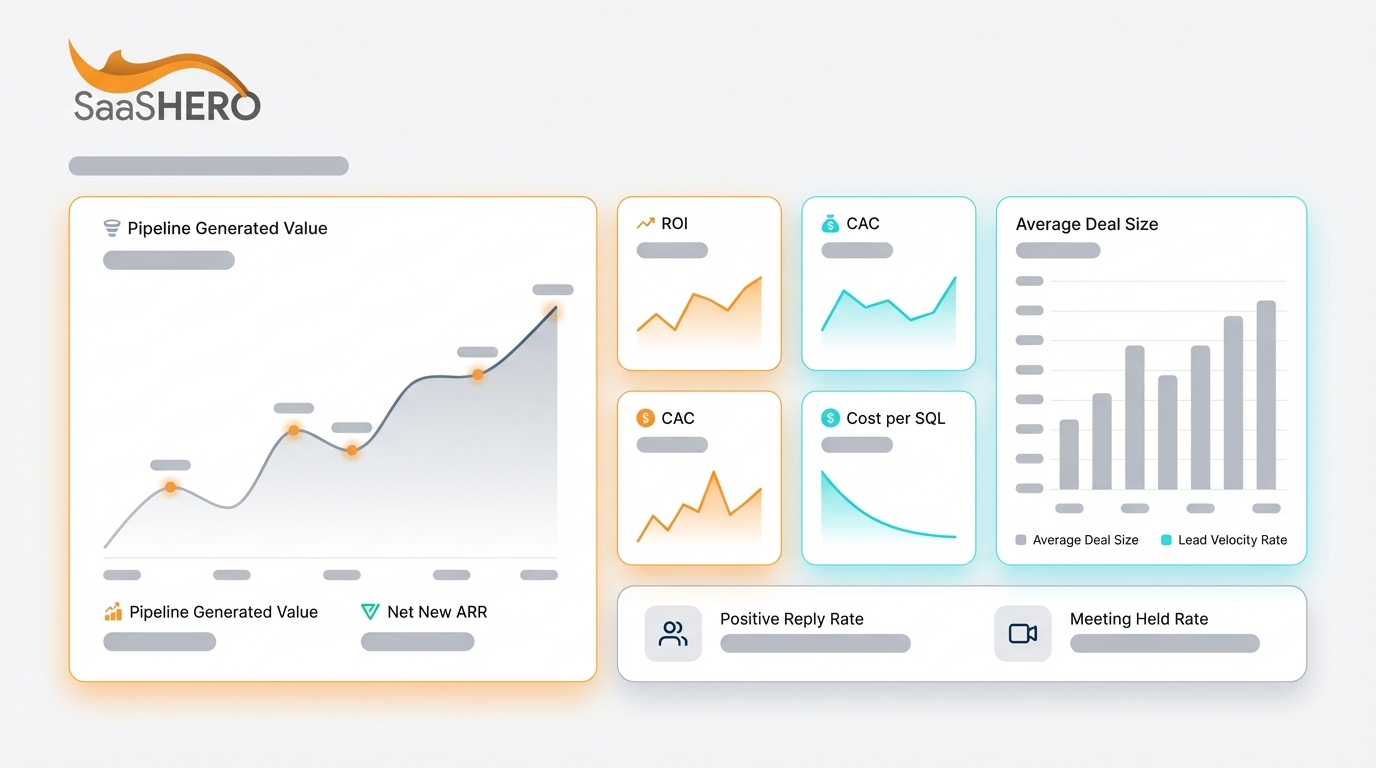
12 Revenue-First Metrics Lead Generation Agencies Must Track in 2026
Revenue Core Metrics That Prove Direct Revenue Impact
Revenue Core metrics create the baseline for agency accountability by measuring financial impact instead of activity volume. These metrics close the gap between marketing spend and real business outcomes.
1. Pipeline Generated Value
Pipeline Generated Value captures the total dollar amount of opportunities created through agency campaigns. This metric links marketing activities to the sales pipeline and shows clear revenue potential.
Formula: Pipeline Generated Value = Number of Opportunities × Average Deal Size
2026 Benchmarks: The following benchmarks show how pipeline expectations scale sharply with company size, with enterprise SaaS generating more than 4x the daily pipeline velocity of SMB companies.
|
SaaS Stage |
Monthly Pipeline Value |
Pipeline Velocity |
Source |
|---|---|---|---|
|
SMB ($1M-$10M ARR) |
$50K-$200K |
$1,847/day |
Digital Bloom |
|
Mid-Market ($10M-$100M ARR) |
$200K-$1M |
$2,850/day |
Optif.ai |
|
Enterprise ($100M+ ARR) |
$1M+ |
$8,219/day |
Optif.ai |
Implementation: Start by integrating CRM tracking with campaign UTM parameters so every opportunity has a clear source. After tracking is reliable, create automated pipeline reports that show opportunity creation by channel, campaign, and keyword, which reveals where high-value deals originate. Finish by adding multi-touch attribution so early awareness and mid-funnel touches receive fair credit instead of overvaluing last-click sources.

2. Net New ARR
Net New ARR represents the annual recurring revenue added from new customers acquired through agency efforts. This metric excludes expansion revenue and renewals and focuses only on new business growth.
Formula: Net New ARR = (New Customers × Average Contract Value) × 12 months
2026 Benchmarks: Median SaaS companies spend $2.00 to acquire $1.00 of new ARR, while top performers reach $0.50 acquisition cost per ARR dollar.
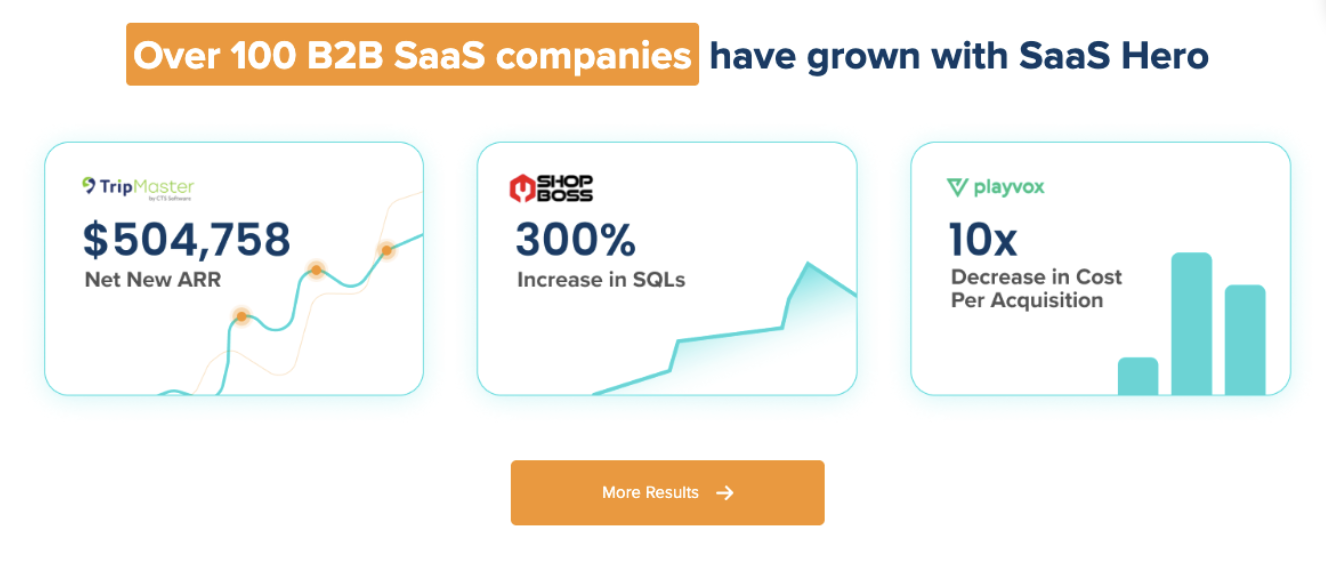
SaaSHero Case Study: TripMaster generated $504,758 in Net New ARR within 12 months through targeted competitor conquest campaigns and conversion rate improvements, which produced 650% ROI.

Implementation: Connect every closed-won deal to its original lead source inside your CRM. Report ARR attribution at the campaign level instead of only tracking lead volume. Add cohort analysis so you can see which campaigns bring in customers who renew and expand, not just those who close once.
3. ROI (Revenue/Agency Cost)
Return on Investment shows how much financial return each dollar invested in agency services produces. This metric drives accountability for agency performance and supports smarter budget decisions.
Formula: ROI = (Revenue Generated – Agency Cost) / Agency Cost × 100
2026 Benchmarks: Healthy B2B ROI ranges from 3:1 to 5:1, with average performance at $5.44 revenue per $1 invested.
Implementation: Include all agency-related costs such as retainer fees, ad spend, and setup costs in your ROI calculation. Measure revenue attribution over 6-12 months so longer B2B sales cycles are fully captured. Use customer lifetime value for recurring revenue models so you do not undervalue long-term contracts.
SaaSHero’s flat-fee model aligns agency success with client growth so you can scale your revenue tracking with our proven approach.

Efficiency Metrics That Reveal Cost per Customer
Revenue Core metrics show what you generate, while Efficiency metrics reveal how cost-effectively you generate it. These metrics guide budget allocation and highlight the acquisition channels that deliver profitable growth.
4. Customer Acquisition Cost (CAC)
CAC measures the total cost to acquire a new customer, including all marketing and sales expenses. This metric sits at the center of unit economics and profitability analysis.
Formula: CAC = Total Sales and Marketing Cost / Number of New Customers Acquired
2026 Benchmarks: The data below shows a 13x cost gap between the most and least efficient channels, with referrals paying back fastest and outbound sales requiring the longest payback window.
|
Channel |
B2B SaaS CAC |
Payback Period |
Source |
|---|---|---|---|
|
SEO |
$480-$942 |
7 months |
Phoenix Strategy |
|
Paid Search |
$802 |
12 months |
Phoenix Strategy |
|
Outbound Sales |
$1,980 |
18 months |
Phoenix Strategy |
|
Referrals |
$150 |
3 months |
Phoenix Strategy |
Implementation: Calculate CAC by channel so you can see which sources bring in customers at sustainable costs. Make sure you include ad spend, agency fees, internal team time, and technology costs, or your CAC will look better than reality. After you have accurate CAC by channel, monitor monthly trends to catch audience saturation or creative fatigue before efficiency drops sharply.
5. Cost per SQL
Cost per Sales Qualified Lead shows how much investment you need to generate leads that meet sales qualification criteria. This metric connects marketing spend with sales-ready opportunities.
Formula: Cost per SQL = Total Campaign Cost / Number of Sales Qualified Leads
2026 Benchmarks: B2B Cost per SQL ranges from $150-$300 for standard solutions, with high-complexity B2B reaching $300-$500.
Implementation: Align with sales on clear SQL criteria so both teams agree on lead quality. Track SQL conversion rates by source to refine targeting and shift spend toward channels that create more sales-ready leads. Use lead scoring to raise MQL-to-SQL conversion from the 13% industry average toward best-in-class 39-40% performance.
6. Average Deal Size
Average Deal Size captures the mean contract value of closed-won opportunities. This metric helps you judge lead quality and evaluate whether campaigns attract the right buyers.
Formula: Average Deal Size = Total Revenue / Number of Closed Deals
2026 Benchmarks: Median B2B SaaS ACV is $26,265, with SMB at $4,800-$15,000, mid-market at $40,000, and enterprise at $220,000.
Implementation: Segment deal size by lead source and campaign type so you can see which efforts attract higher-value accounts. Watch deal size trends over time to spot premium acquisition channels. Refine targeting and messaging toward segments that consistently close at or above your target ACV.
Velocity Metrics That Add the Time Dimension
Knowing your revenue and costs matters, yet Velocity metrics add the crucial time dimension. These metrics show how quickly leads move through the funnel, which affects cash flow, growth rate, and the predictability of your pipeline.
7. Lead Velocity Rate
Lead Velocity Rate tracks month-over-month growth in qualified leads. This metric acts as an early signal of revenue growth 30-90 days before deals close.
Formula: LVR = (Current Month SQLs – Previous Month SQLs) / Previous Month SQLs × 100
2026 Benchmarks: High-growth SaaS companies maintain 15-20% month-over-month LVR to support aggressive revenue targets.
Implementation: Monitor LVR trends across lead sources so you can see which channels are accelerating or slowing down. Combine LVR data with historical conversion rates and sales cycle length to forecast revenue one to two quarters ahead. Use those forecasts to adjust campaign spend early, increasing investment in high-LVR channels before the revenue fully shows up.
8. Lead-to-Customer Conversion Rate
Lead-to-Customer Conversion Rate measures the percentage of leads that become paying customers. This metric reveals overall funnel efficiency and the quality of leads entering your pipeline.
Formula: Lead-to-Customer Conversion Rate = Customers Acquired / Total Leads × 100
2026 Benchmarks: B2B SaaS overall lead-to-customer conversion rates range from 1.5-2.5%, with inbound leads converting at 5-10% and outbound at 1-3%.
Implementation: Track conversion rates by lead source so you can double down on channels that consistently create customers. Build lead nurturing sequences that move prospects from awareness to decision and raise conversion rates. Review conversion trends regularly to catch performance shifts and test new offers or messaging when rates drop.
9. Sales Cycle Length
Sales Cycle Length measures the average time from first touch to closed-won deal. Shorter cycles usually signal better lead quality and smoother sales processes.
Formula: Sales Cycle Length = Total Days from First Touch to Close / Number of Closed Deals
2026 Benchmarks: B2B SaaS median sales cycle is 84 days, with SMB at 40 days, mid-market at 60-120 days, and enterprise at 170+ days.
Implementation: Track sales cycle by lead source and campaign type so you can see which efforts close faster. Identify patterns that speed up or stall deals, such as missing stakeholders or unclear pricing. Use cycle length data to forecast when revenue will land and to plan sales capacity.
Input Metrics That Predict Downstream Performance
Input metrics measure the quality of early engagement and response. These leading indicators help you predict conversion performance before pipeline and revenue numbers update.
10. Positive Reply Rate
Positive Reply Rate shows the percentage of outreach attempts that receive interested responses. This metric reflects message relevance and the accuracy of your audience targeting.
Formula: Positive Reply Rate = Positive Responses / Total Outreach Attempts × 100
2026 Benchmarks: B2B outbound campaigns reach 5-15% positive reply rates, while personalized sequences can exceed 20% for tightly targeted accounts.
Implementation: Run A/B tests on message templates and subject lines to find language that resonates. Break out reply rates by industry, company size, and job title so you can refine your ideal customer profile. Use these insights to sharpen both targeting and messaging.
11. Meeting Held Rate
Meeting Held Rate measures the percentage of scheduled meetings that actually occur. This metric reflects prospect engagement and the strength of your scheduling process.
Formula: Meeting Held Rate = Meetings Held / Meetings Scheduled × 100
2026 Benchmarks: B2B SaaS demo-to-close rates average 30%, with interactive demos achieving 38% conversion rates.
Implementation: Track show rates by lead source and scheduling method so you can spot weak points. Add confirmation sequences and calendar integration to reduce no-shows. Review no-show patterns by segment and adjust meeting length, format, or timing to improve attendance.
12. Speed to Lead
Speed to Lead measures the time between lead capture and first contact attempt. Faster responses significantly improve conversion rates.
Formula: Speed to Lead = Total Response Time / Number of Leads
2026 Benchmarks: Responding within 5 minutes doubles conversion rates, with best-practice response time under 5 minutes.
Implementation: Set up automated lead routing and instant notifications so new leads reach the right owner quickly. Track response times by team member and lead source to uncover bottlenecks. Use lead scoring to push high-value prospects to the front of the queue for immediate follow-up.
Stop Tracking These 5 Vanity Metrics in 2026
Remove these metrics from your core dashboards because they signal activity without tying clearly to revenue:
-
Impressions: High visibility does not guarantee qualified leads or revenue.
-
Clicks: Traffic volume without conversion context provides no business value.
-
Click-Through Rate (CTR): High CTR with low conversion shows that you are reaching the wrong audience.
-
MQL Volume: Lead quantity without quality metrics creates sales team frustration and wasted follow-up.
-
Bounce Rate: Website engagement metrics alone do not predict purchase intent or deal value.
SaaSHero’s revenue-first approach removes vanity metric reporting and focuses on metrics that grow Net New ARR and client revenue. Switch to revenue tracking with SaaSHero’s proven methodology.
FAQ: Revenue-First Metrics for Lead Gen Agencies
How do you calculate agency ROI for B2B SaaS clients?
Use the standard ROI formula covered earlier, then adapt it for SaaS by plugging in Customer Lifetime Value instead of first-year revenue. Include every cost tied to the engagement, such as monthly retainer, ad spend, setup fees, and additional services. Track ROI over 6-12 months so longer B2B sales cycles and renewals appear in the numbers. Healthy B2B agency ROI should exceed 300 percent, and top performers often reach 500 percent or more.
What are 2026 Cost per SQL benchmarks for B2B SaaS?
Cost per SQL benchmarks vary by complexity and target market. Standard B2B SaaS solutions average $150-$300 per SQL, while high-complexity enterprise solutions reach $300-$500. Channel-specific benchmarks show SEO generating the lowest cost SQLs at $31-$92, followed by email marketing at $53 and PPC at $181. LinkedIn campaigns usually cost $230-$320 per SQL but often deliver higher deal values. Track Cost per SQL by channel and compare it to deal size so you can prioritize the most efficient and profitable sources.
How does SaaSHero’s tracking setup differ from traditional agencies?
SaaSHero builds full revenue tracking that connects ad clicks to closed revenue through CRM integration. The setup includes UTM parameter tracking, multi-touch attribution modeling, and automated pipeline reporting. Traditional agencies often rely on Google Analytics last-click attribution, which hides early and mid-funnel impact. SaaSHero instead uses platforms like HubSpot and Salesforce to track the complete customer journey and optimize based on revenue, not impressions or clicks.
Why choose flat retainer over percentage spend models for metrics tracking?
Flat retainer models align agency incentives with client success instead of budget size. Percentage-of-spend agencies earn more when clients spend more, which can create pressure to increase budgets even when returns stall.
SaaSHero’s flat retainer structure keeps the focus on efficiency and ROI, not fee growth. This alignment supports honest reporting on metrics like Cost per SQL and CAC because agency revenue does not depend on inflating ad spend. Month-to-month contracts add another layer of accountability and require the agency to prove value every 30 days.
How do you migrate from vanity metrics to revenue-first tracking?
Begin by connecting marketing campaigns to CRM data through reliable attribution tracking. Set up UTM parameters for every campaign and confirm that lead source data flows correctly into your CRM. Align with sales on SQL criteria so you have a shared definition of lead quality.
Shift reporting gradually from activity metrics such as impressions and clicks to outcome metrics like pipeline value and Net New ARR. Train your team to optimize campaigns around Cost per SQL and ROI instead of Cost per Click. Most teams need 30-60 days to build baseline data and start making revenue-based decisions.
Conclusion: Put Revenue-First Metrics at the Center of Reporting
Focus first on the four highest-impact revenue-first metrics, which are Pipeline Generated Value, Net New ARR, ROI, and Cost per SQL, to unlock fast 3x ROI gains. Add the remaining eight metrics over the next 90 days to build a complete revenue-first reporting system. Revenue Core metrics create accountability, Efficiency metrics guide spend, Velocity metrics shape growth speed, and Input metrics forecast performance.

SaaSHero delivers more than $500k in ARR gains through proven methods and month-to-month accountability. Our flat retainer model removes percentage-of-spend conflicts so every recommendation centers on your growth, not our fees.