

Key Takeaways
-
A structured 7-phase GTM framework shortens payback periods by up to 3x and fits 2026’s tight capital environment for B2B SaaS.
-
Precise ICP definition, backed by 15–20 interviews and TAM validation, supports targeted market entry with more than 80% accuracy.
-
Competitor conquesting and coordinated omnichannel campaigns drive 25–35% MQL-to-SQL conversion and 4.2% CTR in high-intent campaigns.
-
Revenue-centric KPIs such as sub-80-day CAC payback, net revenue retention above 120%, and 92% attribution accuracy support durable scaling.
-
SaaSHero’s execution helped clients like TripMaster reach $504k ARR; schedule a discovery call with SaaSHero to apply this framework to your GTM.
Why Go to Market Strategy Phases Matter for B2B SaaS in 2026
The B2B SaaS landscape in 2026 demands disciplined, metrics-driven go-to-market execution. Only 41% of SaaS sales reps are hitting quota in 2025, which shows how ad-hoc launches now underperform. Capital markets expect clear proof of efficiency, so investors focus on CAC payback periods under 80 days and net revenue retention above 120%.
Modern B2B buyers complete most of their research before they speak with sales teams. 81% of B2B buyers make vendor selection decisions before engaging sales teams, so GTM plans must reach buyers inside this dark funnel with competitor conquesting and intent-based targeting.
Clear go-to-market strategy phases give teams a repeatable operating system for launch and expansion. Companies that follow a structured GTM sequence report higher product launch success rates and reach sustainable unit economics faster than teams that rely on disconnected tactics.
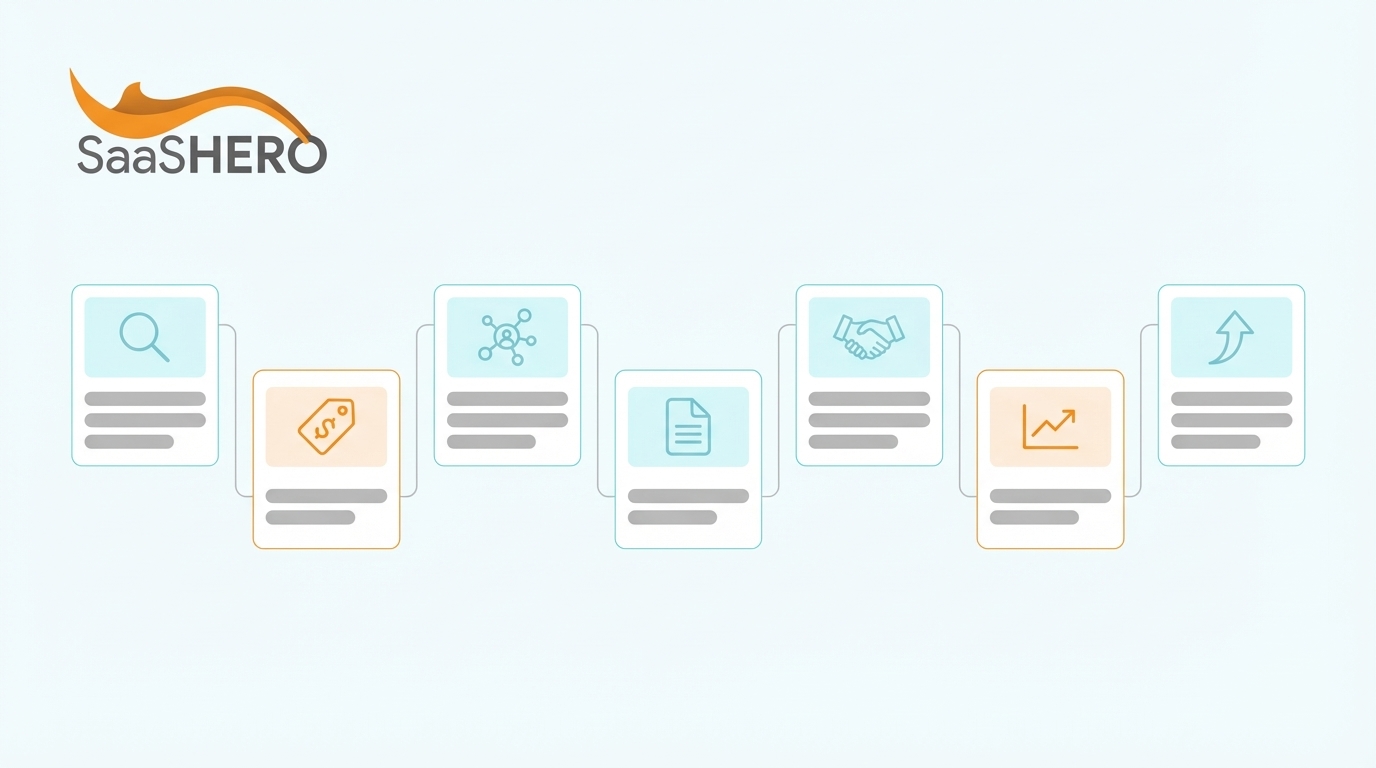
7 Phases of a Go-to-Market Strategy for B2B SaaS
The seven phases below form a practical framework for B2B SaaS companies that want predictable revenue growth in 2026’s tougher market.
Phase 1: Market Research and ICP Definition
Market research and ICP clarity create the base for every other GTM decision. This phase validates your Ideal Customer Profile through structured data collection and analysis. Effective ICP development examines demographics, firmographics, pain points, and behavioral traits so you can build precise targeting rules.
Key activities start with 15–20 customer interviews that confirm real pain points and buying triggers. Next, analyze closed-won deals to find patterns in company size, use cases, and decision makers. Use these insights to guide a detailed competitor SWOT analysis that highlights where your product delivers unique value.
With this qualitative foundation in place, gather quantitative data on Total Addressable Market (TAM), Serviceable Addressable Market (SAM), and Serviceable Obtainable Market (SOM) using both top-down and bottom-up models.
The metrics below show what strong ICP validation looks like in practice and how disciplined research improves market accuracy.
|
Metric |
Target |
SaaSHero Example |
|---|---|---|
|
ICP Score |
>80% |
TripMaster: 87% accuracy |
|
Interview Completion |
15–20 customers |
18 completed interviews |
|
TAM Validation |
3 methodologies |
$2.4B validated market |
Teams often rely on assumptions or define ICPs too broadly, which dilutes focus and wastes budget. Successful companies like TripMaster refined their ICP through structured analysis, achieving the precision that powered the growth highlighted in the key takeaways above.

Phase 2: Value Proposition and Pricing Strategy
A sharp value proposition connects product features to measurable business outcomes that your ICP cares about. 85% of SaaS companies have adopted hybrid pricing models combining base subscriptions with usage charges, which reflects the shift toward outcome-based pricing in 2026.
Start by building messaging frameworks that speak directly to ICP pain points using the exact language captured during interviews. These messages then guide your pricing strategy, because the value you describe must match the price customers see. Design pricing that reflects delivered value and stays competitive, using subscription tiers and usage-based elements that align with how customers adopt and expand.
The table below highlights benchmarks that signal a strong value proposition and pricing fit, from unit economics to message performance.
|
Metric |
Target |
SaaSHero Example |
|---|---|---|
|
LTV:CAC Ratio |
3:1 minimum |
TestGorilla: 4.2:1 |
|
Price Testing |
3 models tested |
Hybrid model selected |
|
Message Resonance |
>8% reply rate |
12% cold email response |
Support your pricing with Total Cost of Ownership (TCO) models that show clear ROI over current tools or processes. Companies that reach this level of value clarity see higher conversion rates and shorter sales cycles.
Phase 3: Channel Strategy and Competitor Conquesting
Channel strategy defines how you reach and convert your ICP across the full buying journey. The five core pillars for modern B2B SaaS GTM include direct sales, digital marketing, partner ecosystems, product-led growth, and competitor conquesting. Competitor conquesting campaigns target high-intent users searching for alternative solutions, which captures prospects during active evaluation.
Build an omnichannel motion that coordinates LinkedIn, email, phone, and paid media touchpoints. 94% of B2B decision makers find omnichannel sales models more effective than single-channel approaches, so integrated outreach usually produces more meetings and higher-quality pipeline.
The metrics below illustrate how effective channel mix and conquesting performance look when this strategy is working.
|
Metric |
Target |
SaaSHero Example |
|---|---|---|
|
SQL Generation |
25–35% MQL conversion |
Playvox: 10x CPL reduction |
|
Channel Mix |
2–3 primary channels |
Search + Social + Conquest |
|
Conquest CTR |
>3% click rate |
4.2% average CTR |
Use negative keyword lists to block navigational searches and protect budget from low-intent clicks. Target high-intent modifiers such as “pricing,” “alternatives,” and “vs [competitor],” then focus spend on these terms instead of broad awareness queries. By concentrating budget on these high-intent searches, this precision targeting approach produced the strong CPL and CTR results achieved for clients like Playvox.
Phase 4: Content and Asset Development
Content and assets support buyers who research quietly in the dark funnel before they ever talk to sales. Dark funnel assets like ROI calculators and interactive demos help prospects evaluate your product on their own terms.
Plan content by buying stage. Use educational pieces for awareness, comparison guides for consideration, and proof assets such as case studies for decision. Add lead magnets, detailed case studies, and interactive tools that collect contact information while still delivering real value.
The engagement metrics below show how effective dark funnel content behaves when it resonates with your ICP.
|
Metric |
Target |
SaaSHero Example |
|---|---|---|
|
Content Engagement |
>5 min time on page |
7.3 min average session |
|
Lead Magnet CVR |
15–25% |
22% conversion rate |
|
Demo Requests |
3–5% of traffic |
4.8% demo request rate |
Prioritize interactive formats that invite action instead of passive reading. Video performs especially well, and 87% of users report making purchase decisions after watching product demos.
Phase 5: Sales Alignment and Launch Execution
Sales alignment turns marketing momentum into closed revenue. Sales enablement in this phase creates smooth handoffs between marketing and sales teams so qualified interest does not stall.
Define clear Service Level Agreements that cover lead qualification rules, response times, and follow-up cadences. Train sales teams on the value proposition, competitive landscape, and common objections so they can reinforce your GTM story in every conversation. Use a soft launch with a smaller audience segment to test messaging, routing, and processes before you scale.
The table below highlights the win rates, no-show rates, and sales cycles that signal healthy launch execution and strong sales-marketing alignment.
|
Metric |
Target |
SaaSHero Example |
|---|---|---|
|
Win Rate |
20–30% |
TestGorilla: 28% win rate |
|
Demo No-Show |
<15% |
12% no-show rate |
|
Sales Cycle |
60–90 days |
75 day average cycle |
Companies that maintain tight alignment between marketing, sales, and customer success see faster revenue growth, with some studies showing 24% higher growth over three years.
Phase 6: Measurement and Attribution
Measurement and attribution connect every GTM activity to revenue, which allows confident scaling decisions. Robust tracking passes data from ad click through CRM stages to closed-won deals so teams can adjust based on real business impact instead of surface-level metrics.
Concentrate on revenue-centric KPIs such as CAC payback, pipeline velocity, and net new ARR. Top-performing B2B marketers achieve 81% higher ROI with account-based marketing approaches, because these programs support precise tracking and continuous refinement.
The KPIs below show what advanced measurement looks like when attribution and revenue data align.
|
Metric |
Target |
SaaSHero Example |
|---|---|---|
|
CAC Payback |
<80 days |
TestGorilla: 80 days |
|
Pipeline Velocity |
$X per day |
$2,847 daily velocity |
|
Attribution Accuracy |
>85% |
92% revenue attribution |
Weekly performance reviews support fast optimization cycles and keep teams focused on the right levers. This disciplined measurement rhythm drives ongoing improvement and supports sustainable growth.
Phase 7: Scale and Expansion
Scale and expansion focus on growing what already works while protecting unit economics. This phase increases investment in proven channels and motions instead of chasing untested ideas.
Top-quartile SaaS companies achieve net revenue retention rates of 115–120% by expanding within their existing customer base. Use account-based expansion to target upsell and cross-sell opportunities. Build referral programs and advocacy initiatives that turn satisfied customers into a steady source of new pipeline.
The metrics below highlight how strong expansion performance appears when GTM motions scale efficiently.
|
Metric |
Target |
SaaSHero Example |
|---|---|---|
|
NRR |
>120% |
TripMaster: 135% NRR |
|
Expansion Rate |
15–25% |
22% expansion revenue |
|
Referral Rate |
10–15% |
18% referral generation |
SaaSHero’s month-to-month engagement model supports flexible scaling, so companies can increase investment in winning channels without long contracts. This structure has helped clients grow consistently while staying capital efficient.

Book a discovery call to see how SaaSHero’s framework can speed up your GTM execution and produce measurable revenue gains.
Frequently Asked Questions
What are the stages of a GTM strategy?
The seven core stages include market research and ICP definition, value proposition development, channel strategy, content creation, sales alignment, measurement and attribution, and scaling successful motions. Each stage builds on the previous one to form a complete framework for B2B SaaS growth.
How long does it take to implement a go-to-market strategy template?
A full GTM rollout usually takes about 90 days. Plan 30 days for research and planning, 30 days for content and asset creation, and 30 days for launch execution and early optimization. Many companies start seeing results from individual phases within 2–3 weeks.
What are the key GTM phases for SaaS companies?
SaaS-focused GTM phases emphasize competitor conquesting, dark funnel content, usage-based pricing models, and product-led growth elements. These phases differ from traditional B2B plans by weaving SaaS metrics such as ARR, churn, and expansion revenue into every stage.
How do the 5 pillars of GTM apply to B2B SaaS?
The five pillars, which include direct sales, digital marketing, partnerships, product-led growth, and competitor conquesting, work together to cover your market. B2B SaaS companies often begin with one or two pillars, then expand based on performance data and available resources.
What metrics indicate successful GTM phase execution?
Key success indicators include CAC payback periods under 12 months, LTV:CAC ratios above 3:1, net revenue retention above 110%, and sales cycles that fit your segment. Leading indicators include demo request rates, SQL conversion rates, and pipeline velocity.
Execute Your Go to Market Strategy Phases with SaaSHero
The seven-phase framework offers a clear, repeatable path to B2B SaaS growth in 2026’s challenging market. Success depends on disciplined execution across market research, value proposition development, channel strategy, content creation, sales alignment, measurement, and scaling.
Implementing this framework well requires both strategic guidance and hands-on execution. SaaSHero has helped companies like TripMaster generate $504k in net new ARR and TestGorilla hit the 80-day CAC payback benchmark discussed in Phase 6 through structured GTM programs. Our flat-fee, month-to-month model ties our success to your revenue outcomes and avoids the misaligned incentives common with traditional agencies.
Whether you are launching a new product or improving current GTM motions, SaaSHero’s framework and execution support can shorten your path to predictable revenue.
Book a discovery call to explore how our 7-phase approach can deliver measurable results for your B2B SaaS company.