

Written by: Aaron Rovner, Founder, Saas Hero
Key Takeaways
-
Prioritize Cost Per SQL ($150-$300 benchmark) instead of vanity metrics like CTR to measure real B2B SaaS Facebook pipeline performance.
-
Track Pipeline Velocity to shorten sales cycles, aiming for 84 days or less with accurate CRM tagging and attribution.
-
Target a 15-25% MQL-to-SQL conversion rate with precise audience targeting and lead scoring to protect lead quality.
-
Watch CAC Payback Period (80 days ideal) and Pipeline ROAS (3:1 to 5:1) to keep acquisition efficient and revenue-focused.
-
Partner with SaaSHero for outcomes like a 10x CPQL reduction and $504K ARR growth, and schedule a discovery call today.

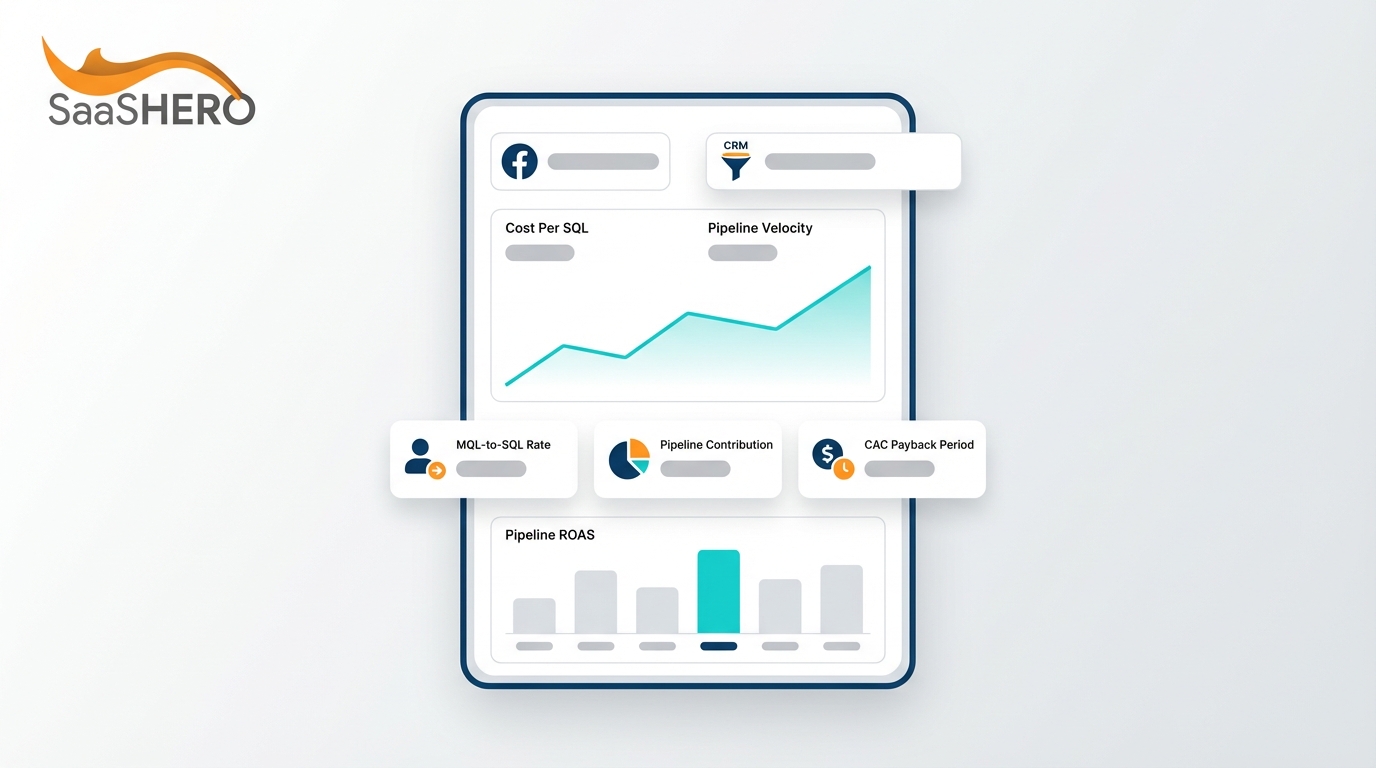
1. Cost Per SQL (CPQL): Your Core Pipeline Efficiency Metric
Cost Per Sales Qualified Lead serves as the primary metric for B2B SaaS paid social campaigns. CPQL tracks how much you spend to generate prospects that sales teams can actively pursue. Facebook retargeting campaigns show 40-60% lower cost per qualified lead compared to cold Facebook campaigns, so accurate audience segmentation matters.
Formula: CPQL = Total Paid Social Ad Spend ÷ Sales Qualified Leads Generated
2026 Benchmark: $150-$300 for B2B SaaS
Connect Conversions API with your CRM to track leads from first touch through qualification. Add UTM parameters to every paid social ad, pass GCLID into HubSpot or Salesforce, and create custom conversion events for SQL status changes. Avoid counting MQLs as SQLs and account for multi-touch attribution where paid social assists other channels.
SaaSHero cut cost per lead by 10x for Playvox by restructuring account architecture and using negative keyword strategies that removed unqualified traffic.
2. Pipeline Velocity: Speeding Up Qualified Deals
Pipeline velocity shows how quickly paid social leads move through your sales funnel. This metric highlights whether your paid social targeting attracts prospects who convert faster or slower than other channels. B2B security SaaS companies have compressed sales cycles from 60 to 38 days using Facebook retargeting.
Formula: Pipeline Velocity = (Number of SQLs × Win Rate × Average Deal Size) ÷ Sales Cycle Length
2026 Benchmark: 84-day average sales cycle
Tag paid social leads in your CRM and monitor their movement through each sales stage. Use attribution windows of 7-day view and 30-day click to capture assisted conversions. Export weekly performance data and compare it with CRM deal progression reports to uncover velocity trends.
Do not attribute every velocity improvement only to paid social when product changes or sales process updates also play a role. SaaSHero’s TestGorilla campaign reached an 80-day CAC payback period by targeting prospects who showed faster buying behavior.
3. MQL-to-SQL Conversion Rate: Proving Lead Quality
The MQL-to-SQL conversion rate measures the quality of Facebook-generated marketing qualified leads. High conversion rates signal strong targeting and clear messaging, while low rates reveal wasted spend on poor-fit prospects. PPC traffic shows 26% MQL-to-SQL conversion rates, with wide variation based on targeting accuracy.
Formula: MQL-to-SQL Rate = (Sales Qualified Leads ÷ Marketing Qualified Leads) × 100
2026 Benchmark: 15-25% for B2B SaaS
Use lead scoring in your CRM to qualify Facebook leads using demographic and behavioral signals. Build separate Facebook campaigns for each buyer persona and track conversion rates by audience segment. Apply Facebook’s detailed targeting to match your ideal customer profile traits.
Avoid optimizing campaigns only for lead volume while ignoring qualification rates. SaaSHero’s flat retainer delivers these metrics—Book a discovery call to implement accurate lead scoring and audience segmentation.
|
Metric |
Formula |
2026 Benchmark |
SaaSHero Result |
|---|---|---|---|
|
Cost Per SQL |
Ad Spend ÷ SQLs |
$150-$300 |
10x reduction (Playvox) |
|
Pipeline Velocity |
(SQLs × Win Rate × Deal Size) ÷ Cycle Time |
84 days |
80 days (TestGorilla) |
|
MQL-to-SQL Rate |
(SQLs ÷ MQLs) × 100 |
15-25% |
26% average |
4. Pipeline Contribution Percentage: Proving Channel Impact
Pipeline contribution percentage shows how much of your total sales pipeline comes from paid social ads. This metric supports budget requests and guides channel mix decisions. Pipeline influence calculations show how campaigns touch pipeline opportunities, with strong programs driving 30-50% of total pipeline value.
Formula: Pipeline Contribution % = (Paid Social Pipeline Value ÷ Total Pipeline Value) × 100
2026 Benchmark: 30-50% for primary paid channels
Configure multi-touch attribution in your CRM to track paid social’s role in each deal. Use assisted conversions reports with CRM pipeline views to find deals influenced by paid social touchpoints. Align attribution windows with your real sales cycle length.
Avoid last-click attribution that undervalues paid social’s role in starting and nurturing deals. SaaSHero’s TripMaster campaign generated $504,758 in Net New ARR through revenue-focused paid media.

5. CAC Payback Period: Guardrail for Capital Efficiency
CAC payback period shows how quickly paid social investments return through customer revenue. This metric shapes cash flow planning and investor confidence for funding and growth. B2B SaaS benchmarks target 6-12 months CAC payback, with 18-24 months signaling risk.
Formula: CAC Payback = (Paid Social Ad Spend ÷ New Customers) ÷ Monthly Gross Margin Per Customer
2026 Benchmark: 80 days for efficient B2B SaaS
Calculate CAC payback by dividing total paid social spend by new customers, then dividing that figure by monthly recurring revenue minus cost of goods sold. Track monthly cohorts to spot payback trends and seasonal shifts.
Do not ignore sales and marketing overhead or use gross revenue instead of gross margin. SaaSHero helped TestGorilla reach an 80-day CAC payback period that supported their $70M Series A round.
6. Assisted Conversions: Capturing Multi-Touch Influence
Assisted conversions quantify paid social’s role in deals that close through other channels. This metric prevents under-reporting of paid social value and informs budget allocation. Proper multi-touch attribution shows 40-60% more pipeline value from Facebook compared to native reporting.
Formula: Assisted Conversion Rate = (Deals with Paid Social Touchpoints ÷ Total Deals) × 100
2026 Benchmark: 25-40% for integrated campaigns
Use attribution tools with CRM tracking to find deals that include paid social touches. Implement view-through conversion tracking with longer attribution windows. Build custom audiences from CRM data to support closed-loop attribution.
Avoid double-counting conversions across channels and choose attribution windows that match real buyer behavior. SaaSHero’s flat retainer delivers these metrics—Book a discovery call to set up accurate multi-touch attribution.
7. Pipeline ROAS: Revenue per Paid Social Dollar
Pipeline ROAS measures pipeline value created for every dollar of paid social ad spend. Traditional ROAS only counts closed deals, while pipeline ROAS includes all qualified opportunities for a forward-looking view. Pipeline ROAS evaluates channel performance by pipeline produced per dollar spent.
Formula: Pipeline ROAS = Total Pipeline Value from Paid Social ÷ Paid Social Ad Spend
2026 Benchmark: 3:1 to 5:1 pipeline value to ad spend
Calculate pipeline ROAS by summing the value of all opportunities that started from paid social, then dividing by total paid social spend. Refresh this calculation monthly as deals advance through pipeline stages.
Exclude unqualified leads from pipeline value and apply deal probability scores. SaaSHero’s revenue-first approach centers on pipeline ROAS instead of vanity metrics, which produces measurable impact across multiple B2B SaaS verticals.
CRM Integration and Paid Social Execution Tips
Accurate pipeline efficiency tracking depends on clean integration between paid social platforms and your CRM. Implement GCLID passthrough so Salesforce or HubSpot can capture paid social click identifiers. Conversions API implementation can recover over 50% of untracked browser-side conversions, which supports precise pipeline value tracking.
Use automated negative keyword lists to stop spend on irrelevant searches. Schedule weekly pipeline reports to Slack so revenue teams see performance in real time. Feed first-party CRM data into custom audiences and exclusion lists for sharper targeting.
SaaSHero’s embedded team model keeps these integrations configured and maintained, unlike percentage-of-spend agencies that lack incentive for deep technical work. The flat-fee model includes ongoing CRM optimization and pipeline reporting as part of the engagement.
FAQ
How to measure paid social effectiveness in B2B SaaS pipeline
Measure three core metrics: Cost Per SQL (target $150-$300), Pipeline Velocity (target 84 days or less), and CAC Payback Period (target 80 days). These metrics tie directly to revenue growth instead of impressions or clicks. SaaSHero tracks them through CRM reporting that connects paid media spend to closed-won revenue.
Ideal MQL-to-SQL conversion rate for 2026
The benchmark MQL-to-SQL conversion rate for B2B SaaS sits between 18-22%, with top campaigns reaching 25% or higher. This rate depends on accurate lead scoring and precise targeting. Companies using intent-based targeting and strong qualification usually outperform those chasing lead volume.
Best CRMs for Facebook pipeline metrics tracking
HubSpot and Salesforce offer the strongest Facebook ads integrations, including GCLID passthrough, custom attribution reports, and automated lead scoring. Both platforms support closed-loop attribution that connects Facebook clicks to closed-won revenue. SaaSHero specializes in configuring these setups for full pipeline visibility.
Why B2B SaaS teams should replace CTR with pipeline KPIs
Click-through rate and similar vanity metrics do not reflect revenue or business growth. A campaign can show high CTR while driving low-quality leads that burn budget. Pipeline-focused KPIs like Cost Per SQL and Pipeline ROAS measure business impact and guide budget and creative decisions.
Timeline to see pipeline results from paid social ads
B2B SaaS companies usually see early pipeline activity within 30-60 days of launch, with clear revenue impact within 90-120 days. The exact timing depends on sales cycle length, average deal size, and how quickly campaigns improve. SaaSHero’s senior-led management shortens this timeline through fast testing and iteration.
Get SaaSHero’s free audit—Book a discovery call to apply these pipeline efficiency metrics to your paid social campaigns.
Conclusion: Turning Paid Social into a Predictable Pipeline Engine
These seven B2B SaaS paid social metrics create a clear framework for revenue-focused optimization in 2026. Cost Per SQL, Pipeline Velocity, MQL-to-SQL conversion rates, Pipeline Contribution, CAC Payback Period, Assisted Conversions, and Pipeline ROAS replace vanity metrics with actionable insight.
SaaSHero operates as a revenue-first agency with more than $30M in managed ad spend, $1,250 monthly retainers, and case studies like TripMaster’s $504,758 ARR growth. The flat-fee, month-to-month model aligns agency success with your pipeline performance and turns paid social into a predictable revenue channel.

Book a SaaSHero strategy call now to roll out these pipeline efficiency metrics and accelerate B2B SaaS growth. The senior-led team brings the paid media and CRM expertise required to maximize paid social ROI in today’s capital-efficient market.