

Written by: Aaron Rovner, Founder, Saas Hero | Last updated: June 10, 2026
Key Takeaways for 2026 Insurtech Growth
- Insurtech marketing metrics such as CAC, LTV:CAC, Quote-to-Bind rate, policy retention, and Gross Loss Ratio connect acquisition spend to profitable policy growth and must align marketing, underwriting, and finance.
- Investors in 2026 expect proof of unit-economic viability, so marketing leaders must connect every acquisition dollar to Net New Premium and renewal profitability instead of vanity metrics.
- The Measure-Benchmark-Optimize framework replaces generic KPIs with a repeatable, revenue-aligned system across data pipelines, industry benchmarks, and spend reallocation.
- Personal and commercial lines require different CAC thresholds and tactics, and Quote-to-Bind rates plus loss ratios reveal channel-to-product fit and cohort quality.
- Book a discovery call with SaaSHero to replace vanity metrics with a revenue-aligned insurtech measurement framework and uncover where measurement gaps are limiting premium growth.
Why Insurtech Marketing Leaders Must Prove Unit-Economic Viability in 2026
Capital markets have tightened materially since the first wave of insurtech expansion. Investors no longer accept growth narratives built on quote volume or impression counts. Houlihan Lokey’s 2026 InsurTech update frames the industry in three versions: high and volatile CAC in version 1.0, sustainable and predictable CAC in version 2.0, and customer ownership through multi-channel digital journeys in version 3.0. Most D2C and embedded carriers now sit in the transition from version 2.0 to 3.0, so marketing leaders must prove that every acquisition dollar ties directly to Net New Premium and renewal profitability.
Rising paid CAC increases that pressure. Aggregated 2026 data shows consumer insurance paid CAC exceeding blended CAC, which exposes how much spend lands on unqualified traffic. Legacy agencies that bill on a percentage of spend have a structural incentive to keep budgets high regardless of policy outcomes.
Core Metrics and the Measure-Benchmark-Optimize Framework
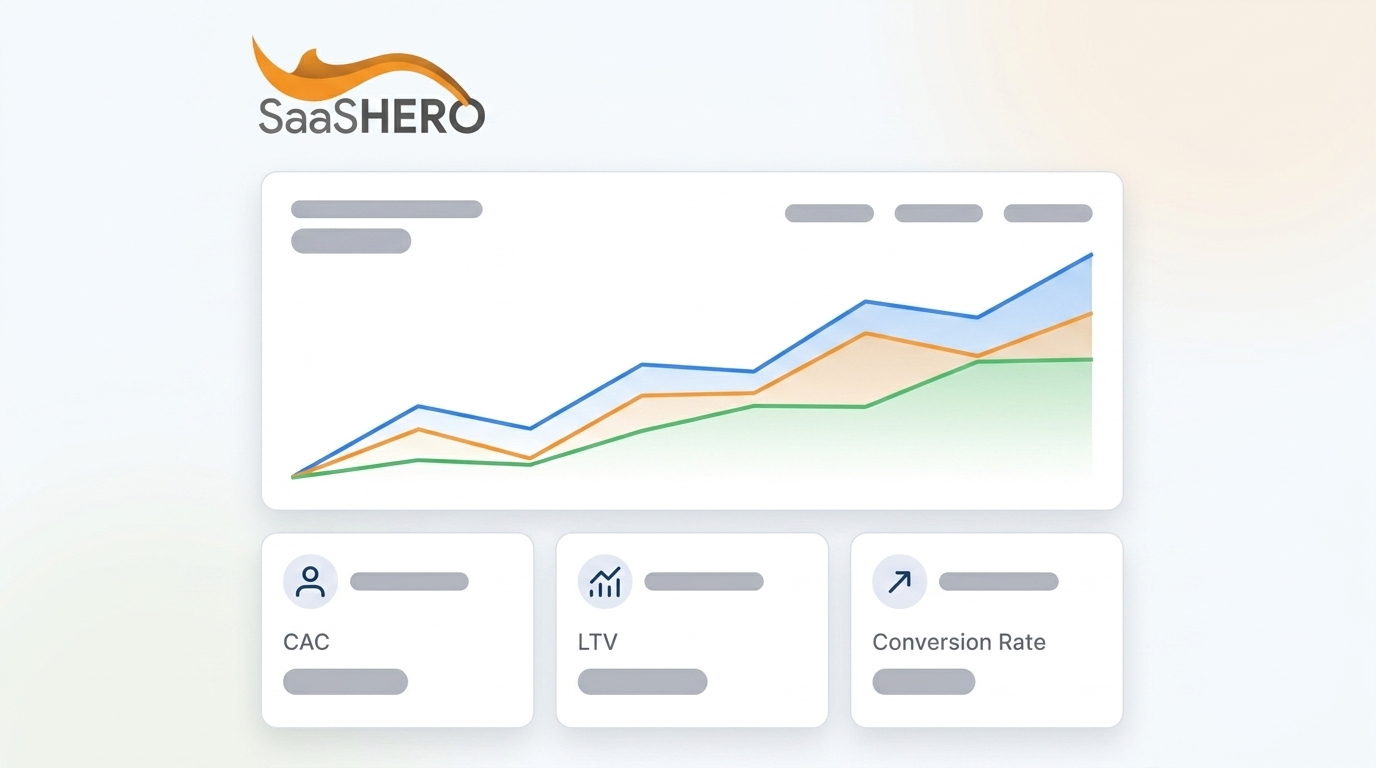
Five metrics form the foundation of any credible insurtech marketing dashboard.
- CAC: Total acquisition spend divided by new policyholders bound in the period.
- LTV:CAC: Gross-margin-weighted lifetime value relative to acquisition cost, and the primary unit-economic signal for investors.
- Quote-to-Bind Rate: Percentage of initiated quotes that convert to bound policies, segmented by product line and channel.
- Policy Retention Rate: Renewal cohort performance that expands Gross Written Premium without incremental CAC.
- Gross Loss Ratio: Incurred losses divided by earned premium, which validates or invalidates the quality of acquired cohorts.
The Measure-Benchmark-Optimize framework applies these metrics in sequence. Measure creates clean data pipelines from ad platforms through CRM to policy administration. Benchmark compares current performance against 2026 industry ranges by line of business. Optimize reallocates spend toward channels and segments that deliver stronger LTV:CAC and loss-ratio outcomes.
Insurtech Demand Channels and Agency Economics in 2026
D2C carriers now source demand primarily through Google paid search, comparison aggregators, and increasingly LinkedIn for commercial lines. J.D. Power’s 2025 U.S. Insurance Digital Experience Study found that 47% of auto insurance shoppers now purchase through digital channels, which makes paid search the highest-volume acquisition lever for personal lines. Embedded carriers rely on API-driven distribution, and embedded insurance sold through mobile APIs can materially reduce CAC while improving conversion rates compared to traditional channels.
The agency model often mirrors broader B2B marketing dysfunction. Percentage-of-spend billing creates an incentive to maximize budget rather than minimize CAC. Insurance CPLs commonly range from $35–$200 depending on sub-vertical and channel, with $100–$200 considered typical rather than frequently exceeding $150–$300 as traditional providers compete against heavily funded insurtechs for the same high-intent clicks. A flat-fee, month-to-month performance partner removes this conflict of interest and ties agency survival directly to policy growth outcomes.
Key Strategic Decisions and Trade-Offs
Understanding the demand landscape and agency economics sets the stage for the strategic choices that determine whether acquisition spend converts to profitable growth. Personal lines and commercial lines require different CAC thresholds. Personal auto operates on thin margins and high volume, so sub-$300 CAC usually keeps payback periods under 12 months. Commercial lines carry higher premiums and longer policy tenures, which can justify CAC in the $800–$1,200 range when LTV is modeled correctly.
Quote-to-Bind optimization and volume scaling often compete for attention. Eighty-four percent of insurance leads abandon at the full quote-to-bind stage, which represents the highest abandonment rate of any sector. Scaling quote volume without fixing form friction increases abandonment instead of policies. Prefill and form simplification approaches can improve quote completion rates, speed up processing, and reduce data errors.
Gross Loss Ratio belongs inside the marketing dashboard. Cohorts acquired through low-quality channels or misleading creative tend to produce higher loss ratios. Lemonade has improved its gross loss ratio by combining AI-based risk assessment with better-matched acquisition targeting, which shows a direct link between marketing quality and underwriting outcomes.
2026 Benchmark Ranges by Line of Business
| Metric | Personal Lines (Auto/P&C) | Commercial Lines |
|---|---|---|
| Blended CAC | Varies by channel and carrier efficiency | Varies by policy, often higher than personal lines |
| LTV:CAC Ratio | 3:1 minimum viable | 4:1 or higher often targeted |
| Quote-to-Bind Rate | Ranges from 10% (auto) to 50%+ (commercial) | Averages 20%, with top teams above 25% |
| CAC Payback Period | Under 12 months often considered healthy | Under 18 months, with longer periods raising concerns |
Insurtech Measurement Readiness and Maturity Model
Most insurtech marketing teams struggle at the Measure stage before they reach benchmarking. Three readiness dimensions determine whether the framework can function.
Data quality: Ad platform click IDs such as GCLIDs and LinkedIn Insight Tags must pass through quote forms into the policy administration system. Without this connection, optimization defaults to last-click attribution, which misattributes bind events to the final touchpoint instead of the channel that initiated the quote.
CRM integration: Platforms such as GoodData enable dashboards that track quote-to-bind conversion rate by product line and agent, along with policy inquiries by source and lead-to-quote conversion. Without CRM-to-ad-platform feedback loops, CAC calculations remain estimates.
Cross-functional alignment: Houlihan Lokey identifies managing acquisition and retention as one revenue system, not separate funnels, as a defining characteristic of mature insurtech operators. Marketing, underwriting, and finance need a single shared dashboard with agreed metric definitions.
Common Pitfalls and Diagnostic Questions
Optimizing for quote volume only. High quote volume with low bind rates inflates CAC and signals poor channel-to-product fit. Diagnostic: What is the Quote-to-Bind rate by campaign, and how does it compare to the industry benchmarks outlined earlier?
Ignoring downstream loss ratio. Channels that produce cheap policies may also produce high-loss cohorts. Diagnostic: Has the marketing team reviewed Gross Loss Ratio segmented by acquisition channel in the last 90 days?
Last-click attribution. Tracking quote-to-bind conversion by product line, channel, and campaign represents the minimum standard. Last-click models systematically undervalue comparison-site and social touchpoints that initiate high-intent journeys. Diagnostic: Does the current attribution model connect ad impressions to bound policies, or only to quote starts?
Three Insurtech Team Archetypes and Their Measurement Constraints
Series A founder-led carrier. Marketing sits with the founder or a generalist growth hire. CAC is tracked in a spreadsheet, and Quote-to-Bind is not segmented by channel. The primary constraint is data infrastructure, because no CRM-to-ad-platform integration exists. Priority action: implement click-ID passthrough before scaling spend.
Series B growth-stage insurtech. A VP of Marketing manages a $50k–$150k monthly budget across Google and comparison aggregators. Series B companies sit at a critical LTV:CAC inflection point where extended payback periods can increase the likelihood of down-rounds. The constraint is agency misalignment, because the incumbent agency reports on CPL instead of bound policies. Priority action: replace percentage-of-spend billing with a flat-fee partner that reports on Net New Premium.
Mature carrier digital unit. An established carrier runs a dedicated digital team across multiple acquisition channels. Data infrastructure exists, but marketing and underwriting operate in separate reporting silos. The constraint is organizational, since teams have tools but lack a shared accountability framework. Priority action: establish a unified dashboard with agreed metric definitions across marketing, underwriting, and finance.
Frequently Asked Questions
What is a healthy LTV:CAC target for an insurtech in 2026?
The minimum viable threshold is 3:1, calculated on gross-margin contribution rather than gross revenue. Investors evaluating Series A and B rounds now expect 4:1 or higher measured at the cohort level. A blended 4:1 ratio that hides recent cohorts trending toward 2:1 will raise concerns during due diligence. Personal-lines carriers with shorter policy tenures should target 3:1–3.5:1, while commercial-lines operators with multi-year renewals can justify 4:1–5:1 given higher per-policy LTV.
How do you set up real-time tracking of insurtech marketing KPIs?
Real-time tracking relies on three connected layers. First, pass click IDs from every ad platform through quote forms into the CRM or policy administration system. Second, configure the CRM to push bind events and premium values back to the ad platforms for value-based bidding. Third, build a unified dashboard using tools such as Improvado, GoodData, or Looker Studio that aggregate data across channels and surface CAC, Quote-to-Bind rate, and Gross Loss Ratio in a single view. Tier 1 metrics such as answer rate and abandonment rate should be reviewed hourly during high-volume enrollment periods, while CAC and LTV:CAC should be reviewed weekly at the cohort level.
What tactics improve Quote-to-Bind rates without sacrificing volume?
The highest-impact tactic is form simplification using prefill and reduction techniques, which can improve quote completion rates. Beyond form design, message match between the ad creative and the quote landing page reduces abandonment at the first step. Segmenting Quote-to-Bind by channel and product line reveals which sources produce browsers versus buyers, which supports budget reallocation toward high-bind channels without reducing total quote volume. AI-driven creative optimization, similar to the approach that produced a 31% lift in quote starts for one major carrier, can further improve top-of-funnel quality.
How does acquisition channel quality affect renewal profitability?
Cohorts acquired through mismatched channels or aggressive discounting tend to churn at renewal and produce higher loss ratios. Carriers that track Gross Loss Ratio by acquisition cohort consistently find that the cheapest-to-acquire customers are not the most profitable to retain. Embedding loss-ratio data into the marketing dashboard enables spend reallocation toward channels that produce lower-loss, higher-retention cohorts, which expands Gross Written Premium without proportional CAC increases. Lemonade’s improvement in its gross loss ratio illustrates the compounding effect of aligning acquisition targeting with underwriting risk selection.
Which tools support insurtech-specific marketing measurement in 2026?
Guidewire provides unified underwriting command centers that support faster quote-to-bind cycles and reduce leakage. GoodData and Improvado handle multi-channel dashboard aggregation with product-line segmentation across auto, home, life, and commercial. Quantum Metric supports digital experience analytics that identify where quote abandonment occurs in the funnel. AgentTech’s Publisher Queue billing integrates publisher cost-per-call rates with disposition-based conversion tracking for call-center-heavy acquisition models. CRM platforms such as HubSpot and Salesforce act as the connective tissue between ad-platform click data and bound-policy outcomes.
Run an Internal Audit Before Engaging a Specialized Performance Partner
The Measure-Benchmark-Optimize framework delivers the most value as a pre-engagement diagnostic. Before selecting a performance partner, insurtech marketing leaders should audit three questions that reveal whether the measurement foundation can support improvement. First, does current tracking connect ad clicks to bound policies, or only to quote starts? Without end-to-end attribution, teams cannot calculate true CAC. Second, are CAC and Quote-to-Bind segmented by product line and channel, or reported as blended averages? Blended metrics hide which channels drive profitable growth. Third, does the marketing dashboard include Gross Loss Ratio, or does underwriting data live in a separate silo? Separated data prevents teams from connecting acquisition quality to underwriting outcomes.
If any answer is no, the first engagement priority is infrastructure, not spend scaling. A $50 lead closing at 5% costs $1,000 per customer, while a $200 lead closing at 35% costs $570, and the measurement gap between those two scenarios often separates a profitable book from a capital-destroying one.
SaaSHero’s flat-fee, month-to-month model fits this environment. There are no percentage-of-spend incentives that inflate budgets, no 12-month lock-in contracts that protect mediocre performance, and no vanity-metric dashboards that obscure policy economics. Senior-led execution ensures the strategist who scopes the engagement also optimizes the campaigns. Reporting anchors to Net New Premium and LTV:CAC, not impressions and CTR, which matches the revenue-first language that satisfies investors and underwriting leadership.