

Written by: Aaron Rovner, Founder, Saas Hero
Key Takeaways for 2026 B2B SaaS Ad Reporting
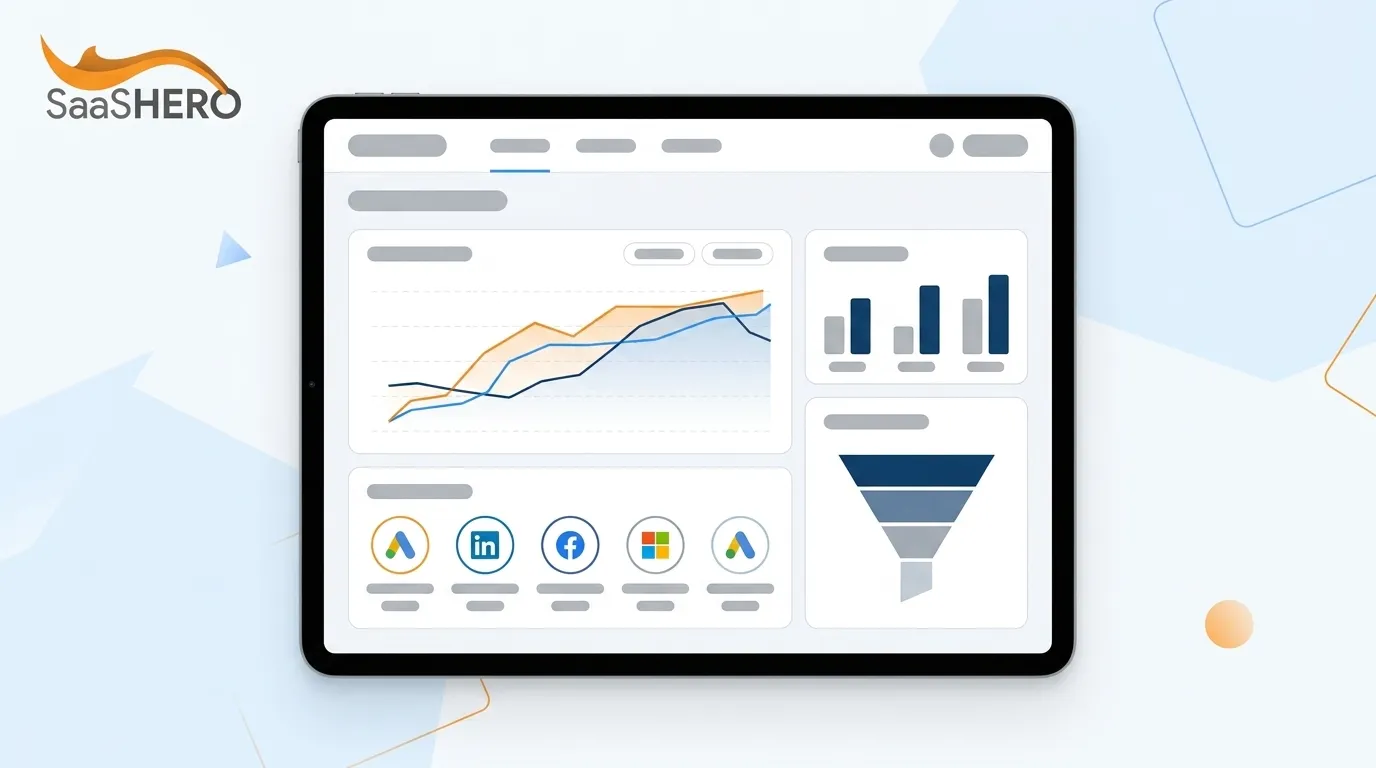
- Unified adtech reporting dashboards pull data from Google, Meta, LinkedIn, and CRM systems to tie ad spend to closed-won revenue and Net New ARR.
- Real-time ROAS tracking with CRM integration replaces delayed batch exports and last-click attribution, so teams can measure true cross-channel performance.
- Median CAC payback for B2B SaaS companies reached 15 months in 2025/2026, which makes precise attribution a board-level requirement under capital-efficiency mandates.
- Teams move through a four-stage maturity model, from fragmented platform reports to revenue-attributed dashboards with AI anomaly detection and automated board reporting.
- SaaSHero builds and manages revenue-focused adtech reporting dashboards for B2B SaaS teams on a flat monthly retainer, and you can book a discovery call to audit your current reporting gaps.
Why Unified Adtech Reporting Dashboards Matter in 2026
Capital markets have raised the performance bar for SaaS marketing. The growth-at-all-costs era has ended, and investors now scrutinize CAC payback, LTV:CAC ratio, and Net New ARR as primary indicators of business health. Gartner’s 2025 CMO Spend Survey found marketing budgets flatlined at 7.7% of company revenue, with 63% of CMOs naming budget constraints as their top challenge for 2026. Every dollar of ad spend must be defensible.
Manual spreadsheets and last-click attribution models cannot meet this standard. 74.5% of marketers are moving away from or would like to move away from last-click attribution because it does not paint a full picture of impacts on conversions. That model systematically undervalues upper-funnel channels like LinkedIn and display while over-crediting brand search. Budget then shifts away from awareness campaigns that quietly drive pipeline and toward bottom-funnel keywords that capture demand instead of creating it.
Marketing teams commonly lose 10–20 hours per week on manual data export, cleaning, and spreadsheet-based reporting when ad platforms and CRMs remain disconnected. That operational drag compounds into strategic blindness. Without a unified view, teams cannot calculate true CAC by channel or measure pipeline velocity. They also cannot answer the question a CFO or investor will always ask: which campaigns are generating closed revenue.
The shift from vanity metrics to revenue outcomes now defines mature B2B SaaS marketing operations. A large majority of B2B teams still struggle to connect early-funnel activity to closed revenue, which creates a measurable competitive disadvantage for any team that continues to report on impressions and CTR.
Once you recognize this gap, the next step is to choose a solution architecture that closes it for your team.
Key Strategic Decisions for Your 2026 Dashboard Stack
Tool selection: commercial, open-source, or custom. Commercial platforms such as Improvado, DashThis, and Looker Studio offer pre-built connectors and managed infrastructure. These proprietary commercial BI tools provide robust governance features including RBAC, SSO, row-level security, and 1,000+ pre-built connectors. That convenience comes with higher licensing cost and reduced code-level flexibility.
Teams that want to avoid those licensing fees often consider open-source options like Apache Superset, which reduce direct licensing costs but introduce significant hidden engineering overhead. Security patching, version management, connector development, and infrastructure provisioning all require ongoing effort. Open source may reduce short-term licensing costs but increases operational overhead for DevOps and support teams, requiring organizations to act as software companies with product management responsibilities. That burden often exceeds commercial licensing costs once engineering time is fully accounted for.
Custom builds offer maximum flexibility and full control over the stack. They also require a minimum of one FTE programmatic specialist plus 0.5 FTE data analyst to sustain, which makes them realistic only for teams with dedicated analytics headcount and stable requirements.
Data architecture: real-time streaming vs batch. In 2026, batch processing functions as a subset of streaming, which enables always-on adtech dashboards that continuously ingest campaign events from Google, Meta, and LinkedIn. Teams that need intraday budget decisions typically use a streaming architecture with Apache Kafka and Flink or Spark Structured Streaming. Real-time analytics can fail for smaller companies when data quality and governance are weak. Teams should validate data governance maturity before committing to real-time infrastructure and can start with scheduled batch updates if needed.
AI anomaly detection readiness. BARC’s 2026 Trend Monitor ranks data quality management as the top priority for data-driven organizations. AI anomaly detection delivers value only when metric definitions and data sources are consistent. Deploying ML models on inconsistent data produces contradictory insights, erodes trust, and reduces adoption. Strong governance should come first, followed by anomaly detection.
White-label reporting for agencies. Many buyers now expect in-app reporting capabilities. White-label dashboard delivery has become a competitive requirement for agencies that manage client accounts and want to show value inside the client’s existing tools.
These strategic choices become clearer when you compare legacy spreadsheet workflows with modern 2026 adtech stacks.
Legacy Spreadsheets vs Modern 2026 Adtech Stacks
Legacy reporting workflows follow a common failure pattern. Data lives in platform-native exports, gets manually combined in spreadsheets, and reaches leadership days or weeks after the events it describes. Dashboards that require manual weekly updates function as static reports rather than true real-time attribution tools. By the time a budget decision is made, the underlying campaign conditions have already changed.
Modern 2026 stacks replace this workflow with automated pipelines that ingest data from all ad platforms, normalize it against a consistent schema, and surface it in a live dashboard connected to CRM deal stages. Marketing teams benefit from real-time campaign data integration with 5-minute latency for performance monitoring, ad fraud detection, and dynamic budget allocation. AI-powered anomaly detection flags spend spikes, conversion rate drops, and attribution gaps before they compound into wasted budget. Beyond the time savings mentioned earlier, automation delivers better attribution accuracy by removing transcription errors and version-control issues that appear in manual spreadsheets.
The CRM integration layer creates the real advantage. When teams pass Google Click IDs (GCLIDs) and LinkedIn insight tags through to HubSpot or Salesforce, they can attribute closed-won revenue back to the specific campaign, ad group, and keyword that initiated the journey. This approach replaces last-click guesswork with actual deal data and supports more confident budget reallocation.
Four Stages of Adtech Reporting Dashboard Maturity
B2B SaaS teams usually move through four stages of reporting maturity.
Stage 1: Fragmented. Teams rely on platform-native dashboards only. Google Ads, Meta Ads Manager, and LinkedIn Campaign Manager each live in separate tabs with no cross-channel view. Attribution defaults to last-click. Reporting is manual and weekly at best.
Stage 2: Consolidated. A tool like Looker Studio or DashThis pulls data from multiple platforms into a single view. Metrics appear side by side but remain unnormalized. Attribution windows differ by platform, which creates variance in reported metrics due to timezone differences and different deduplication logic. CRM data is still missing.
Stage 3: Pipeline-connected. Ad platform data joins to CRM pipeline data. MQL-to-SQL conversion rates, pipeline created by channel, and CAC by source become visible. Automated alerts flag anomalies, and UTM taxonomy is enforced. This stage removes most manual reporting work and supports more accurate budget decisions.
Stage 4: Revenue-attributed. Closed-won revenue and Net New ARR are attributed back to campaigns with multi-touch models. Offline conversion tracking sends downstream events such as SQLs, opportunity creation, and closed-won deals back to ad platforms. That feedback loop lets algorithms optimize against revenue signals instead of lead volume. AI anomaly detection runs continuously, and board-level reporting is automated.
Most B2B SaaS teams without a dedicated analytics partner sit at Stage 1 or Stage 2. SaaSHero’s implementation process moves clients from their current stage to Stage 3 or Stage 4, with CRM integration and revenue attribution included in the standard engagement.

Book a discovery call to identify your current maturity stage and scope the work required to reach Stage 4.
Common Reporting Pitfalls and Quick Diagnostics
Poor negative keyword hygiene. Navigational searches, such as users looking for a competitor’s login page, inflate click volume and waste budget on zero-intent traffic. Diagnostic question: Are competitor brand terms without intent modifiers like pricing, alternatives, or vs excluded from your campaigns.
Attribution window mismatches. Summing platform-reported conversions inflates totals because each platform applies its own counting rules, leading to 150-400% over-reporting in aggregate attributed revenue when the same conversion is credited across platforms with overlapping attribution windows. Diagnostic question: Are your attribution windows standardized across Google, Meta, and LinkedIn before you aggregate conversion data.
Over-reliance on platform-native reports. Platform dashboards are designed to show each platform in the best possible light. They do not show cross-channel frequency overlap and do not connect to CRM revenue data. Fragmentation creates duplicated workflows, inconsistent definitions of audiences and outcomes, and limited clarity about where value is added versus where cost accumulates. Diagnostic question: Can you calculate true CAC by channel using closed-won CRM data instead of platform-reported conversions.
Inconsistent UTM taxonomy. Lack of data governance creates inconsistent naming conventions and tracking parameters across platforms, resulting in messy, untrustworthy multi-touch attribution reporting. Diagnostic question: Is there a documented, enforced UTM naming convention that your team applies consistently across every campaign and channel.
Vanity-metric reporting to leadership. An ANA analysis found programmatic ad waste grew 34% in two years because those systems measured impressions and CTR instead of revenue. When teams optimize for clicks instead of closed deals, they push budget into channels that generate activity but not customers. Diagnostic question: Does your current dashboard show pipeline created, CAC payback, and Net New ARR attributed to paid channels.
Team Archetypes That Gain the Most from Unified Dashboards
The overwhelmed founder-led team. A SaaS founder who manages Google Ads on weekends while running the business rarely has time to build a proper attribution stack. Spreadsheet exports pile up, and budget decisions rely on gut feel. SaaSHero’s Dedicated Campaign Manager tier ($1,250 per month for up to $10k in spend, month-to-month) gives this team professional dashboard management and CRM-connected reporting without a 12-month contract or a percentage-of-spend fee that encourages waste. The founder hands off execution and keeps strategic visibility through weekly performance updates in a shared Slack channel.
The frustrated VP of Marketing at a Series B company. This leader often manages a $50k per month ad budget and receives monthly PDFs of impressions and CTR from an agency, while the CEO asks about pipeline and CAC. The agency avoids revenue attribution because its percentage-of-spend model does not reward efficiency. SaaSHero’s Full Marketing Team tier ($4,500 per month for $50k+ spend) replaces that model with flat-fee pricing, HubSpot or Salesforce integration, and board-ready reporting anchored in Net New ARR. That approach matches the language used in SaaSHero’s case study results, including $504,758 in Net New ARR for TripMaster and an 80-day CAC payback period for TestGorilla.

FAQ: Budget, Timeline, Ownership, and Success Metrics
What should a B2B SaaS team budget for a unified adtech reporting dashboard?
Budget depends on the implementation path. A commercial platform like Improvado or DashThis carries monthly licensing fees that scale with data source count and user seats. As noted in the decision framework above, the engineering overhead of open-source tools often exceeds commercial licensing fees when fully accounted for. Agency-managed dashboards, such as those built and maintained by SaaSHero, bundle the tooling, data architecture, CRM integration, and ongoing optimization into a flat monthly retainer starting at $1,250 per month. For most B2B SaaS teams at the $500k–$10M ARR stage, the agency-managed model delivers faster time-to-value and lower total cost of ownership than an in-house build.
How long does it typically take to implement a revenue-attributed adtech dashboard?
A basic consolidated dashboard that pulls from two or three ad platforms into Looker Studio can be operational within one to two weeks. A full Stage 4 implementation with CRM integration, multi-touch attribution, GCLID passthrough to HubSpot or Salesforce, offline conversion tracking back to ad platforms, and automated anomaly alerts usually requires four to eight weeks. Timeline depends on the complexity of the existing tech stack and the quality of historical data. The most common delay comes from data governance remediation, which includes enforcing UTM naming conventions and resolving attribution window mismatches across platforms before the pipeline is built. SaaSHero’s onboarding process includes a tracking audit and setup as part of the initial engagement, covered by a one-time setup fee.
Who should own dashboard maintenance after implementation?
Dashboard maintenance requires ongoing attention to connector health, schema changes from ad platforms, UTM compliance monitoring, and attribution model updates as the business evolves. In-house ownership works well when a dedicated marketing operations or data analyst role has bandwidth to monitor data quality daily. For most B2B SaaS teams without a dedicated analytics function, agency ownership is more reliable. SaaSHero maintains dashboards as part of its standard retainer, with weekly performance updates and bi-weekly strategy calls to keep the reporting layer aligned with campaign changes and CRM updates.
How do you measure dashboard success beyond vanity metrics?
A revenue-attributed dashboard performs well when it can answer four questions without manual work. What is CAC by channel this month. What is the pipeline value created by paid media this quarter. Which campaigns contributed to closed-won Net New ARR. Where is the funnel leaking between MQL and SQL. Secondary success indicators include time saved on manual reporting, reduction in attribution discrepancies across platforms, and the ability to present a defensible ROAS figure to leadership that ties to CRM closed-won data instead of platform-reported conversions. Vanity metrics such as impressions, CTR, and platform-reported conversions remain available as diagnostic drill-downs but should not appear in the headline executive view.
Conclusion: Run an Audit and Plan Your Next Reporting Move
The 2026 decision framework for adtech reporting dashboards centers on three choices. You need a tool architecture that matches your team’s engineering capacity, a data model that connects ad spend to CRM revenue, and an implementation partner that can execute without a 12-month lock-in or a percentage-of-spend conflict of interest. Fragmented platform-native reporting, manual spreadsheets, and last-click attribution do not stay neutral. They actively misallocate budget and block the CAC, LTV, and Net New ARR visibility that capital-efficient SaaS growth requires.
The practical next step is an internal audit. Identify which maturity stage your current stack occupies, document where attribution breaks down between ad click and closed-won deal, and quantify the weekly hours lost to manual reporting. That audit will surface the gaps that a unified dashboard must close.
SaaSHero builds and manages revenue-focused adtech reporting dashboards for B2B SaaS teams, with flat fees, month-to-month terms, senior leadership, and CRM integration included. The engagement structure means SaaSHero earns your business every 30 days based on results, not contract length.
Book a discovery call with a SaaSHero senior strategist to review your current reporting stack, identify the gaps, and map a path to Stage 4 revenue attribution.