

Key Takeaways
- B2B SaaS CAC ratios reached about $2 spent for every $1 in new ARR in 2025, so revenue-tied KPIs now matter more than surface metrics like clicks.
- Use a 7-step framework that audits tracking, defines KPIs such as 4-6x ROAS and 3-5x LTV:CAC, segments channels, and focuses decisions on Net New ARR.
- LinkedIn delivers strong ABM performance and high lead quality with 14-18% SQL rates, while Google Ads captures intent at scale with lower unit costs.
- Multi-touch attribution models such as linear or time-decay give more accurate revenue credit across long B2B sales cycles that often run 3-6 months.
- Ready to cut wasted spend by 30%? Schedule a free waste audit with SaaSHero to uncover your biggest budget drains.
Tools and Tracking You Need Before You Start
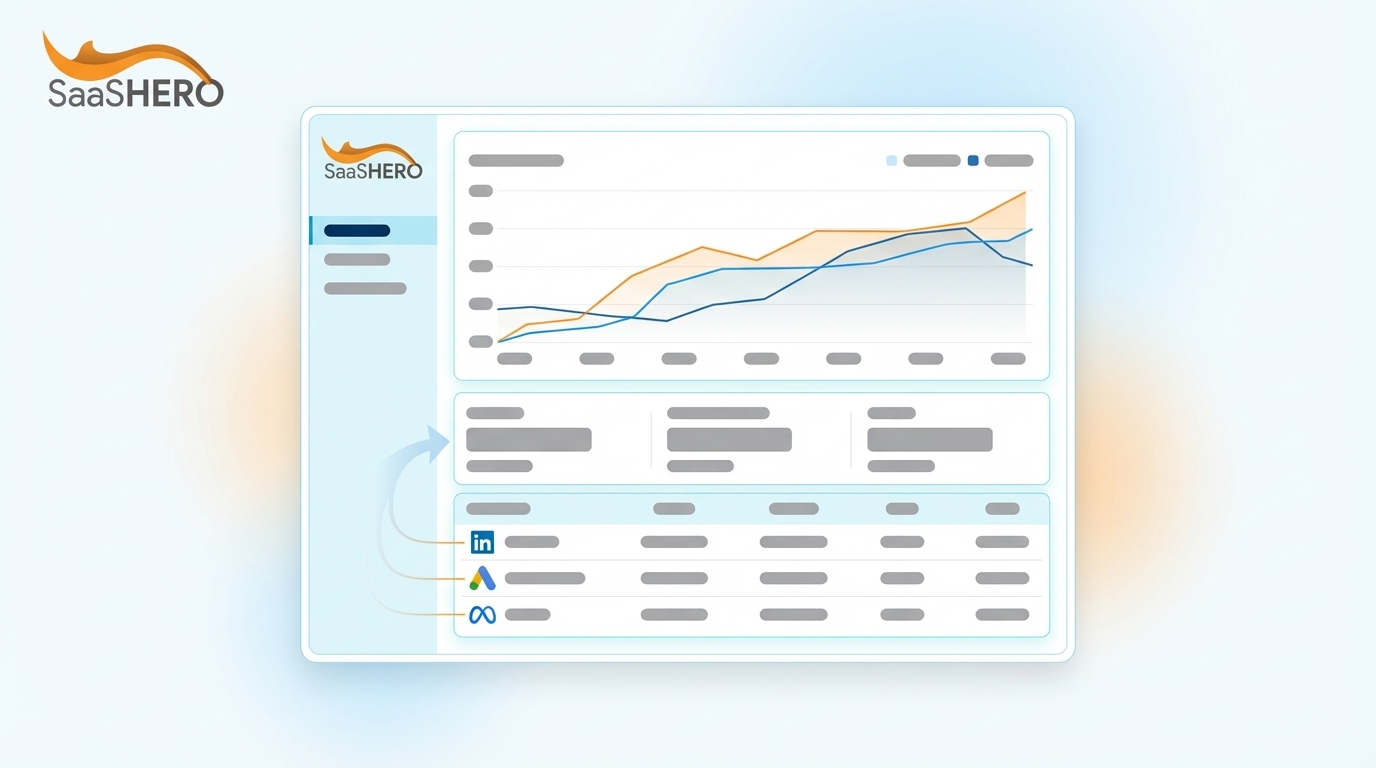
Set up your tools and tracking infrastructure before you evaluate any channel performance. You need Google Analytics 4, a CRM such as HubSpot or Salesforce, Google Ads Manager, LinkedIn Campaign Manager, and a data visualization tool like Looker Studio.
Configure GCLID tracking for Google Ads, keep UTM parameters consistent across every campaign, and integrate your CRM so lead data flows from first click through to closed-won revenue. This foundation enables accurate attribution modeling and revenue tracking across the entire customer journey. With this infrastructure in place, you can apply a structured framework that turns raw tracking data into clear revenue insights.
7-Step Revenue-First Framework for Paid Media
The 7-step revenue-first analysis framework connects paid media spend directly to business outcomes:
- Audit data setup and tracking infrastructure
- Define revenue-focused KPIs and benchmarks
- Segment channels by performance characteristics
- Calculate industry-specific benchmarks
- Build full-funnel attribution models
- Identify waste and optimization opportunities
- Optimize campaigns and iterate based on data
This systematic approach ensures every dollar spent ties back to pipeline impact and revenue generation. It shifts your focus from surface-level metrics to outcomes that actually grow the business.
Step 1: Audit Data Setup
Start with a complete audit of your tracking infrastructure. Confirm that GCLID auto-tagging is active in Google Ads and that UTM parameters follow a single, documented naming convention across all campaigns. Check that your CRM captures lead source data reliably and connects early touchpoints to closed-won deals.
Common gaps include missing offline conversion tracking, inconsistent UTM parameters between teams, and broken integrations between ad platforms and CRM systems. These disconnects create attribution blind spots that hide parts of the customer journey. To expose where data breaks down, document all data sources, tracking methods, and integration points in a structured way.
Run test campaigns and trace the data from ad click through lead creation to opportunity and final revenue. Many teams discover that 20-30% of attribution data disappears because of technical issues that this audit brings to light.
Step 2: Define Revenue KPIs
Shift your focus from vanity metrics to revenue-tied KPIs that drive business growth. The LTV:CAC ratio benchmark for B2B SaaS is 3-5x in 2026, which means customer lifetime value should reach three to five times the acquisition cost.
The table below shows how core revenue metrics behave across LinkedIn and Google Ads. It highlights the tradeoff between cost per lead, return on ad spend, and payback period so you can set realistic targets by channel.
| Metric | LinkedIn Benchmark | Google Ads Benchmark | Target Range |
|---|---|---|---|
| Cost Per Lead (CPL) | $75-$125 | $150-$300 | $250-$450 |
| ROAS | 113% | 200-500% | 4-6x |
| LTV:CAC Ratio | 3-5x | 3-5x | 3-5x |
| Payback Period | 80-120 days | 80-120 days | 80 days |
These benchmarks give guardrails for individual metrics, but they all support one goal, which is generating new revenue. Treat Net New ARR as your north star metric and track how much new annual recurring revenue each channel creates instead of focusing on lead counts or pipeline value alone.
Step 3: Segment Channels by Role in the Funnel
Assign each paid media channel a clear role in the B2B SaaS buyer journey. LinkedIn excels for awareness, thought leadership, and ABM targeting, while Google Ads captures bottom-funnel intent for product comparisons and competitor targeting.
The comparison below quantifies these differences. It shows how LinkedIn’s higher CPM and stronger SQL rates support quality-focused ABM, while Google’s lower costs and scale make it better for volume-driven plays.
| Channel | Best Use Case | Avg CPM | SQL Conversion Rate |
|---|---|---|---|
| LinkedIn Ads | ABM, Thought Leadership | $40-$100 | 14-18% |
| Google Search | High-Intent Keywords | $3.80-$7.60 CPC | 7-12% |
| Google Display | Retargeting, Awareness | $2-$5 | 3-5% |
| Meta Ads | Event Promotion, Retargeting | $10-$25 | 2-4% |
Segment your analysis by funnel stage, with LinkedIn and display ads driving top-funnel awareness and Google Search capturing bottom-funnel conversions. This structure prevents unfair comparisons between channels that play very different roles.
Step 4: Calculate Benchmarks for Your Situation
Establish baseline performance metrics using 2026 industry benchmarks. Paid ads average 200%-500% ROAS for B2B sales-led firms in 2026, with Google Ads baseline ROAS around 200% and LinkedIn often delivering two to three times higher lead quality than search.
Compare your current performance against these benchmarks to flag underperforming channels. Then adjust those comparisons for your average deal size, sales cycle length, and gross margins, because these factors change what “good” looks like. A SaaS company with $50k average deal values can support higher CPLs than a business closing $5k deals.
Document seasonal patterns and account for longer attribution windows in B2B SaaS, where the sales cycle often stretches 3-6 months from first touch to closed-won deal. This context keeps you from cutting channels that influence revenue later in the cycle.
Step 5: Build Full-Funnel Attribution
Linear attribution distributes equal revenue credit across every touchpoint in a B2B buyer journey, making it suitable for long and complex SaaS sales cycles. This multi-touch method usually produces more accurate insights than last-click attribution, which often undervalues top-funnel activities.
Match your attribution model to your sales cycle complexity. For sales cycles under 30 days, first-touch or last-touch attribution can work. For the longer 3-6 month cycles typical in B2B SaaS, consider time-decay models that give more weight to touchpoints near conversion, or position-based models that emphasize first touch, lead creation, and final conversion.
Configure attribution by mapping customer journey touchpoints, integrating your tech stack, and syncing conversion data via APIs so you can build complete revenue dashboards.
Struggling with complex attribution setup? Get expert help configuring your attribution model from SaaSHero’s team that specializes in CRM integrations and multi-touch attribution for B2B SaaS companies.

Step 6: Identify Waste and Opportunities
Use your data to find budget you can reallocate. Flag channels with high CPLs and low SQL conversion rates, because they often signal weak lead quality. Review keyword-level performance in Google Ads and remove broad match terms that drive unqualified traffic.
Common waste sources include targeting audiences that are too broad on LinkedIn, bidding on competitor brand terms without strong landing pages, and running display campaigns without frequency caps. Each of these issues spends budget on impressions or clicks that rarely convert. To cut this waste, use negative keyword lists aggressively and set audience exclusions that filter out low-intent traffic before it consumes spend.
Look for high-performing segments inside underperforming channels. A LinkedIn campaign might show weak overall ROAS but strong results for specific job titles or company sizes, which points to audience refinement instead of channel shutdown.
Step 7: Optimize and Iterate Around Revenue
Run a consistent optimization schedule with weekly performance reviews and monthly strategic check-ins. Test new ad creative, landing page variations, and audience segments while keeping tests large enough to reach statistical significance.
Prioritize optimization on channels and campaigns that drive the most Net New ARR, not just the lowest CPL or highest CTR. A campaign with higher costs but stronger lead quality often wins on ROI when you measure against closed-won revenue.
Record every change and its impact on revenue metrics. This history supports future budget planning and helps you spot seasonal trends or market shifts that influence channel performance.
How to Measure Results and Validate Your Model
Track success through a 20% reduction in wasted spend, stronger pipeline quality scores, and higher Net New ARR attributed to paid channels. Build weekly dashboards that show SQL progression, opportunity creation, and closed-won revenue by channel and campaign.
Validate your attribution model by comparing predicted revenue impact with actual closed deals. Adjust attribution windows and model weights based on your own sales cycle data instead of relying only on industry averages.
Set automated alerts for major performance swings and define clear escalation steps when channels fall below target thresholds. This proactive monitoring keeps small issues from turning into major budget drains.
Advanced Plays and Why SaaSHero Fits This Approach
Layer in advanced strategies such as account-based marketing campaigns for named accounts, programmatic advertising for broader reach, and competitor conquesting campaigns to capture share from rivals. These tactics require precise tracking and strong landing page performance to pay off.

SaaSHero focuses on B2B SaaS paid media management with flat-fee retainers of $1,250-$5,000 per month instead of percentage-of-spend models that reward higher budgets. Their month-to-month agreements and senior-led execution have helped companies like TripMaster achieve 650% ROI and TestGorilla hit the 80-day payback benchmark.

Ready to implement revenue-first paid media analysis? Connect with SaaSHero’s experts, who have optimized more than $30 million in B2B SaaS ad spend, to discuss your specific growth goals.
Summary and Next Steps
Effective paid media analysis in B2B SaaS requires revenue-focused KPIs, sound attribution models, and continuous optimization around Net New ARR. This 7-step framework helps you uncover waste, shift budgets to high-performing channels, and support sustainable growth.
Start by auditing your current tracking setup, then roll out the revenue KPIs and attribution models described above. Concentrate on channels that bring in the highest quality leads and refine campaigns based on closed-won revenue instead of top-funnel metrics.
FAQ
What are the 2026 B2B SaaS paid media benchmarks?
Key benchmarks include CPL of $250-$450 across channels, ROAS of 4-6x for mature campaigns, the 3-5x LTV:CAC ratio mentioned earlier, and payback periods under 80 days. LinkedIn typically delivers higher lead quality with the 14-18% SQL rates shown earlier, while Google Search provides better volume at lower CPCs of $3.80-$7.60 compared to LinkedIn’s $40-$100 CPMs.
How do I fix poor attribution in my B2B SaaS paid media campaigns?
Start by enabling GCLID tracking for Google Ads and enforcing consistent UTM parameters across every campaign. Integrate your CRM with ad platforms so you can track the full customer journey from first click to closed-won revenue. Use multi-touch attribution models such as linear or time-decay instead of last-click attribution, and extend your attribution window to match your sales cycle length, which often runs 90-180 days for B2B SaaS.
Why should I choose SaaSHero for B2B SaaS paid media management?
SaaSHero offers transparent flat-fee pricing instead of percentage-of-spend models that reward higher budgets, month-to-month agreements that maintain accountability, and senior-led execution with deep B2B SaaS experience. Their track record includes helping TripMaster generate $504k in Net New ARR, TestGorilla achieve the 80-day payback benchmark, and Playvox cut cost per lead by 10x while increasing volume by 163%.

What’s the difference between LinkedIn and Google Ads for B2B SaaS?
LinkedIn works best for account-based marketing, thought leadership, and targeting specific job titles or company sizes, which suits high-value enterprise deals. Google Ads captures high-intent searches and competitor comparisons, delivering higher volume at lower costs. LinkedIn usually costs more per lead but delivers two to three times higher lead quality and conversion rates, while Google offers broader reach and faster scaling.
How long does it take to see results from paid media optimization?
Most teams see early gains in lead quality and cost efficiency within 2-4 weeks after fixing tracking and starting structured optimization. Revenue impact usually becomes clear over 3-6 months because of typical B2B SaaS sales cycle lengths. Focus on leading indicators such as SQL conversion rates and pipeline quality scores while you wait for closed-won revenue data to confirm long-term channel performance.