




Written by: Aaron Rovner, Founder, Saas Hero
Key Takeaways
- Traditional MQL or impression-based tracking misses ABM’s real revenue impact, so teams need engagement, pipeline, and revenue metrics instead.
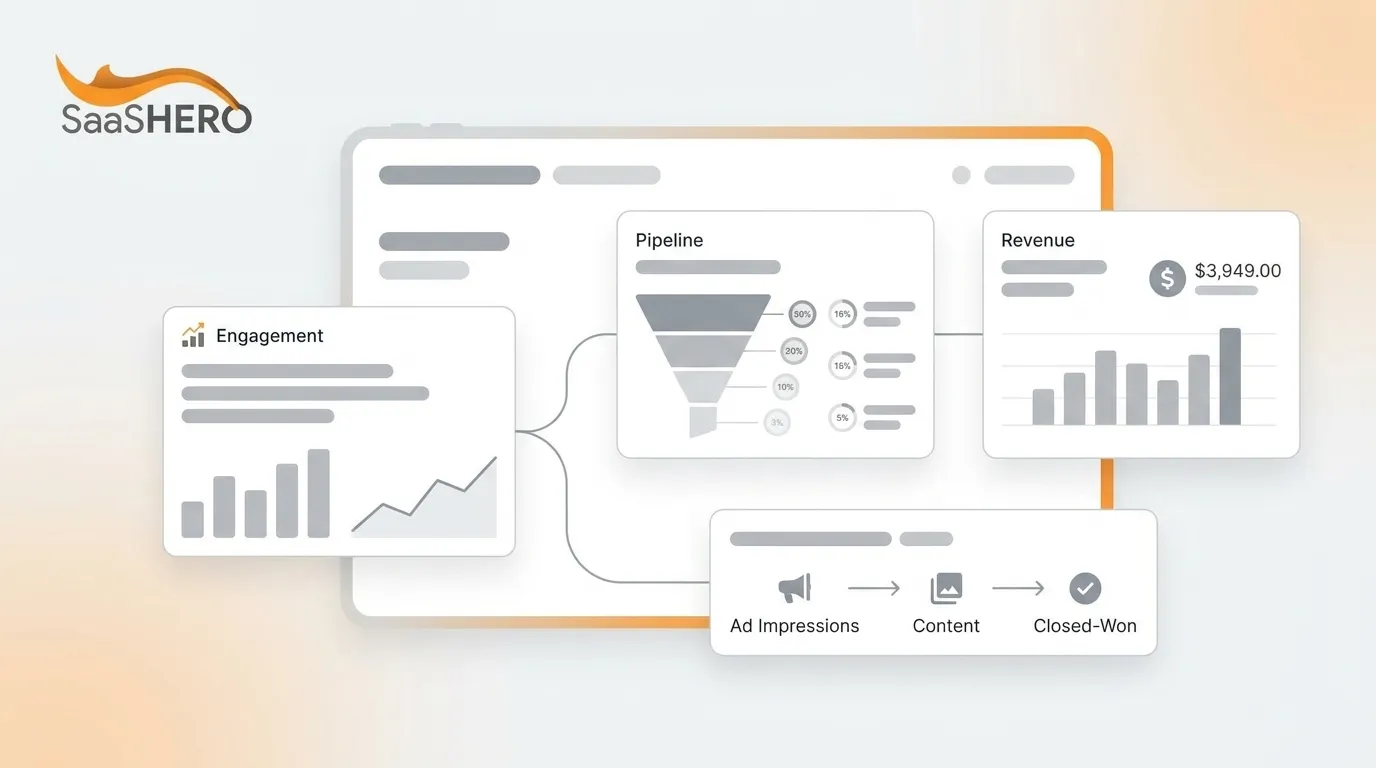
- A four-stage maturity model moves teams from basic GCLID capture to a unified executive dashboard that ties ad impressions to closed-won ARR.
- Core KPIs such as Account Engagement Score, Buying Group Penetration, Account-to-Opportunity Rate, Pipeline Velocity, and Win Rate by Tier give clear signals at every funnel stage.
- Revenue metrics like ABM-Influenced Revenue and CAC Payback by Tier prove net-new ARR impact and withstand CFO scrutiny on capital efficiency.
- SaaSHero helps B2B SaaS teams implement the full GCLID-to-closed-won tracking stack and executive dashboards, so you can schedule a measurement audit and uncover gaps in your current ABM reporting.
Executive Summary: Metric Categories and the Four-Stage Maturity Model
Engagement metrics act as leading indicators and show whether the right accounts are paying attention. Pipeline metrics sit in the middle of the funnel and reveal whether engaged accounts are turning into qualified revenue opportunities. Revenue metrics lag behind and confirm whether the program produced closed ARR at acceptable unit economics.
The four-stage maturity model maps how teams progress through these categories:
- Foundational Tracking, which covers GCLID capture, CRM account matching, and basic engagement scoring.
- Pipeline Visibility, which adds target account pipeline value, account-to-opportunity rate, and pipeline velocity lift versus a non-ABM baseline.
- Revenue Attribution, which introduces win rate by account tier, ABM-influenced revenue, and CAC payback by tier.
- Executive Dashboard, which consolidates all three categories into a single weekly scoreboard with owners, cadence, and data sources.
Early-stage ABM programs focus on coverage metrics to determine whether the right accounts are being reached, while mature programs shift focus to velocity and conversion metrics that show whether deals are accelerating. Most $5M–$50M ARR SaaS teams sit at Stage 1 or 2. This guide aims to move those teams to Stage 4.
The table below consolidates all core ABM metrics with definitions, 2025–2026 benchmarks, and CFO context, so you can reference it while reviewing the detailed breakdowns in later sections.
Core ABM Metrics Table
| Metric | Definition | 2025–2026 SaaS Benchmark | Why It Matters to CFOs |
|---|---|---|---|
| Account Engagement Score | Weighted composite of touchpoints (ad, content, demo) × recency across the buying group | Mature programs: 50+ touchpoints/quarter | Most predictive KPI for pipeline conversion, replaces MQL as the primary prioritization signal |
| Buying Group Penetration | % of key decision-makers and influencers within a target account reached by the program | Higher buying group penetration correlates with higher win rates | Directly predicts close rate, low penetration is a leading cause of stalled deals |
| Target Account Coverage | % of the ABM target list that has engaged with the brand | High coverage of target accounts is a key early indicator | Confirms that budget reaches the defined ICP instead of out-of-profile accounts |
| Account-to-Opportunity Rate | % of target accounts that generate a qualified pipeline opportunity | Opportunity creation rates are 18% (tier-1 median) and 3% (tier-3) | Connects engagement spend to pipeline creation, low rates signal ICP or messaging misalignment |
| Pipeline Velocity (ABM vs. non-ABM) | (Opportunities × Avg Deal Size × Win Rate) ÷ Avg Sales Cycle Length, compared to non-ABM baseline | Strong ABM programs achieve 1.6x–2x pipeline velocity versus non-ABM baseline | Faster velocity improves cash-flow forecasting and shortens CAC payback period |
| Win Rate by Account Tier | % of opportunities from each ABM tier that close as won | Median ABM win rate in 2026 sits at 38% for 1:1 programs, 24% for 1:few, and 14% for 1:many | Tier-level win rates reveal whether resource allocation matches account potential |
| ABM-Influenced Revenue | Closed-won ARR from deals where at least one buying group member engaged with an ABM program | Often significantly higher than strictly ABM-sourced revenue | Shows the full revenue contribution of the program to the board |
| CAC Payback Period (by tier) | CAC ÷ (monthly ARR per customer × gross margin), segmented by ABM tier | Healthy target: 12–18 months for growth-stage SaaS | Primary metric investors use to evaluate capital efficiency of the go-to-market motion |
| ABM Program ROI | (Revenue from ABM accounts − Total ABM program cost) ÷ Total ABM program cost × 100 | Average ABM program ROI: 137% | Converts program spend into a ratio the CFO can compare with other capital allocation options |
| Multi-Threading Depth | Number of unique stakeholders engaged per account before sales engagement | Multiple unique stakeholders per account | Gartner reports B2B buying groups include 6–10 people, and single-threaded deals churn faster |
Engagement Metrics That Predict Pipeline
Account Engagement Score aggregates intent signals, content consumption, and buying committee activity into a single prioritization number. As noted in the metrics overview, this score serves as the primary prioritization signal for sales outreach, replacing MQL volume as the key indicator of which accounts are ready for engagement. Weights typically assign ad impressions a value of 1, content downloads 5, and demo requests 10, with recency decay applied. Sales teams that focus outreach on accounts with the highest engagement scores usually see shorter sales cycles.
Buying Group Penetration reports the percentage of key decision-makers and influencers within target accounts that the program has reached. This metric highlights coverage gaps before accounts enter the pipeline. Forrester reports that 94% of sellers sell to groups of three or more stakeholders and 38% sell to groups of 10 or more, so single-contact engagement introduces structural risk to win rate.
Target Account Coverage measures the percentage of the ABM target list that has engaged with the brand. ABM teams should start with this metric alongside Account Engagement Score and Pipeline Velocity to cover the full funnel from reach to conversion.
Intent Surge tracks accounts that show a statistically significant spike in research activity on topics related to the product category. Many ABM teams now run combined intent and ABM programs, reflecting the growing view that intent data is a prerequisite for efficient account prioritization.
Pipeline Metrics That Reveal Velocity and Conversion
Target Account Pipeline Value captures the total dollar value of open pipeline sourced from the ABM target list. This metric forms the primary bridge between engagement spend and revenue forecasting. ABM programs often source a higher share of pipeline from marketing than broad-reach demand generation.
Pipeline Velocity ABM is calculated as (Opportunities × Average Deal Size × Win Rate) ÷ Average Sales Cycle Length, then compared against the non-ABM baseline. At elite ABM programs, ad-influenced target accounts move 234% faster through the pipeline than non-ABM accounts. Tier 1 accounts should show 20–40% faster pipeline velocity than non-ABM accounts, otherwise the program adds cost without accelerating revenue.
Account-to-Opportunity Rate measures the percentage of target accounts that generate a qualified pipeline opportunity. As shown in the metrics table, tier-1 accounts convert to opportunities at 18% while tier-3 accounts convert at 3%, which represents a 6x difference and exposes whether targeting and personalization are working.
Engagement-to-Opportunity Conversion Rate measures the percentage of engaged ABM accounts that generate qualified pipeline. Enterprise ABM programs often see higher conversion rates within 90 days than traditional demand generation programs.
Revenue Metrics That Prove Net-New ARR Impact
ABM ROI Calculation is expressed as (Revenue from ABM accounts − Total ABM program cost) ÷ Total ABM program cost × 100. Total program cost must include paid media, content production, ABM platform licenses, agency fees, and loaded sales and marketing headcount allocated to the program. Excluding headcount costs can understate CAC by 50%+, which inflates apparent ROI. As noted in the metrics table, mature ABM programs average 137% ROI, and a HockeyStack analysis of $10M in ABM ad spend across 44 B2B SaaS companies found ABM campaigns deliver 2.22x better spend-to-revenue ROI than non-ABM campaigns.
Win Rate by Account Tier provides the most direct signal of whether account selection and personalization work as intended. Companies like Snowflake show that effective ABM execution can more than double win rates compared with non-ABM approaches, which validates the additional investment in targeting and content.
CAC Payback Period is calculated as CAC ÷ (monthly ARR per customer × gross margin). B2B SaaS companies typically see median CAC payback periods of 12–18 months depending on growth stage. ABM programs should segment this metric by tier because one-to-one strategic accounts usually carry higher CAC, which only makes sense when ACV and retention justify the spend.
ABM-Influenced Revenue tracks closed-won ARR from deals where at least one buying group member engaged with an ABM campaign. Many ABM teams skip total influenced revenue, which means they systematically underreport their contribution to the board.

North-Star Executive Dashboard Structure
| Metric | Owner | Cadence | Data Source |
|---|---|---|---|
| Account Engagement Score (avg, top 50 accounts) | Marketing Ops | Weekly | ABM platform + CRM |
| Buying Group Penetration (% per Tier 1 account) | Marketing Ops | Weekly | CRM + LinkedIn Ads |
| Target Account Pipeline Value ($) | RevOps | Weekly | Salesforce / HubSpot |
| Pipeline Velocity Lift vs. non-ABM (%) | RevOps | Monthly | Salesforce / HubSpot |
| Win Rate by Account Tier (%) | RevOps | Quarterly | Salesforce / HubSpot |
| ABM-Influenced Revenue ($) | VP Marketing | Quarterly | CRM + Attribution tool |
| CAC Payback Period by Tier (months) | Finance / RevOps | Quarterly | CRM + Finance system |
| ABM Program ROI (%) | VP Marketing | Quarterly | CRM + Ad platforms |
Effective executive dashboards limit core KPIs to a small number of metrics, because dashboards with too many KPIs often lose trust and focus. After you select the core metrics, set refresh cadences that match each metric’s natural pace. Engagement scores should refresh daily to guide immediate outreach decisions, pipeline metrics weekly to inform forecast calls, and revenue metrics quarterly to align with board reporting cycles. This structure keeps the dashboard focused on recent, actionable engagement data instead of noisy, stale numbers.
Metrics to Avoid in ABM Reporting
Three metrics actively mislead ABM decision-making and should be removed from executive reporting.
Impressions measure delivery, not engagement. An account that receives 10,000 impressions and never advances a stakeholder remains a cost center, not a pipeline contributor.
CTR (Click-Through Rate) optimizes for curiosity, not buying intent. High CTR on out-of-ICP accounts inflates engagement scores and distorts pipeline forecasts.
MQL volume measures individuals, not accounts, and rewards marketing for quantity rather than account advancement. MQL volume is the wrong success metric for ABM because MQLs measure individuals, not accounts, and reward marketing for quantity rather than account advancement. Demandbase uses the Marketing Qualified Account (MQA) metric instead of the person-based MQL because account-level engagement is a better indicator of potential buying activity.
With the right metrics identified and vanity metrics removed, the next step involves building the technical infrastructure that makes revenue-first measurement possible.
Implementation: Connecting Ad Impressions to Closed-Won Revenue
The technical foundation of revenue-first ABM measurement relies on a clean data chain from ad click to CRM closed-won record. Teams can follow a four-step implementation sequence.
Step 1 — GCLID and UTM capture. Every Google Ads click passes a GCLID parameter. Every LinkedIn Ads click passes UTM parameters. These values must be captured in a hidden form field on every landing page and written to the CRM contact or lead record at form submission.
Step 2 — Lead-to-account matching. Incoming leads must be matched to existing CRM accounts using domain, company name, and phone number fuzzy matching. Tools like LeanData automate this process and can achieve match rates above 90% when configured correctly. Without this step, ad-sourced contacts float as orphaned leads and never credit the target account.
Step 3 — Opportunity and closed-won attribution. In Salesforce, use Campaign Member records or a custom ABM Influence object to associate the GCLID-stamped contact with the Opportunity. In HubSpot, use the Attribution Report builder with multi-touch models. The recommended multi-touch attribution model for ABM is W-shaped attribution, which assigns 30% credit to the first touch, 30% to the touch that created an SQL, 30% to the touch that created an opportunity, and 10% across remaining touches.
Step 4 — Closed-won data back to ad platforms. Import closed-won revenue events back into Google Ads and LinkedIn Campaign Manager as offline conversions. This setup allows the platforms to adjust bidding toward accounts that actually close, not just accounts that fill out forms.
Building and maintaining this infrastructure sits at the core of SaaSHero’s revenue-first methodology. The agency implements the full GCLID-to-closed-won tracking stack during onboarding, then connects it to Looker Studio or native CRM dashboards so that pipeline and revenue data stay visible without manual exports. See how SaaSHero implements this four-step tracking infrastructure for B2B SaaS teams, from GCLID capture through closed-won attribution.

Three Team Archetypes and Their Measurement Pain Points
The Bootstrap Founder runs Google Ads on weekends and has no CRM attribution beyond last-click. The immediate priority is Step 1 and Step 2 of the implementation sequence above, which cover GCLID capture and lead-to-account matching. Without these steps, no ABM metric above Stage 1 can be calculated.
The Series-B Migrator has a VP Marketing receiving monthly PDF reports showing impressions and CTR from an agency billing on percentage-of-spend. The board asks about pipeline and CAC. This team should replace the vanity metric dashboard with the executive dashboard table above and implement W-shaped attribution in HubSpot or Salesforce.
The Post-Funding Scaler has just raised a Series A and needs to deploy $30K–$50K per month efficiently against aggressive ARR targets. The priority is Stage 3 and Stage 4 of the maturity model, which focus on revenue attribution and the executive dashboard. ABM programs show varying lifts such as 38% win rates vs 9% non-ABM baseline and 30–91% higher average deal sizes, depending on the report and program tier, but only when targeting, tracking, and reporting infrastructure direct spend toward the right accounts.
Frequently Asked Questions
What is the single most important ABM metric for a B2B SaaS company to track?
For most teams below Stage 3 maturity, Account Engagement Score offers the highest leverage because it is both actionable and predictive. It tells sales which accounts to prioritize today and tells marketing which programs generate genuine buying-group activity. Once the team reaches Stage 3, Win Rate by Account Tier becomes the north-star metric because it directly validates whether the entire ABM investment across targeting, content, personalization, and sales alignment produces closed ARR at the expected rate for each tier.
How long does it take to see meaningful ABM results?
Leading indicators such as Account Engagement Score and Buying Group Penetration usually appear within 30–60 days of consistent multi-channel execution. Pipeline metrics such as Account-to-Opportunity Rate typically materialize within 60–90 days. Revenue metrics including Win Rate by Account Tier and ABM-Influenced Revenue require 6–12 months for statistically meaningful data, which reflects the length of enterprise SaaS sales cycles. Teams that expect revenue attribution data in the first quarter often misread early program performance and shut down programs prematurely.
Who should own the ABM executive dashboard?
RevOps should own the data infrastructure and pipeline metrics. Marketing Ops should own engagement metrics and coverage reporting. The VP Marketing or CMO should own the quarterly revenue and ROI metrics presented to the board. Without a single RevOps owner responsible for data integrity, dashboards accumulate conflicting definitions of “influenced” versus “sourced” revenue, which destroys executive trust in the numbers. A weekly ABM pod meeting that includes marketing, sales, and RevOps provides a practical cadence for reviewing leading indicators and resolving attribution disputes before they reach the board.
What is a realistic ABM ROI benchmark for a $10M–$50M ARR SaaS company?
The average ABM program ROI reaches 137% within 18 months, based on ITSMA research on mature programs. Strong programs reach 200–400% ROI and elite programs exceed 400%. These figures require a 12–18 month measurement window and fully loaded cost accounting that includes headcount, technology, agency fees, and content production. Teams that calculate ROI using only paid media spend will overstate returns and set unrealistic expectations for later budget cycles. The more operationally useful benchmark is CAC Payback Period by tier, where under 14 months for the $10M–$50M ARR segment represents a healthy 2026 target.
How do you attribute revenue to ABM when deals involve multiple marketing programs?
W-shaped multi-touch attribution works best for ABM programs. It assigns 30% credit to the first touch, 30% to the touch that created a Sales Qualified Lead, 30% to the touch that created an Opportunity, and distributes the remaining 10% across all other touches in the buying journey. This model respects the non-linear nature of B2B buying cycles and avoids the distortions of last-click attribution, which systematically undervalues top-of-funnel ABM awareness activities. For deals with 6–18 month cycles, last-click attribution usually credits a brand search or SDR call while ignoring the six months of account-level advertising that created the buying intent in the first place.
Conclusion: Run an Internal ABM Metrics Audit
The framework above, which includes three metric categories, a four-stage maturity model, a ready-to-use executive dashboard, and a four-step tracking implementation, gives VP Marketing, Growth, and RevOps leaders a structure to replace vanity reporting with revenue accountability. ABM programs achieve 36–38% higher win rates and 30–91% larger average deal sizes than non-ABM approaches, but those outcomes only become visible when measurement infrastructure connects ad impressions to closed-won ARR.

The practical next step is an internal metrics audit. Pull the last 90 days of marketing reporting and identify which metrics map to the engagement, pipeline, and revenue categories above, and which metrics still reflect impressions, CTR, or MQL volume. The gap between what you currently track and what the framework requires becomes your implementation roadmap.
SaaSHero builds the tracking, reporting, and decision systems that convert account-based programs into measurable pipeline and closed revenue, from GCLID capture through Salesforce closed-won attribution to the executive dashboard. Walk through your current ABM measurement stack with SaaSHero’s team and identify the highest-leverage gaps between your reporting and this revenue-first framework.