

Key Takeaways
- Data-driven lead scoring uses AI, machine learning, and behavioral signals to prioritize high-value enterprise B2B prospects and lift SQL conversion rates by 25% or more.
- Define your ICP with firmographic data, such as 500-5,000 employee companies in HR Tech or Cybersecurity, to target high LTV accounts with shorter sales cycles.
- Combine explicit criteria like C-level titles worth +20 points with implicit signals such as pricing page visits worth +35 points, plus technographic data, to improve prediction accuracy.
- Set MQL and SQL thresholds at 70 points or higher for sales handoff, and aim for 25-35% conversion rates supported by continuous AI model refinement and feedback loops.
- Partner with SaaSHero for expert implementation that drives measurable Net New ARR growth and capital-efficient scaling.
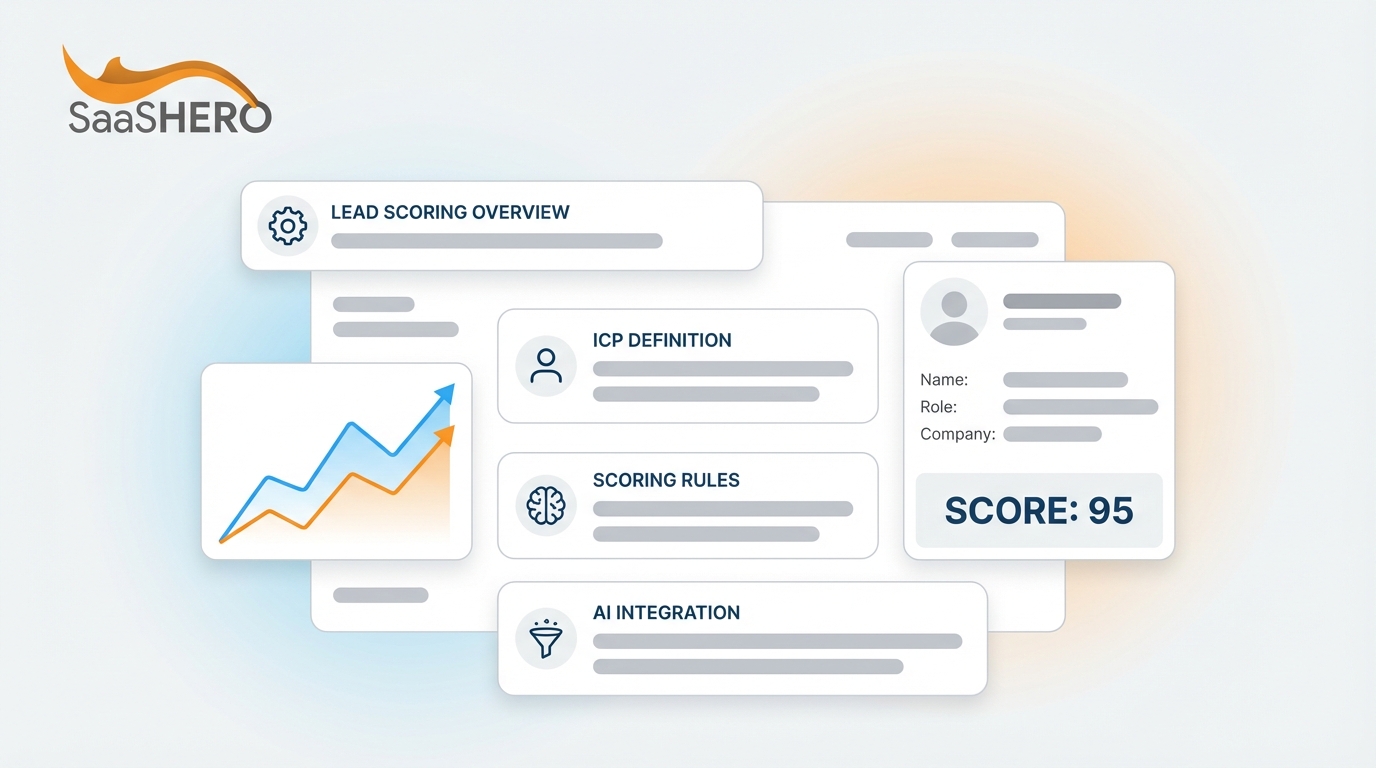
How Data-Driven B2B Lead Scoring Works
Data-driven B2B lead scoring uses artificial intelligence, machine learning, and CRM automation to evaluate prospects with explicit firmographic data and implicit behavioral signals. This predictive method assigns numerical scores to leads based on their likelihood to become paying customers, so sales teams can focus on the highest-value opportunities.
Traditional qualification relies on subjective assessments, while data-driven scoring uses historical conversion patterns, customer success metrics, and real-time engagement data. Modern marketing operating systems provide unified attribution and real-time ROI measurement, which supports continuous refinement of scoring models based on real revenue instead of vanity metrics.
Step 1: Define an Enterprise ICP with Real Data
Enterprise ideal customer profile definition starts with data analysis of existing customers that deliver the highest lifetime value and the shortest sales cycles. Use platforms such as ZoomInfo, Salesforce, and HubSpot to uncover firmographic patterns across your most successful accounts.
Focus on measurable characteristics that correlate with revenue outcomes. Companies with 100-5,000 employees often receive +25 points in scoring models, while revenue ranges of $10M-$50M receive higher point values. Deduct points for companies under $1M in revenue, since they usually lack budget authority for enterprise solutions.
| ICP Criteria | Range | Points | Example |
|---|---|---|---|
| Industry Vertical | HR Tech, Cybersecurity | +50 | HR Technology |
| Employee Count | 500-5,000 | +25 | 1,200 employees |
| Annual Revenue | $10M-$100M | +30 | $45M ARR |
| Geographic Region | North America, EU | +15 | United States |
SaaSHero supports B2B SaaS companies in verticals such as HR Tech and Cybersecurity and brings experience that aligns ICP development with your specific market dynamics.

Step 2: Create Explicit and Implicit Scoring Rules
Modern lead scoring improves on traditional BANT frameworks by adding predictive behavioral signals and technographic data. Explicit criteria cover information prospects share directly, such as job titles, company size, and stated budget. Implicit criteria capture behavioral patterns that signal purchase intent.
Technographic scoring adds +15 points for prospects using complementary tools like Salesforce when your product offers native integrations. Behavioral scoring assigns different point values based on engagement depth and intent strength.
| Scoring Criteria | Type | Points | Example |
|---|---|---|---|
| C-Level Title | Explicit | +20 | Chief Marketing Officer |
| Pricing Page Visit | Implicit | +35 | Competitor pricing research |
| Demo Request | Explicit | +25 | Scheduled product demonstration |
| Email Engagement | Implicit | +10 | Opened 3+ nurture emails |
Behavioral scoring often assigns +15-20 points for pricing page visits and +3-5 points for blog post engagement, which reflects different levels of purchase intent. Negative scoring removes points for low-fit actions, such as visiting career pages worth -10 points or bouncing immediately from key pages worth -5 points.
Step 3: Connect AI, Machine Learning, and Your CRM
Enterprise lead scoring works best when marketing automation platforms, CRM systems, and AI-powered predictive tools operate together. HubSpot and Salesforce provide native machine learning features that analyze historical conversion patterns and generate likelihood-to-close scores automatically.
Set up real-time scoring workflows that update lead scores after every interaction, from email opens to website behavior. Predictive scoring with HubSpot AI analyzes closed-won and closed-lost deals to generate accurate likelihood-to-close scores, which supports more precise qualification.
Implement GCLID-to-ARR tracking that connects initial ad clicks to the full customer journey and final revenue. This attribution model supports decisions based on actual revenue outcomes instead of surface-level engagement metrics and keeps your scoring model improving with real business results.
Step 4: Calibrate MQL and SQL Thresholds for Enterprise Sales
Enterprise MQL-to-SQL thresholds should reflect sales capacity and historical conversion performance. Top-performing B2B teams in 2026 reach 25-35% MQL-to-SQL conversion rates, while industry averages sit at 18-22%.
| Score Range | Classification | Action | Expected Conversion |
|---|---|---|---|
| 0-30 | Cold Lead | Nurture Campaign | 5-8% |
| 31-69 | Marketing Qualified | Targeted Content | 15-20% |
| 70-89 | Sales Qualified | Direct Outreach | 25-35% |
| 90+ | Hot Prospect | Immediate Contact | 40-50% |
Enterprise segments often require multi-stakeholder engagement for SQL qualification, while mid-market companies can qualify faster with single demo requests. Adjust thresholds by deal size and complexity to protect sales efficiency.
Step 5: Run Continuous Feedback Loops and Testing
Ongoing feedback loops keep your scoring model aligned with changing markets and buyer behavior. Regular A/B testing of scoring criteria and thresholds can sustain 20-30% efficiency gains each quarter.
Hold weekly sales and marketing alignment meetings to review SQL quality and conversion rates. Capture disqualification reasons in your CRM to uncover patterns and adjust scoring rules. Quarterly reviews should refine score thresholds and trigger automated improvements in your CRM.
Machine learning models need constant training on new conversion data to stay accurate. Configure automated retraining schedules that use the latest closed-won and closed-lost data so predictive models match current market conditions and buyer preferences.
Book a discovery call to set up feedback loops that steadily improve lead scoring accuracy and SQL conversion rates.

Step 6: Track ROI with Core SaaS Revenue Metrics
Enterprise B2B SaaS teams should measure lead scoring ROI with revenue-focused metrics instead of vanity indicators. Track Customer Acquisition Cost payback periods, since leading companies reach sub-90-day payback through higher lead quality.
B2B technology companies that refine sales processes see 28% shorter sales cycles and win rates that rise by seven percentage points. Prioritize Net New ARR attribution, pipeline velocity, and sales cycle compression as primary success measures.
Calculate incremental revenue from improved lead scoring by comparing conversion rates before and after rollout. SaaSHero focuses on revenue metrics such as Net New ARR, which appear clearly in client results.
Step 7: Scale Enterprise Scoring with a Specialist Partner
Enterprise lead scoring at scale requires expertise in CRM configuration, AI model training, and sales and marketing alignment. Internal teams often lack the technical depth and benchmarks needed for strong performance across complex segments.
SaaSHero offers month-to-month, flat-fee partnerships that remove long-term contract risk and provide senior-level B2B SaaS growth expertise.

Work with specialists who understand enterprise SaaS metrics, buyer journeys, and the technical demands of advanced scoring models. This experience shortens implementation timelines and helps your scoring system deliver measurable revenue impact from the first quarter.
Enterprise Pitfalls and Real-World Success Stories
Common failures include ignoring competitor conquest signals, misaligning sales and marketing incentives, and chasing lead volume instead of quality. High-quality SQLs that match ideal customer profiles increase win rates and improve revenue efficiency.
SaaSHero clients such as TripMaster generated $504,758 in Net New ARR, while TestGorilla reached 80-day CAC payback periods that supported a $70M Series A round, which shows the impact of revenue-focused scoring.

Enterprise success depends on treating lead scoring as a revenue system, not just a marketing tool. Keep attention on business outcomes, maintain tight sales and marketing alignment, and refine models based on closed revenue data instead of engagement alone.
Conclusion and Next Steps for Enterprise Teams
Data-driven enterprise B2B lead qualification and scoring turn marketing spend into predictable revenue growth. This seven-step framework creates a foundation for SQL conversion lifts of 25% or more and clear Net New ARR gains.
Book a discovery call with SaaSHero for a custom lead scoring audit that uncovers immediate opportunities and unlocks your next stage of enterprise SaaS growth.
Frequently Asked Questions
How explicit and implicit lead scoring criteria differ
Explicit lead scoring criteria rely on information prospects share directly, such as job title, company size, industry, and stated budget. Teams usually collect this data through forms, surveys, or direct conversations. Implicit criteria rely on behavioral signals and engagement patterns that appear as prospects interact with your content, website, and marketing assets. Examples include email open rates, website page visits, content downloads, and time spent on specific pages. Implicit scoring adds value because it reveals real interest and intent instead of only demographic fit.
How often enterprise B2B companies should update lead scoring models
Enterprise B2B lead scoring models should receive a formal review and update at least once per quarter, with ongoing monitoring of key performance indicators. Teams should adjust scoring criteria and point values based on actual conversion data, sales feedback, and market shifts. Machine learning components should be retrained monthly with the latest closed-won and closed-lost data to protect predictive accuracy. Major changes in product, target market, or competition may require immediate model updates so scoring stays aligned with current business goals.
Target MQL-to-SQL conversion rates for enterprise B2B SaaS
Enterprise B2B SaaS companies should aim for MQL-to-SQL conversion rates between 25% and 35% to reach top-tier performance, while recognizing that results vary by industry, deal size, and sales cycle complexity. Average performers often see 18-22% conversion, and underperforming teams may fall below 15%. Enterprise segments sometimes accept lower conversion rates because of longer cycles and multiple stakeholders, but they should balance that with higher deal values and stronger lifetime value. The priority should be SQL quality and progression through the funnel, not only the initial conversion percentage.
How AI and machine learning improve lead scoring accuracy
AI and machine learning improve lead scoring by analyzing large volumes of historical data and uncovering patterns that humans often miss. These technologies process many data points at once, including behavioral signals, engagement timing, and interaction sequences, to predict conversion likelihood more accurately. Machine learning models keep learning from new data and adjust scoring criteria based on real outcomes instead of static rules. They also reveal non-obvious correlations between different factors and conversion success, which supports more advanced qualification. AI can also refresh scores in real time as prospects engage with your content so sales teams always see the most current view of lead quality.
Key metrics for measuring lead scoring ROI in enterprise SaaS
Key metrics for lead scoring ROI include Customer Acquisition Cost reduction, sales cycle compression, and Net New ARR attribution. Track percentage improvements in MQL-to-SQL conversion rates, average deal size from scored leads compared with unscored leads, and time from first touch to closed-won revenue. Pipeline velocity shows how quickly qualified leads move through stages, while win rate improvements highlight gains in lead quality. Also track sales team efficiency with metrics such as calls-to-close ratios and quota attainment for leads generated through your scoring system compared with other sources.