

Written by: Aaron Rovner, Founder, Saas Hero
Key Takeaways
-
Track 12 core GTM metrics like CAC (about $702 average, under 12‑month payback), LTV:CAC (3:1+), and Rule of 40 (above 40%) to prove B2B SaaS unit economics in 2026.
-
Hit Lead Velocity Rate of 15-25% month over month and Trial-to-Paid conversions of 5-9% to build a healthy pipeline and strong activation.
-
Target NRR of 110-120% and GRR of 90% or higher through focused retention strategies, segmented by verticals like HR Tech and Cybersecurity.
-
Improve Pipeline Velocity and Sales Cycle Length (90+ days mid-market) with CRM integrations and weekly reviews to speed up revenue flow.
-
Set up GA4-CRM dashboards with SaaSHero’s expertise by scheduling a discovery call and build reliable GTM tracking systems.
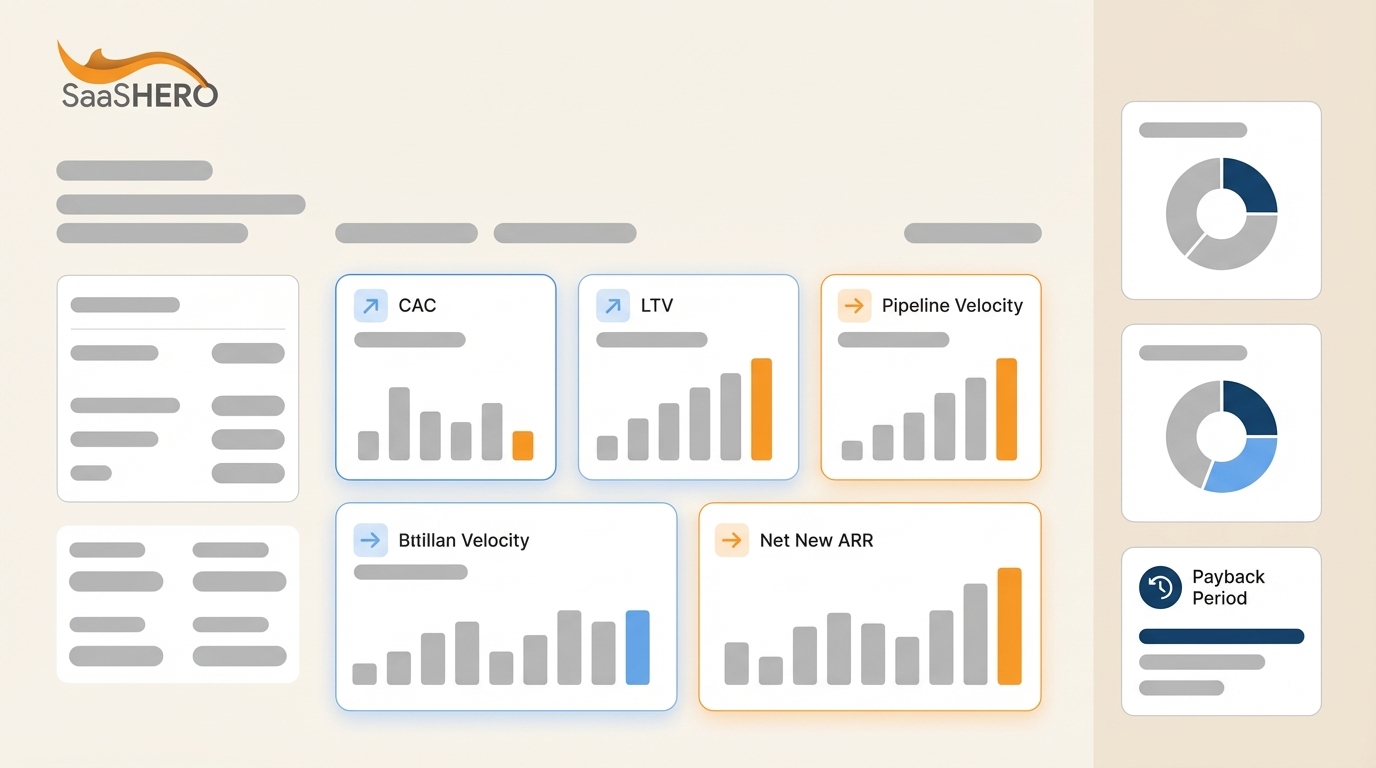
12 Essential B2B SaaS GTM Metrics You Need to Track
Customer Acquisition Metrics That Drive Growth
1. Customer Acquisition Cost (CAC) shows how much you spend to win each new customer. For B2B SaaS technology implementations, CAC includes all sales and marketing expenses divided by new customers acquired. The average SaaS CAC is approximately $702, with SMB SaaS typically ranging from $300 to $800.
-
Formula: (Total Sales Spend + Marketing Spend) / Number of New Customers
-
2026 Benchmark: HR Tech $400-600, Cybersecurity $800-1,200
-
Implementation: Track in HubSpot attribution reports, include salary costs, exclude customer success
-
Tech Implementation Tip: Pass GCLID from Google Ads into Salesforce for accurate channel attribution
2. Lead Velocity Rate (LVR) shows future pipeline health by tracking month-over-month qualified lead growth. LVR offers predictive value for long B2B SaaS sales cycles and signals revenue trends before they appear in closed deals.
-
Formula: ((This Month’s MQLs – Last Month’s MQLs) / Last Month’s MQLs) × 100
-
2026 Benchmark: 15-25% monthly growth for healthy SaaS
-
Implementation: Configure lead scoring in marketing automation and keep the MQL definition consistent
-
Tech Implementation Tip: Segment LVR by ICP traits to see performance by vertical
Activation Metrics That Turn Interest Into Product Use
3. Trial-to-Paid Conversion Rate shows what percentage of trial users become paying customers. Strong benchmarks show 9% conversion rates, and PLG motions often land between 5% and 9% free-to-paid.
-
Formula: (Paid Customers from Trial / Total Trial Users) × 100
-
2026 Benchmark: HR Tech 8-12%, Cybersecurity 4-7% because of longer evaluations
-
Implementation: Track trial start, feature usage, and conversion events in product analytics
-
Tech Implementation Tip: Measure time-to-value during onboarding and reduce steps to first “aha” moment
4. Product Adoption Rate shows how actively users engage with key product features after implementation. This metric confirms whether technology rollouts deliver the expected business outcomes and user satisfaction.
-
Formula: (Users Completing Key Actions / Total Active Users) × 100
-
2026 Benchmark: 20-40% activation rate median
-
Implementation: Define key actions for each persona and track them in product analytics tools
-
Tech Implementation Tip: Build adoption dashboards for customer success teams to guide playbooks
Revenue Metrics That Prove Financial Impact
5. Lifetime Value (LTV) estimates total revenue from a customer over the full relationship. Healthy LTV:CAC ratios target 4:1, with 3:1 as minimum for sustainable B2B SaaS growth.
-
Formula: Average Revenue Per User × Customer Lifespan × Gross Margin %
-
2026 Benchmark: 3:1 minimum LTV:CAC, 4:1 or higher target
-
Implementation: Calculate cohort-based LTV and segment by acquisition channel and customer size
-
Tech Implementation Tip: Use predictive models to estimate LTV for newer customers with limited history
6. Win Rate shows how effectively your sales team closes qualified opportunities. This metric reflects product-market fit, competitive strength, and sales process quality across different technology verticals.
-
Formula: (Closed-Won Deals / Total Qualified Opportunities) × 100
-
2026 Benchmark: 15-25% overall B2B SaaS, with variation by ACV and vertical
-
Implementation: Track in your CRM with clear and consistent opportunity qualification rules
-
Tech Implementation Tip: Capture win and loss reasons by competitor and use case for better feedback loops
Scale your GTM metrics tracking with a structured plan. Book a discovery call to set up revenue-focused measurement systems.

Retention Metrics That Protect and Grow ARR
7. Gross Revenue Retention (GRR) shows how much revenue you keep from existing customers, without counting expansion. 2026 benchmarks target 85-95% overall, with B2B SaaS above 90% for strong retention.
-
Formula: ((Starting ARR – Churned ARR) / Starting ARR) × 100
-
2026 Benchmark: 90% or higher enterprise, 85-88% median private SaaS
-
Implementation: Track GRR by monthly cohorts and exclude expansion revenue
-
Tech Implementation Tip: Watch usage decline and support tickets as early churn signals
8. Net Revenue Retention (NRR) combines retention and expansion to show total revenue change from existing customers. Median NRR for private SaaS companies is 101-102%, and top performers often exceed 120%.
-
Formula: ((Starting ARR + Expansion – Contraction – Churn) / Starting ARR) × 100
-
2026 Benchmark: 110-120% for growth-stage, 100-110% median
-
Implementation: Include upsells, cross-sells, and price increases in expansion
-
Tech Implementation Tip: Segment NRR by customer size and vertical to shape account strategies
Velocity Metrics That Speed Up Deals
9. Pipeline Velocity shows how quickly revenue moves through your sales funnel. This metric supports better resource planning and more accurate forecasts for B2B SaaS with complex sales cycles.
-
Formula: (Number of Opportunities × Average Deal Value × Win Rate) / Sales Cycle Length
-
2026 Benchmark: Varies by ACV, with SMB cycles faster and enterprise cycles slower
-
Implementation: Track time in each stage and flag bottlenecks
-
Tech Implementation Tip: Use sales intelligence tools to prioritize high-velocity opportunities
10. Sales Cycle Length measures the average time from first qualified lead to closed deal. Micro-commitments can shorten sales cycles by 30% in complex B2B technology sales.
-
Formula: Average days from MQL to Closed-Won
-
2026 Benchmark: 90+ days mid-market, 180+ days enterprise
-
Implementation: Measure by deal size, vertical, and lead source
-
Tech Implementation Tip: Design stage-specific tactics that remove friction and speed decisions
Efficiency Metrics That Protect Capital
11. CAC Payback Period shows how quickly you recover acquisition spend through gross margin. Excellent payback periods are 12-15 months, which matters in a tighter 2026 funding climate.
-
Formula: CAC / (Monthly Recurring Revenue × Gross Margin %)
-
2026 Benchmark: Under 12 months excellent, under 18 months acceptable
-
Implementation: Calculate by acquisition channel and customer segment
-
Tech Implementation Tip: Track payback trends monthly to catch rising CAC early
12. Rule of 40 blends growth and profitability into one efficiency score. Scores above 40% indicate strong performance that investors value and that supports long-term growth.
-
Formula: Revenue Growth Rate % + Profit Margin %
-
2026 Benchmark: Above 40% for VC appeal, above 50% considered excellent
-
Implementation: Use EBITDA margin for the profitability input
-
Tech Implementation Tip: Adjust growth investments while watching margin to keep Rule of 40 on target
2026 B2B SaaS GTM Dashboard Setup Framework
Effective GTM performance tracking relies on connected systems that tie marketing attribution to closed revenue. Use a clear implementation plan and align tools, teams, and reporting.
-
GA4-CRM Integration: Connect Google Analytics 4 with HubSpot or Salesforce using GCLID tracking for full-funnel attribution
-
Vertical Segmentation: Build separate dashboards for HR Tech, Cybersecurity, and other verticals with tailored benchmarks
-
Weekly Revenue Reviews: Run recurring meetings focused on Net New ARR, pipeline health, and efficiency metrics
-
Automated Reporting: Use Looker Studio or similar tools for real-time dashboards and clear stakeholder visibility
|
Implementation Step |
Required Tools |
Timeline |
Success Metric |
|---|---|---|---|
|
Attribution Setup |
GA4, HubSpot, Salesforce |
2-3 weeks |
90%+ lead source accuracy |
|
Dashboard Creation |
Looker Studio, Tableau |
1-2 weeks |
Real-time metric visibility |
|
Team Training |
Internal workshops |
1 week |
100% team adoption |
|
Optimization Process |
Weekly reviews |
Ongoing |
Improved metric trends |
GTM Metrics FAQs for B2B SaaS Leaders
Ideal 2026 LTV:CAC Ratios for B2B SaaS
The ideal LTV:CAC ratio for B2B SaaS in 2026 is 4:1 or higher, with 3:1 as the minimum for sustainable growth. Ratios below 2:1 signal inefficient acquisition strategies that need immediate changes. Growth-stage companies should aim for 3:1 to 5:1, while mature SaaS businesses can maintain higher ratios through stronger retention and expansion revenue.
How to Measure CAC Payback Period for SaaS Tech
CAC Payback Period equals Customer Acquisition Cost divided by the product of Monthly Recurring Revenue and Gross Margin percentage. For implementation, track total sales and marketing spend in HubSpot or Salesforce, divide by new customers acquired, then divide by monthly revenue per customer multiplied by gross margin. Payback under 12 months is excellent, while 18 months or more suggests acquisition inefficiency and a need to refine channels.
Best GTM Metrics for Long B2B Sales Cycles
Long B2B sales cycles benefit most from forward-looking metrics such as Pipeline Velocity, Lead Velocity Rate, and detailed Win Rate analysis. Pipeline Velocity shows revenue flow speed through stages, while Lead Velocity Rate offers early signals of future pipeline strength. Win Rate segmented by deal size, vertical, and competitor highlights process gaps. Also track stage conversion rates and average time in each stage to uncover bottlenecks and acceleration opportunities.
How Rule of 40 Guides SaaS GTM in 2026
Rule of 40 tracks the balance between growth rate and profitability, and scores above 40% show strong SaaS performance in a capital-constrained 2026 environment. Calculate it by adding revenue growth percentage to EBITDA margin percentage. Companies above 50% show exceptional efficiency, while scores below 30% point to needed improvements in growth, profitability, or both. This metric helps leadership balance aggressive GTM spend with healthy unit economics.
GTM Metrics That Vary Most by B2B SaaS Vertical
CAC varies heavily by vertical, with HR Tech often at $400-600 and Cybersecurity at $800-1,200 because of longer evaluations and higher security demands. Trial-to-paid conversion rates also differ, with HR Tech at 8-12% and Cybersecurity at 4-7% due to extended proof-of-concept periods. Sales cycle length ranges from 60-90 days for HR Tech to 120-180 days for Cybersecurity, which directly affects pipeline velocity and forecast accuracy.
Get support implementing these GTM performance metrics for your B2B SaaS technology deployment. Book a discovery call for tailored benchmarks and tracking systems.

Conclusion: Turn GTM Metrics Into a Revenue Engine
The 12 core GTM performance metrics above create a clear framework for capital-efficient B2B SaaS growth in 2026. Focus first on three critical metrics: CAC Payback Period under 12 months, Rule of 40 above 40%, and consistent Net New ARR tracking. These numbers prove unit economic strength and sustainable growth patterns to investors and internal stakeholders.
SaaSHero builds tracking systems that connect ad performance directly to revenue outcomes with flat-fee pricing and month-to-month flexibility. Unlike traditional agencies that charge a percentage of spend, SaaSHero focuses on measurable outcomes, such as TestGorilla’s 80-day payback period and TripMaster’s $504k Net New ARR growth.

Turn your GTM performance metrics tracking into a predictable revenue system. Book a discovery call to roll out these 12 metrics with expert guidance and proven playbooks.